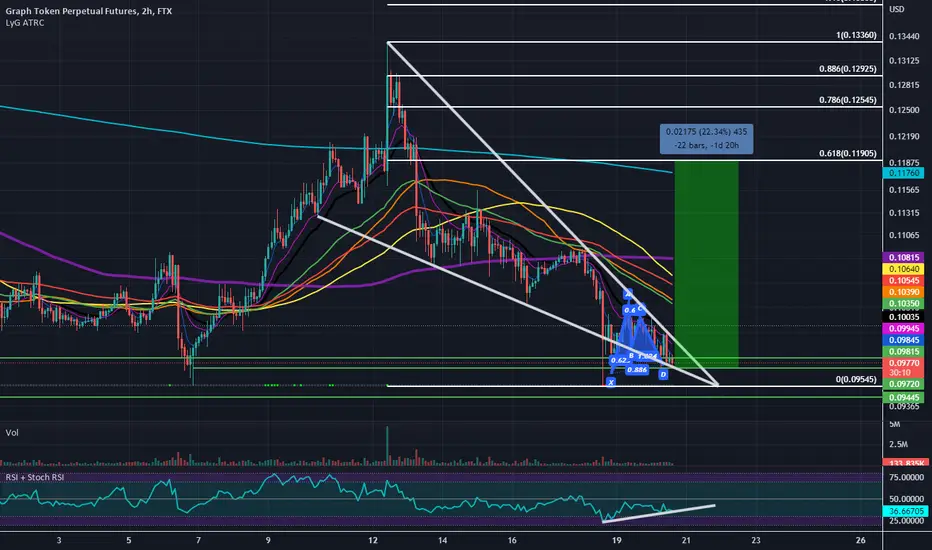
$TRB - Double Bullish DivergenceHello my Fellow TraderZ,
$TRB is ranging inside a FALLING WEDGE Pattern on 4 HTF.
I've mentioned here that the Double BULLISH DIVERGENCE is in formation on 4H RSI.
Price is just getting hit by EMA 55 if clears and breaks out of the Wedge Pattern, we can see the mentioned targets.
Also if we lose $14.7 , look for SHORT,
Trade well FAM. CHEERS!!!
Bullish Divergence

AUDCHF Short Term Buy IdeaD1 - Price is bouncing higher from a key support zone.
Bullish divergence.
H1 - Bullish divergence.
Higher highs.
Until the key support zone holds I expect the price to move higher further in the short term after pullbacks.

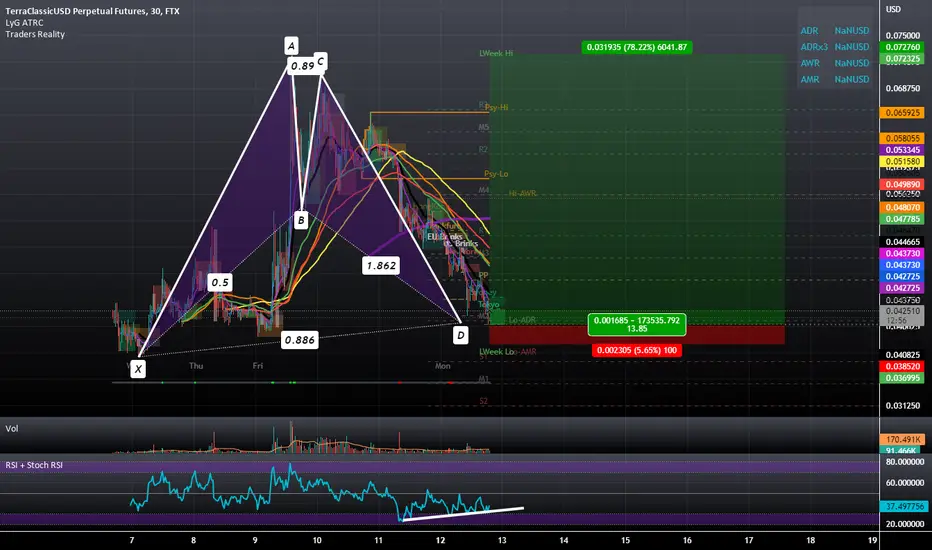
$LUNA - Still some Fuel Left !!!Hello my Fellow TraderZ,
So what's up Buddies,,,today we have $LUNA on the table.
After bouncing to hug 3.5x #LUNA has fallen sharply as expected. The game of Pump-n-Dump is on #LUNA. And from time - to - time, we gonna see such amazing bounce to 100%-500%. So can choose this one as a GAMBLING bet.
Well now after sharp decline of ~70% following th recent pump, $LUNA is making a Falling Wedge on 1 HTF. Also Bullish Divergence is there . In shorter TF, I'm expecting a little 10-12% upside move to test 200 Hourly EMA.
Keep an eye on Breakout then place your entry.
Happy Trading Fam. CHEERS!!!

BTCUSD Stopping Volume at PCZ of Bullish SharkBTC has given me great reasons to be concerned that we would break through our PCZ and pull down into the 78.6% Retrace below but despite how many times it's tried it's managed to hold the local 88.6% Retrace as support and now we will have confirmed a stopping volume candle on the daily if BTC's Daily Volume doesn't change much in the next 15 minutes before the close so i will be doubling down here with a stop below the 78.6% retracement.

NZDJPY Short Term Sell Idea Delivered 200 Pips Move!!!In NZDJPY short term sell idea post, I mentioned that "Price is bouncing lower from a key resistance zone on the H4 chart, in addition to this we also had a bearish divergence and lower lows based on the MACD indicator. On the H1 chart, we had a bearish trend pattern so until the key resistance zone holds, my plan here is to sell pullbacks in the short term".
The price action followed my analysis and moved as per the plan here. The pullback that I was looking for happened and then the price moved lower further and has delivered 200+ pips move!
Note: Currently we have a bullish divergence in play, so if you are still involved in the sells then this is a good place to consider managing your trade and secure your profits (cash out or partial cash out or trailing protections or partial hedge, etc.. depending on the strategy that you work with).
Original Idea

Falling Wedge With Bullish Divergence and Bullish Deep GartleyWe have a promising looking Falling Wedge Visible on the Hourlies with a small Deep Gartley at the Bottom. My target here will be the .618 retrace and the SL will be below the previous major low to our left.
$META FACEBOOK - STRONG BULLISH DIVERGENCEThis is just an updated chart from my analysis last week.
$META is still on track.. LETS GO!

$BTC - O -$BTC Hello my Fellow TraderZ,
We are now coming into the most awaited week where we have FED Rate Hike announcement on SEPT 20/21. So as usual US Equity Markets is reacting to the probable Hawkish action of FED, followed by #CRYPTO as well.
Many of us are expecting the rate hike to be between 0.75bps and 1bps. If we see 0.75bps, it is good and more so like #BITCOIN is pricing in by testing the June lows. Incase we see 1bps, this is a disater then and most probably #BTC would stop at 14k.
But here what I see on DTF is that #BITCOIN is coming to support and probably in the making of DOUBLE BOTTOM pattern which is coupling with the BULLISH DIVERGENCE.
Still hoping for the best. Be cautious and Trade well my Fam. CHEERS!!!

PLSD DAILY is charting Bullish DivergencePLSD daily made a perfect pullback to the
6.18 Fibonacci while hitting the absolute
oversold position in the RSI. Classic Bullish
Divergence with the price action and RSI

Strong weekly hidden bullish divergence on #WEAT EFTHigher-low in price and lower-low in RSI. Big move incoming?

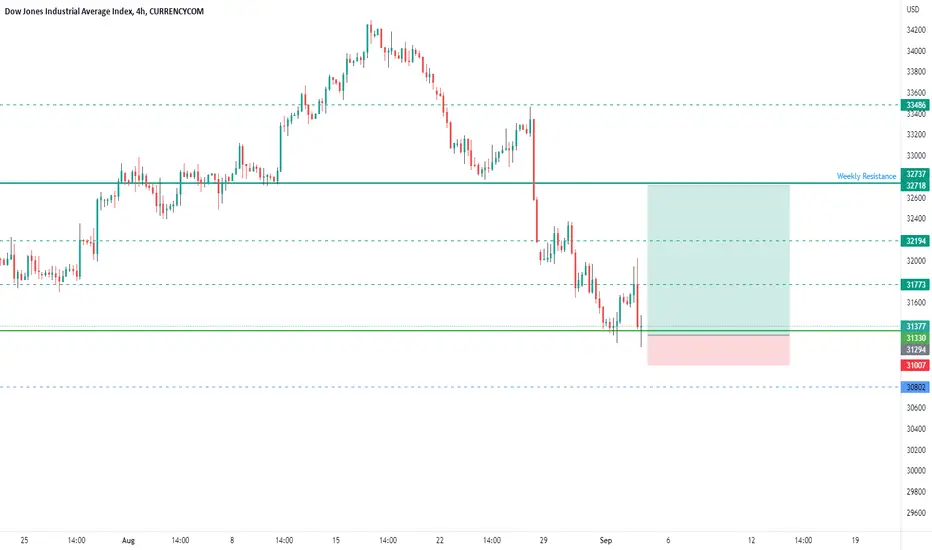
US30 DOUBLE BOTTOMPrice has formed a double bottom pattern with bullish divergence suggesting bullish movement.
The initial target for bullish retracement is the 32800 resistance zone.
USTC Hourly Bullish Bat witth Bullish DivergenceUSTC has formed a Bullish Bat on the Hourly Chart and may be looking to recover alot of the losses it's made this week. We may also see either LUNA2 or LUNC rally from where they are as a result of USTC Showing Strength if it does pivot here.
Zilliqa: MACD Bullish Divergence on the Weekly TimeframeWe have a huge amount of MACD Bullish Divergence on the Weekly here that might lead to a big Square-Up in price action and perhaps even a Weekly W structure.

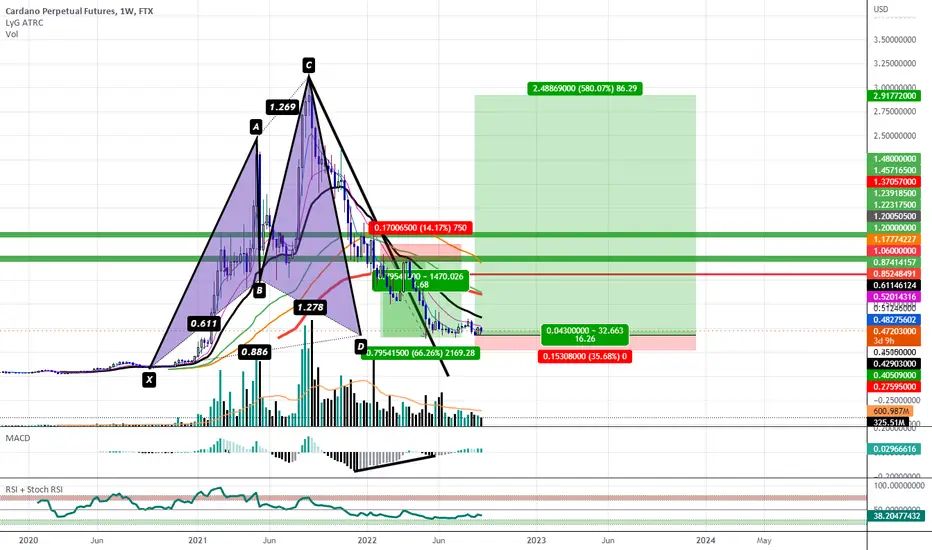
Cardano: Bullish Cypher at an 88.6% RetraceWe have Bullish Divergence on the Weekly MACD and a Bullish Engulfing of the Previous Week at the 88.6% Retracement. I would like to call this a Shark but we are missing the 1.618 Extension however due to some of the other Bullish Variables i think that i would instead see this as a Bullish Cypher that went a little too deep to the 88.6% rather than the 78.6% retracement as we sttill have the 1.272 Confluence here.
BTC DAILY BULLISH DIVERGENCE(S)Bitcoin has seen a dump recently.
After the dump, on the daily chart it has made a bullish divergence in the RSI.
Also since 17.9k low, BTC has made a MACD bullish divergence.
We have probably seen the worst of the bear market and BTC probably will not go too far below 17.9k.
Personally, I won't open a long position right now because this isn't enough reversal confirmation according to me.
We need to break above 19.5k first and 20.5k after that and confirm a new (short term atleast) uptrend.
BINANCE:BTCUSDT

Bitcoin Bullish Divergence Pretty standard - 3 touches of lower lows in price and higher lows in RSI taken from the bottoms.
Looking decent.

GBP/USD: bullish channel flagIn this analysis, I make an update of GBP/USD after that I was shortin from $1.1574 USD and I closed up my short position recently at $1.1528 USD, where I get 43 pips in profit or 4.33% of earned. Ok, what we look now it's a break-out of market structure in H1 timeframe. we was shorting and the minimum price was $1.1407 USD. Also, I believe that after we forming this bulish envolving pattern into this bullish channel flag, that was a good time to get profit and closed up automatically my short. But I know that I can't to still everyday in my chart 24/7, but I made a good job put my break even, but at least as I'm making an analysis of this par, I update this technical analysis.
Now, I found out that GBP/USD forming a bullish divergence in the RSI forming a lower high and price action lower low. That mean that trend will chhange, as now, we see a clearly break-out of this bullish channel flag.
Now I put my buy order limit at $1.1520 USD, Stop Loss to $1.1475 USD and take profit toward $1.1628 USD.
Also that I don't comment, in H4 it's appear that GBP/USD it's into this bearish channel and has a forecast that want to reach $1.1630 USD.
i'm longing GBP.USD. But not bad this short posiiton, and remember we can't to know what will happen with GBP/USD in the future. But we can to take the resource like fundamental analysis and technical analysis to take better decision in this market.
I hope that this idea support you!!!
Good luck!!!

EUR/USD: Movement by fundamental analysis!!!Fundamental Analysis:
***1) Germany, Europe's largest economy, is still on course for a recession even with a new government plan to spend 65 billion euros ($64.49 billion) on shielding energy customers and businesses from soaring inflation, economists say.
2) The latest package brings to 95 billion euros the amount allocated to inflation-busting since the Ukraine war began in February. By contrast, the government spent 300 billion euros on propping up the economy over the two years of the pandemic.
3) European gas prices surged, stocks slid and the euro sank on Monday after Russia halted gas flows via a major pipeline, sending another shock wave through economies in the region still struggling to recover from the pandemic.
4) European Union governments are pushing through multi-billion euro packages to prevent utilities buckling under a liquidity squeeze and to protect households from soaring energy bills.
5) Europe has accused Russia of weaponising energy supplies in retaliation for Western sanctions imposed on Moscow over its invasion of Ukraine. Russia blames those sanctions for causing the gas supply problems, which were down to a pipeline fault
6) European stock indexes fell on Monday, the euro dropped below 99 cents for the first time in twenty years and European gas prices surged after Russia said its main gas supply pipeline to Europe would stay shut.
7) European gas prices jumped as much as 30% as the market opened, and Germany announced on Sunday around $65 billion of support to help protect Germans from rising costs.
8) Finland and Sweden also announced plans to offer liquidity guarantees to power companies. Finland's economic affairs minister warned of the possibility of "kind of a Lehman Brothers" in the energy industry, referring to the 2008 collapse.
9) The euro zone is almost certainly entering a recession, with surveys on Monday showing a deepening cost of living crisis and a gloomy outlook that is keeping consumers wary of spending.
10) Germany's services sector contracted for a second month running in August as domestic demand came under pressure from soaring inflation and faltering confidence, a survey showed on Monday.
11) Euro zone business activity contracted for a second month in August as demand sank, with customers wary of the deepening cost of living crisis and gloomy economic outlook curtailing their purchases, a survey showed.
***12) The European Central Bank meets later this week, and is widely expected to raise interest rates given inflation is rapidly approaching double digits in the Eurozone and the policymakers have become worried about high prices becoming firmly entrenched.
13) The euro sank below $0.99 to a new 20-year low on Monday after Russia's halt to gas supplies down its main pipeline to Europe heightened fears about a deepening energy crisis across the region.
14) ECB officials will be keen to see the euro, which has lost around 8% of its value in the past three months, stabilise. That will feed into the desire to try to tame inflation through tightening policy.
----------------------------------------------------------------------------------------------------------------------------------------------------------------------------------------------------------------
So guys, what I found out it's that Germany Government make an investment of 65 billion (Euros) on shielding energy customers and businesses from soaring inflation and $95 billion (Euros) the amount allocated to inflation busting since the Ukraine began in February 2022. Another data show that Germany has spent over 300 billion (Euros) on propping up the economy over the past 2 years of the covid-19 pandemic.
Now, European Union are pushing through the Multi-Billion plan packages to rescue and prevent utilities buckling under a liquidity squeeze and to protect household from soaring energy bills.
At this point, we see a bullish side for Euro currency in this fundamental analysis what Germany (The largest economy in whole Europe) do and European Union to rescue the countries they to one shield energy customer and businesses from this inflation in the energy crisis.
But in other hand, we see a bearish fundamental that EUROPE has accused to Russia of weaponing energy supplies in retaliation for western sanction imputed on Moscow, over its invasion of Ukraince, Russia blames those sanctions for causing the gas supply problems in whole Europe.
***European Central Bank will make a meeting about interest rate decision in this week on this Thursday and expect to raise 1.00%.
---------------------------------------------------------------------------------------------------------------------------------------------------------------------------------------------------------------
Now, talking about technical analysis, I'm bullish in based the bullish side that appear very optimistic for Euro currency.
Now, we're in this bearish channel, and we formed a bullish divergence in the RSI and price action too. What we could to expect a possible long position from this side, what we can't to trade until we see a smart point to buy in $0.9920 USD or the break-out of this bearish channel, what it's better to be disciplined and patience until this trade develop, but has a bullish side.
So guys, at the moment, I don't see a trade yet until hope our best buy zone.
I hope that this perspective have your idea to long in Euro at favor by fundamental analysis.
So, we know that Europe it's in the recession, but today it's appear good bullish side that we could to see in the Europe largest economy that it's Germany and European Union. And also on Thursday the European Central Bank will make an interest rates decision and expect to raise 1% in this week.
So guys, in this week, there're a lot to read in United Kingdom that we have a new Prime Minister that I'm very interesting to analyze some Sterling Pound and know my perspective why I' see a dark future in it.
I will keep update this par!!!

EURUSD 4 Hour Bullish DivergenceWe have some 4 Hour Bullish Divergence here that could take us back to the upper portion of the range.

GBP/AUD: Review!!!In this forex par, was a pretty well trade to long position when I identify very well a bullish divergence in RSI forming a lower high and price action lower low. The RSI had indicating a change of trend in GBP/AUD what this trade was pretty well to trade in long position. I was like 100 pips in profit or 6.33% in earnings in this trade. But from this point at $1.6986 AUD I supposed to closed up this long when the price starting to down. But that was at early movement in the European Session. And so, also that I don't made it's when I was in profit, the only that I will need to fix it's put my break even to protect my earns, whether it's few earns. but I closed up this trade in this bearish pressure, but the loss was small like of -0.87% in loss. And also, I made a very good analysis and put my buy order in the smart point very good and in profit like 100 pips. So, I know that it's very natural that we can't to watching the chart 24.7, and I know that during the European Session. America it's in the early when everyone it's sleeping.
Also, I suggested that a when the EMA 200 make resistance veyr clearly in H1 timeframe, it's a good moment to closed up a trade like this and get profit in it. If I closed up this trade in the below of the EMA200, I would have 100 pips in profit in this trade. So, I believe that I mastering this trade very well. The only it's put a break even when I was in profit like over 70 pips. But I made this trade pretty well and the only advice for me and for everyone when this situation occur in the EMA 200 like resistance, or the contrary support, closed up a trade like this and get profit, But I know that a bullish divergence in RSI could to have passed in this trade.
This it's the H4 timeframe. That it's all my information that I bring in this trade to learn and work our analysis better.

GBPCAD Short Term Buy IdeaH4 - Price is bouncing higher from a key support zone.
Bullish divergence.
H1 - Bullish convergence.
Until the key support zone holds my short term view remains bullish here.
A valid breakout above the high at 1.52860 would be the validation for this bullish view.

Gold bullish divergenceWe have a bullish divergence for gold on the 15 minutes for a possible bullish reversal on the immediate short term.

NZDCHF - Looking To Buy Pullbacks In the Short TermH4 - Price is bouncing higher from a key support zone.
Bullish divergence.
Downtrend line breakout.
H1 - Bullish trend pattern.
Currently it looks like a pullback is happening.
Until the key support zone holds my short term view remains bullish here.
