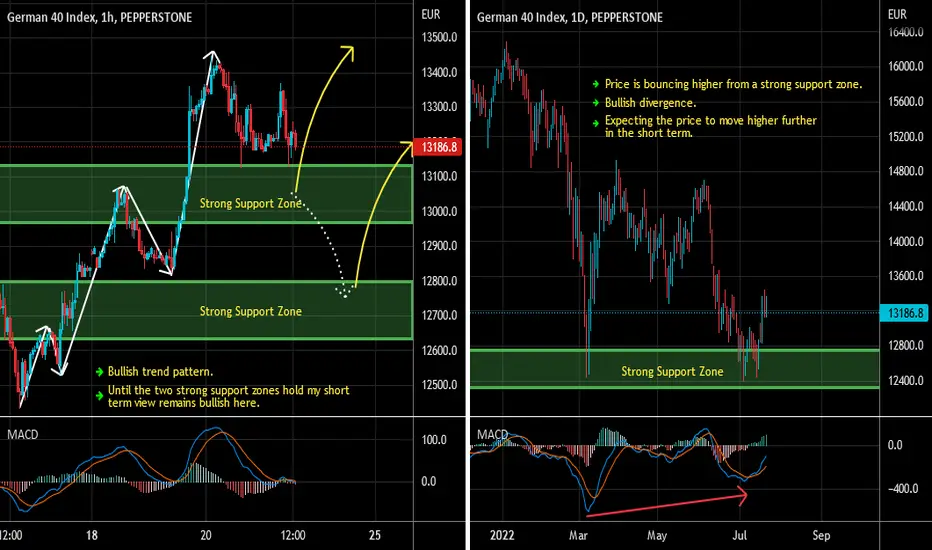
Dax Short Term Buy IdeaD1 - Price is bouncing higher from a strong support zone.
Bullish divergence.
Expecting the price to move higher further in the short term.
H1 - Bullish trend pattern.
Until the two strong support zones hold my short term view remains bullish here.
Bullish Divergence
GALA is Attempting to Break Hook and Go off of a Falling WedgeGALA hAs a Falling wedge visible on the Daily and is attempting a Bullish Break-Hook-and-Go confirmation off the pattern, ifit's successful in holding the level we could see it go 60%-150% from here.

AUDUSD Buy IdeaD1 - Price is bouncing higher from a key support zone.
Bullish divergence.
H4 - Bullish convergence.
Until the key support zone holds I expect the price to move higher further after pullbacks.

AAVE - Falling wedge is breaking out! + Complete Elliott Wave
AAVE is ready for a new bull market!
On the macro scale, we can see a falling wedge pattern that is currently breaking out.
As per my Elliott wave technical analysis, the ABC correction has been completed and because of that we can expect a new Impulse wave.
Good news is that the price has been supported by 0.786 FIB + yellow trendline.
We didn't make a new low on the macro scale, so there is a great chance for a new bull market!
If we take a look at the RSI indicator - we can spot a bullish divergence, always nice to see in the end of the downtrend.
Next target is ofcourse previous all time high from 2021.
I see a lot of altcoins probably bottomed out, so next weeks / months can be finally bullish.
Look at my ideas about interesting altcoins in the related section down below ↓
For more ideas please hit "Like" & "Follow"!

Is the 'drought' over?CRYPTOCAP:USDT.D
Looks like we're in for a bullish term on the crypto market!!
Since January 2022 the USDT.D (which serves as a very important factor in deciding the direction of the overall cryptocurrency market) has been on a continuous uptrend until May where it started forming a hidden RSI divergence on the daily timeframe as shown on the chart above. To confirm this a higher peak was formed at 9.49% on the the 18th of July along with a lower RSI trend compared to the previous peak at 7.27% on 12th May.
As of 13th July the daily candlestick closed bearish, engulfing the previous candlestick despite the U.S CPI data release which was very poor. I'm looking forward to a more bullish trend on the overall crypto market along with a steady increase in momentum in general.
- Joel
Please like and leave a review I'd like to know what you think about my idea 😃.

GBPCHF Short Term Buy IdeaH4 - Bullish divergence.
Higher highs.
Bullish hidden divergence.
H1 - Bullish trend pattern.
Currently it looks like a correction is happening.
Until the two strong support zones hold my view remains bullish here.

Long BCHBCH has moved in a descendant channel for more than 3 weeks. It broke now this channel and ready to go upward. The RSI broke also its trendline. In 1D TF, we can see a bullish divergence (see screenshot below) which reinforce the (short-term) reversal.

BTTC | Wave Projection | Ending Diagonal - Bullish DivergencePrice action and chart pattern trading
> Ending diagonal pattern with possible upcoming wave channel triangle breakout
> Possible upcoming Inverted Head & Shoulders
> Indicator: RSI / MACD bullish divergence indicating ending diagonal final wave 5 downtrend
> Entry @ triangle breakout
> Target @ Previous 1-wave + 75% upside
> Stoploss @ 3-wave Head position -25% downside
> RRR: 3:1
Always trade with affordable risk and respect your stoploss

Wait for the pull back Hi ĈŘŸPŤŌ traders
Bitcoin can toch 20250 at current volume
Again the main support is waiting for bitcoin at 19500/600
Wait for the super entry below 20000

EUR/JPY: bullish divergence and break outEuro/Yen Japanese break out this structure and want to continue climb that we could to get a good trade in this par. And also we forming a bullish divergence in the RSI and price action too.
We're in this way forming a bullish divergence
In Daily timeframe it's look bullish from this key support zone above 138.50 JPY.
I put a buy order limit to $138.76 JPY, Stop Loss to $137.98 JPY and target to $140.00 JPY. This it's look a potential trade to find up 138 pips.
This it's a quickly analysis today. I hope that this idea support you
Good luck!!!

CoinBase - Elliott Wave Finally completed! + Bullish divergence- CoinBase is one of the most popular crypto exchange in the world and that's why it's good to track the price of the stock.
- As per my Elliott wave technical analysis - we have completed the impulse wave successfully and now I am expecting at least a retracement to 0.618 FIB / Red horizontal resistance.
- If we take a look at the RSI indicator, we can see a bullish divergence, which is ofcourse always great to see.
- We have a local falling wedge, bullish reversal pattern at the end of the trend and the price is currently breaking out!
- Look at my ideas about interesting altcoins in the related section down below ↓
- For more ideas please hit "Like" & "Follow"!

BTC Long Term And Short Term AnalysisBTC LONG TERM - The bullish divergence looks like it's playing out on the 1D and close above the 21 EMA yesterday which means it could go and test the 55 ema at 25000, so I don't think this bounce is over just yet.
BTC SHORT TERM - On the 1H it looks like it wants to put in a temporary top and pull back a little bit. There is a tiny bit of bearish divergence too, so that could lead to a little pull back on the shorter time frames.
BTC OVERALL - I can see BTC having a pull back today and carry on it's bounce later on today or going into the weekend.
Let me know your thoughts in the comments and like my idea!!

ETHUSDTCriteria:
1. Trendline restest after Breakout
2. Fibonacci retracement 50%
3. Supply Zone
4. Rising Wedge Target
5. Fibonacci retracement 78.6%
6. Bullish Divergence on RSI
Tp1: 1128
TP2: 1168
TP3: 1250

Perpetual PERPUSDT - Record volume! + Elliott wave + Wedge!- If we take a look at the volume indicator, we can clearly see a massive bullish volume spike, which is definitely a good sign!
- On the weekly scale, we can see a falling wedge that is currently breaking out!
- As per my Elliott wave technical analysis - the huge impulse wave (12345) should be completed, as you can see.
- On the RSI indicator, there is a bullish divergence - wonderful sign of a trend reversal.
- Profit target: 0.618 FIB + start of the wave 5 for 700% profit.
- Look at my ideas about another interesting altcoins in the related section down below ↓
- For more ideas please hit "Like" & "Follow"!

INTU - near term upsideINTU hit the low on 13 May and has not gone any lower since. It has been chopping sideways for almost 2 months and appears to be forming an ascending triangle (odds of breaking up is greater).
On the monthly chart, we are seeing a possible 3rd inside bar this month and also a bullish divergence with the RSI.
A breakup of the ascending triangle at 425 could be early signs of optimism. However, an bounce right now may still be on a short term swing basis only until we see more signs of a sustainable reversal.
Disclaimer: Just my 2 cents and not a trade advice. Kindly do your own due diligence and trade according to your own risk tolerance and don't forget that money management is important! Take care and Good Luck!

Bitcoin BTCUSD - Complete Elliott Wave + Falling wedge! (weekly)- I do not see any reason why bitcoin should not respect the previous all time high support from 2017 (around 20 000 USD).
- The price is currently above 20 000 USD and we have had a capitulation wick to 17 600 USD to kick out high leverage traders.
- Bitcoin on the weekly chart is currently sitting on the main support: Previous 2017 Swing high + 0.786 FIB + ABC correction completed!
- The price is forming a falling wedge pattern, which is definitely a good sign that can lead to a new bullish trend.
- As per my Elliott Wave analysis - ABC correction should be completed successfully and we can start a new impulse wave.
- If we check the MACD indicator, we can spot a bullish divergence and the first bullish tick on the histogram!
- If this Elliott Wave analysis is wrong, then anyways we should go back to 28 000 USD to retest the 0.618 FIB level + trendline of the wedge.
- Look at my ideas about TOTAL crypto cap and BTC.D in the related section down below ↓
- For more ideas please hit "Like" & "Follow"!

NZDJPY Short Term Buy IdeaH4 - Currently it looks like the price is moving inside a range.
Price respected a key support zone and is bouncing higher.
Bullish divergence.
H1 - Bullish convergence.
Currently it looks like a pullback is happening.
Until the key support zone holds I expect the price to move higher further in the short term after pullbacks.

PolkaDot DOTUSDT - ABC completed! Elliott Wave + Channel- On the weekly/3D chart we can see a parallel channel and the price is currently on the support of the channel.
- Due to my Elliott Wave analysis - the ABC correction has been completed successfully and now we are prepared for another bullish market!
- 0.618 FIB is the strongest FIB level and the price si currently sitting on this level.
- If we take a look at the RSI indicator, we can spot a nice bullish divergence with a lower high!
- Wave 1 horizontal support (previous swing high) from 2020 is another great support that we have.
- Look at my ideas about another interesting altcoins in the related section down below ↓
- For more content, please hit "Like" & "Follow"!

BTC Long Term And Short Term AnalysisBTC LONG TERM - On the 1D the green spot has confirmed from yesterday with bullish divergence at the same time but the stochastic Is still crossing down on the 1D. On the 4H It has come down to the 55 Ema it would be nice to see it bounce off that, If It does then I can see a bit more upside towards 21700.
BTC SHORT TERM - My short term target from yesterday was hit (20400) It's been rejected off that resistance and a red spot and the stochastic crossing down too. Like I said with with 4H as long as It stays above the 55 Ema i can see a bit more upside. Shorter target 21000.
BTC OVERALL - I think BTC will carry on this move upwards of at least 21000 if it stays above 19700.
Let me know your thoughts in the comments and like my idea!!

BTC Long Term And Short Term AnalysisBTC LONG TERM - On the 1D it could get a 3rd strike of bullish divergence on the Crypto trend indicator which could maybe give it a little bounce upwards to 22900 then maybe come down further once the divergence has played out.
BTC SHORT TERM - On the 1H it looks like it wants to bounce a bit more, it has broke the 21 and 55 EMA with the stochastic crossing up and a green spot on the crypto trend.
Short term it could test upwards to 20400.
BTC OVERALL - I think BTC will continue this bounce up to at least 20400 with it looking bullish short term.
Let me know your thoughts in the comments and like my idea!!

TOTAL2 - Daily Bullish DivergencePrice prints lower lows
While indicator prints a higher low
This is a Classic Bullish Divergence
Daily timeframe
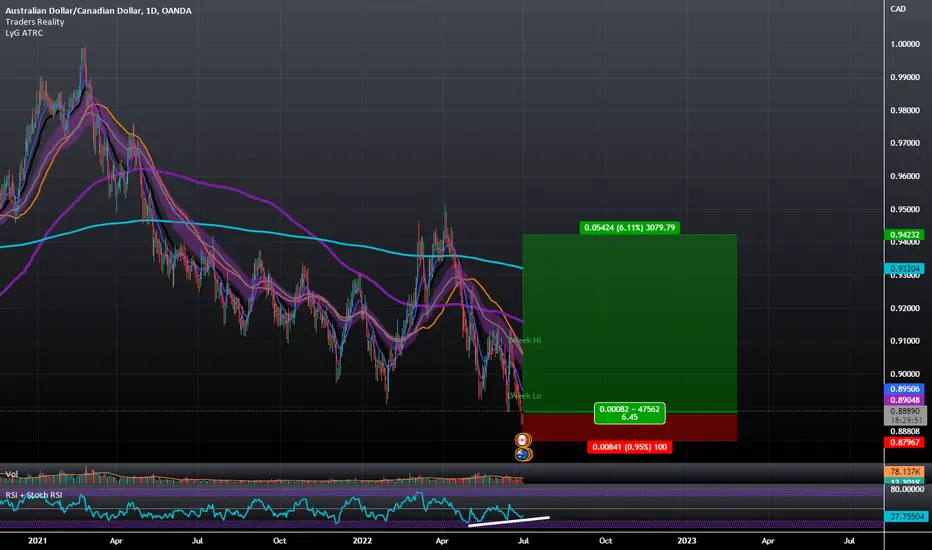
AUDCAD Daily Bullish Divergence within RangeDaily Triple Bullish Divergence on the RSI seems to be hinting towards a future scenario where the AUD will see a Bullish Rally against the CAD to the top portion of the range it's formed down here.
Nas100 4h Hidden Bullish DivergenceIf you thought the trading was terrible wait till you see this chart.
God damn, everything has to either a. not trade at all or b. monitored
every 3 seconds. The 4hr divergences trumps the 1hr. And weekly the daily etc.
Sorry about this whipsaw but it's the nature of the beast.
