Avalanche Sits at the 0.886 Retrace Awaiting Potential BidsWe are at the 88.6% Fibonacci Retracement and showing Moderate amounts of Bullish Divergence on the RSI if we can catch a Standard Correction of the Downtrend we could see it pump back up to the 200 Day Moving Average which is Currently near the next possible resistance zone above if we were to rally from here.
Bullish Divergence

How to Trade Bullish DivergenceAt some point in your trading career, you will hear the term "Divergence Trading". Divergence simply means when the price and indicator are telling the trader two different things. It can be an effective addition to your trading strategy, especially if already using indicators like RSI or MACD to find overbought and oversold levels but should not be replied on by itself and requires practice to get it right.
There are two types of Divergence you want to be familiar with: Regular bullish and bearish divergence and Hidden bullish and bearish divergence. In this educational tutorial, I will cover Bullish Divergence. You should note that the appearance of divergence doesn't happen 100% of the time, but when it does, you can use it for additional confluence (extra confirmation) for entering trades.
Bullish Divergence Overview:
A bullish divergence occurs when prices fall to a new low while an oscillator fails to reach a new low. This situation demonstrates that bears are losing power, and that bulls are ready to control the market again—often a bullish divergence marks the end of a downtrend. Notice in this example of GBPCAD, the price was in a downtrend and eventually came to a low at 5494 and rejected the area. The price shows a decline, while the RSI shows the oscillator moving higher. This is an example of regular bullish divergence, as it signaled a potential trend reversal.
How to Draw Bullish Divergence
You want to draw lines on successive tops and bottoms. Connect the tops and bottoms only, and keep your eyes on the price. If you draw a line connecting two lows on price, you MUST draw a line connecting two lows on the indicator. They have to match! Divergence only exists if the SLOPE of the line connecting the indicator tops/bottoms DIFFERS from the SLOPE of the line connecting the price tops/bottoms.
Popular Indicators to Use When Identifying Divergence
You can use indicators such as RSI, MACD, CCI, or Stochastic to trade divergence. Your selection in one of these indicators will depend on personal preference. I personally prefer the RSI at a 7 period.
If you spot divergence but the price has already reversed and moved in one direction for some time, the divergence should be considered played out.
You missed the boat this time. All you can do now is wait for another swing high/low to form and start your divergence search over.
What is your favorite way to trade Divergence? Let me know in the comments!
Happy Trading! :) - Brian & Kenya, BK FOREX ACADEMY

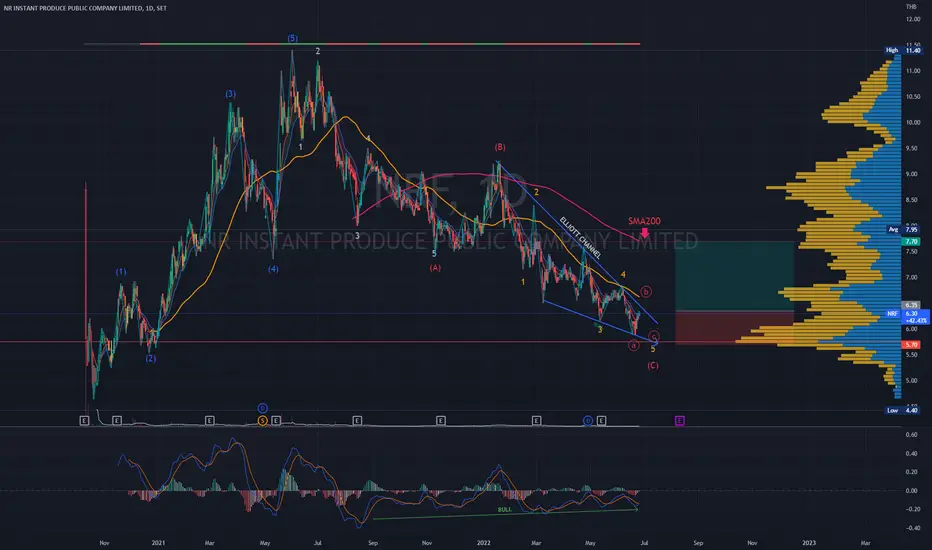
NRF| Wave Projection | Ending Diagonal | Target DowntrendPrice action and chart pattern trading setup
> Downtrend target in range with an ending diagonal pattern of wave C correction
> Entry @ Elliott Wave channel breakout
> Target @ SMA200 for medium term trade
> Stoploss @ Target Wave 5 with downside -10%
> RRR: 2:1
Indicator:
> MACD bullish divergence continuously
Always trade with affordable risk and respect your stoploss
HTZ Long Idea WC 27th JuneHertz has been moving sideways really since February. Holding up well in overall bearish conditions. Now showing bullish divergence indicating that momentum could be about to turn. There is horizontal support around the $15 mark, making this a lovely risk to reward play. There is resistance around the $20 and $24 mark but this has plenty of range for a longer term play. Keep it on your watchlist for the break above $20.

We Have a Double Bottom at the PCZ of a Bullish Butterfly on BATPretty much everything you need to know is in the title but if i were to elaborate on some details i'd add the fact that there is Bullish Divergence on both the Daily MACD and RSI.

GBPCAD Short Term Buy IdeaD1 - Price respected the psychological level 1.55 and bounced higher.
Bullish divergence.
Expecting short term bullish moves to happen here.
H4 - Bullish convergence.
Currently it looks like a pullback is happening.
Until both the strong support zones hold my short term view remains bullish here.


WAVES bullish divergenceWAVES has been one of the most performative cryptos in Mars 2022 with more than 600% raise.
A (medium) bullish divergence on 1D Time Frame can be seen in its chart. How high would it go this time?
As usual, I put some targets and the nearest support as references.

JASMY is going to moveOn 4H time-frame, JASMY formed a triple bottom. It has broken the neckline (also the trendline). Successful retest is going to be confirmed (let's wait for the current 4H candle's close).
On the higher time frame 1D, we can see a medium bullish divergence which reinforces the upside move (see below).

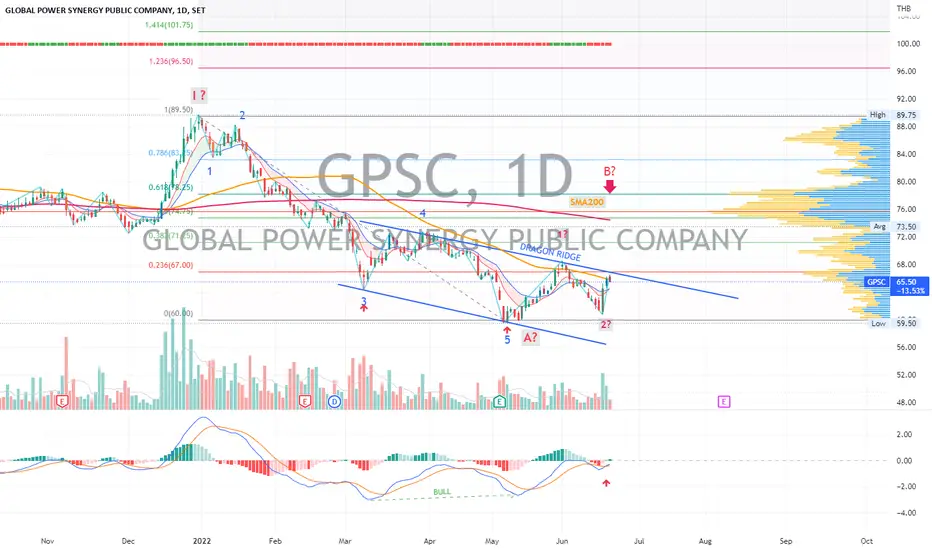
GPSC | Wave Projection | Bullish Dragon Flag SetupPrice action and chart pattern trading setup
> Bullish Dragon pattern in correction wave A, possible reversal for uptrend wave B
> Entry @breakout channel dragon ridge
> Target @ 0.618 retracement of previous top SMA200 zone
> Stoploss at the low A position - RRR: 2:1 downside -7%
Indicator:
> MACD bullish divergence signal crossing up baseline 0.
NZDCAD - Looking To Buy Pullbacks In The Short TermH4 - Bullish convergence.
Currently it looks like a pullback is happening.
Until the key support zone holds I expect the price to move higher further after pullbacks.

Bitcoin coud be ready to start pumping hardAs you can see in the chart Bitcoin looks very bearish, it has reached the previous bull market high witch is a strong support, but it broke this one and closed a daily candle under it.
It has made lower lows but if you look at the Moving Average Convergence Divergence indicator it hasn't reached new pronounced lows while bitcoin has.
It has formed a clear triple bullish divergence that is a super strong buy signal and an early sign of trend reversal.
In the other side we have a broken support witch is a strong sell signal and i think that it would be difficult for the price to close over 21k in short term.
In my opinion is more likely for it to form an accumulation channel between 17500$ and 21000$ and then it will come the strong move.
What side? I don't know, In my opinion the mos wise full action is to wait for confirmation and take action.
If it closes a daily over 22500$ within this week the reversal could be confirmed but if it fails the failed Moving Average Convergence Divergence triple bullish divergence will turn in a very strong sell signal, and the price will go lower.
I will be glad to see what do you think in the comments, if you agree with me give me a like, it helps a lot.

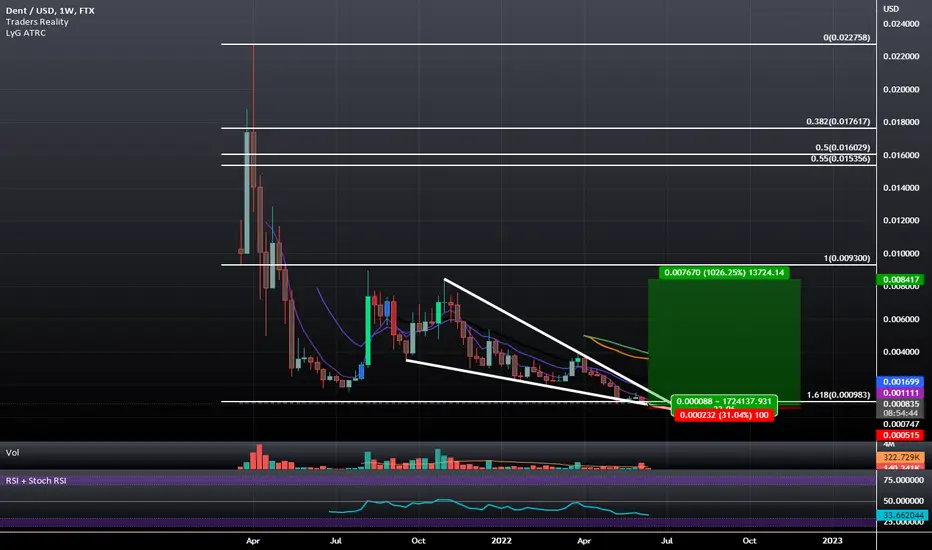
Falling Wedge Double BottomThere is a Falling Wedge Visible on the Daily and Weekly and on the Daily Timeframe we have a Double Bottom With Bullish Divergence present at the Demand Line of this Wedge as seen here:
I will mainly target around 0.9 cents which is the top of the range we have formed on the weekly but overall this has potential to go beyond the main target and hit 1.7 cents if it breaks the range.
Nasdaq Positive Divergence 1hrPerhaps it is too early to get in to this trade, but it looks like there is
a small bit of positive divergence on the Nasdaq 100 on the 1hr time frame.
This suggests that the markets want to reverse. The safer idea would be to
let it take off and buy upon hidden bullish divergence at some point later on in the
week or next week.

BBGI | Wave Projection Dragon Pattern - Bullish divergencePrice action and chart pattern trading setup
> An impulse downtrend Elliott Wave channel with a dragon pattern forming rear legs
> possible upcoming bullish divergence signal at the next support 8.00 baht targeting 2.618 extension
> Entry @ dragon ridge breakout
> Short term target @ previous wave 4 position
> Medium term target @ wave 1 and wave 2 position + 15 - 20% upside
> RRR: 2:1 for short term and 3:1 for medium term trade
Always trade with affordable risk and respect your stoploss

XLMUSD: Double BottomXLM could see a 50% rally up to a previous support level where it might then test it as new resistance if the rally proves weak. One may want to wait until after the FOMC before putting full size on this trade just incase there is any negative volatility during the meeting.

AUDCAD Short Term Buy IdeaD1 - Price is bouncing higher from a key support zone.
Bullish divergence.
Engulfing candle pattern.
H1 - Bullish convergence.
No opposite signs.
Until the key support zone holds I expect short term bullish moves to happen here.

Class A Bullish Divergence COULD be forming on BTC DailyIf BTC continues to dump without a signifiant rally, this will not play out.
But if we see a recovery at this point, there is class A bullish divergence forming in the MACD. This isn't reason to believe that the bottom is in and we are heading to new all time highs, but it could be a sign of a significant reversal in the short term. Most likely, I expect that it would meet resistance in the $28.8k region where the previous accumulation structure had support. It would probably see this as resistance, bounce off and dump again, possibly breaking through that holy barrier of the last cycle's ATH. If we were to get back above that level and back into the range of the old accumulation structure then we can start having a new discussion after oscillators get reset. It is hard to be bullish given the macro economic landscape at this time.

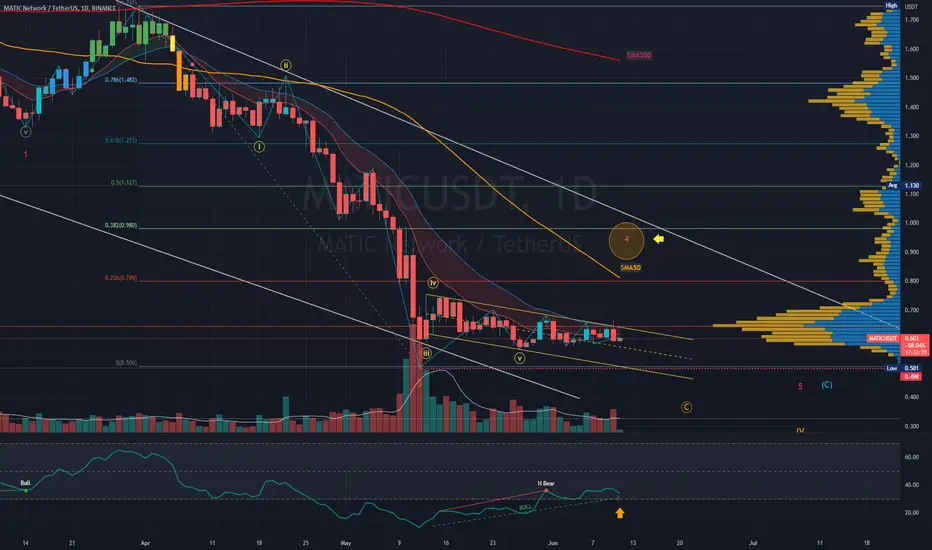
MATICUSDT | Wave Projection| Bullish Divergence for rebound?Price action and chart pattern trading setup
> Major formation: Ending diagonal with bullish flag reversal pattern, expecting a rebound for minor WAVE 4
> Targeting 0.382 retracement of previous WAVE 3
> Entry @ bullish flag breakout
> Stoploss @ flag support position
> RRR 3:1
Indicator:
RSI bullish divergence
Always trade with affordable risk and respect your stoploss
GBPCHF - Looking To Buy PullbacksH4 - Price is bouncing higher from the psychological level 1.20.
Bullish convergence.
H1 - Bullish trend pattern.
Until the two strong support zones hold my view remains bullish here.

EURCAD Short Term Buy IdeaH4 - Price respected a key support zone and is currently bouncing higher.
Bullish divergence.
H1 - Bullish divergence.
Until the key support zone holds my short term view remains bullish here.
If we get a valid breakout above the high at 1.34760 we may then consider it as a validation for this short term bullish view.

Ethereum_Usdt(Falling Wedge Formation)What the Falling Wedge Tells Us ?
The falling wedge pattern is a technical formation that signals the end of the consolidation phase that facilitated a pull back lower. As outlined earlier, falling wedges can be both a reversal and continuation pattern. In essence, both continuation and reversal scenarios are inherently bullish.
As such, the falling wedge can be explained as the “calm before the storm”. The consolidation phase is used by the buyers to regroup and attract new buying interest, which will be used to defeat the bears and push the price action further higher.
Hence, a falling wedge is an important technical formation that signals that the correction, or consolidation, has just ended as the asset’s price left the wedge to the upside and, in most cases, the continuation of the overall trend is taking place.

Bullish Divergence on RSI DailyDaily bullish divergence on the rsi, as well as a double bottom, suggests price movement goes up in the near future for cronos.
