Ethereum_Usdt(Falling Wedge Formation)What the Falling Wedge Tells Us ?
The falling wedge pattern is a technical formation that signals the end of the consolidation phase that facilitated a pull back lower. As outlined earlier, falling wedges can be both a reversal and continuation pattern. In essence, both continuation and reversal scenarios are inherently bullish.
As such, the falling wedge can be explained as the “calm before the storm”. The consolidation phase is used by the buyers to regroup and attract new buying interest, which will be used to defeat the bears and push the price action further higher.
Hence, a falling wedge is an important technical formation that signals that the correction, or consolidation, has just ended as the asset’s price left the wedge to the upside and, in most cases, the continuation of the overall trend is taking place.
Bullish Divergence

Bullish Divergence on RSI DailyDaily bullish divergence on the rsi, as well as a double bottom, suggests price movement goes up in the near future for cronos.

Bullish divergence on GBP/CAD: Has the pound bottomed out?In recent sessions, a technical bullish divergence has emerged on the GBPCAD pair, with prices reaching fresh lows at 1.575 while the momentum oscillator (14-day RSI) gaining pace, indicating that bears may have lost a bit of steam.
As of this writing, the GBPCAD exchange rate is down around 8% year-to-date and 9.5% from its February highs.
Since February 22, GBPCAD has been trading in a descending channel pattern, aided by the surge in OIL_CRUDE prices following Russia's invasion of Ukraine, which has served as a tailwind for the oil-linked Canadian dollar.
From a macro perspective, inflation in both countries hasn't peaked yet. The annual inflation rate in the United Kingdom ECONOMICS:GBIRYY jumped from 7% in March to 9% in April, the highest level since 1982.
Annual inflation in Canada ECONOMICS:CAIRYY accelerated from 6.7% in March to 6.8% in April 2022, the highest since January 1991.
The Bank of England hiked its Bank rate ECONOMICS:GBINTR to 1% in May, the fourth straight rise, but also signalled that the UK economy is expected to weaken in the second half of the year due to a decline in real household income.
The Bank of Canada raised interest rates ECONOMICS:CAINTR by 50 basis points to 1.5% last week, the third straight increase, signalling that it will raise rates further at its upcoming meeting to combat growing inflation, while the labour market continues to show signs of resilience.
However, the market is currently expecting a more aggressive monetary policy in Canada than in the UK, as seen by the yield differential between a 2-year UK gilt ( GB02Y ) and a Canada's Government Bond of the same maturity ( CA02Y ), which fell from near-break-even levels in March to -1.2% at the start of June, mirroring the GBP/CAD's trend.
The next Bank of England meeting is scheduled on June 16, with the market expecting another 50 basis point raise. Hawkish headlines might support the pound in the coming days. Meanwhile, the British pound awaits the outcome of Prime Minister Boris Johnson's vote of confidence, which will take place tonight at 6 p.m. in London, despite the fact that the rise in political instability has had little influence on the pound today.

XRPUSDT | Wave Analysis - Bullish Divergence | Possible reboundPrice action and chart pattern trading setup
> Wave projection - An ending diagonal pattern with a possible technical rebound wave iv correction
> Entry@ breakout downtrend channel
> Target wave iv uptrend @ 0.386 retracement of wave iii - SMA50 zone
> Stoploss at the lower resistance of downtrend channel - downside -10-15%
> RRR: 1.5:1
Indicator:
> RSI bullish divergence
> MACD crossover signal line below center
Always trade with affordable risk and respect your stoploss

Bullish Bat Double BottomThe only thing holding Ape back from a 10-20% move to the upside from here are the moving averages i would buy here and put my stop below last week's low.

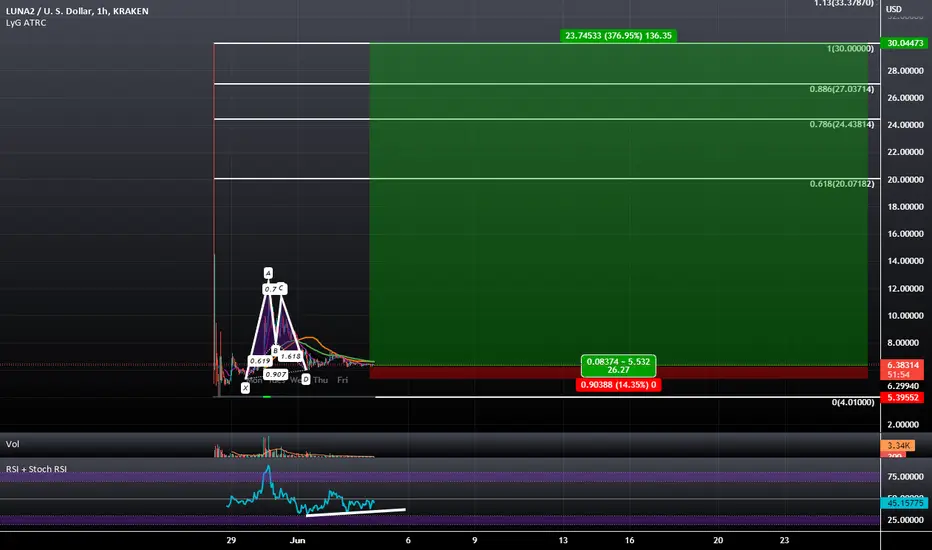
Double Bottom With Bullish Divergence at PCZ of GartleyThis is pretty much the same setup at the old LUNA/BTC chart that i had but since the exchanges deleted that pair and launched LUNA2 while the old LUNA pair became LUNC i decided to repost this Gartley for the new LUNA2
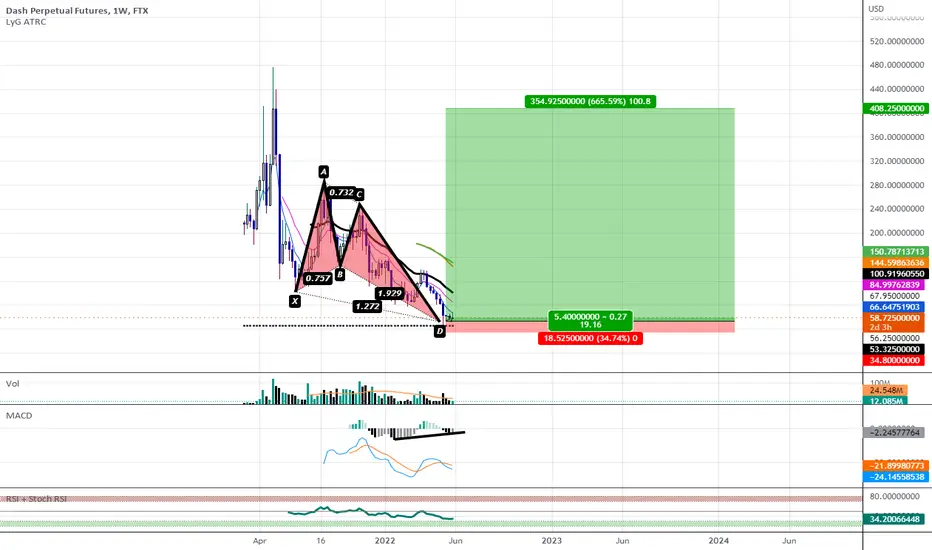
Bullish Butterfly with Bullish Divergence on WeeklyWe Have Weekly MACD Bullish Divergence Visible at the PCZ of a Bullish Butterfly on DASH
C98USDT Ready to break out? Bullish OBV and CVD DivergencesBYBIT:C98USDT
Coin98 is currently bouncing off the range POC. If we get bullish price action here and hold this level, we could see a breakout happening.
Bullish OBV and CVD Divergences are forming on the 30m and 1hr chart.
We also have a massive Falling Wedge pattern. If we break out of the upper trendline, we could see big moves ahead, especially if Bitcoin breaks out and starts heading towards $35000.
TP areas in the video as per levels marked on the chart.
SL according to your risk tolerance.
Not Financial Advice. DYOR. Papertrade before using real money.
If this analysis helped you, please give it a thumbs up and follow.
Trade Safely,
Shawn

USDJPY Short Term Buy IdeaH4 - Bullish convergence.
Expecting short term bullish moves to happen here.
H1 - Bullish trend pattern.
Until the two strong support zones hold my short term view remains bullish here.

Tesla Short Term Buy IdeaH4 - Price is bouncing higher from a key support zone.
Bullish divergence.
Expecting short term corrections to happen here.
H1 - Bullish convergence.
Until the key support zone holds my short term view remains bullish here.

1 Hour RSI Bullish Divergence Could Take us to the 200 Hour SMAWe have Bullish Divergence on the 1 Hour RSI bwith a Shortening of the Thrust of Downward Price Action, it looks like this could be the start of a potential reversal atleast to test the 200 SMA

NASDAQ BOUNCES ON SUPPORTLast week Nasdaq tested the support and bounced bullishly attempting to recover. The price dropped back to the support but could not close below it.
The price rejections on the support, rsi bullish divergence, and double bottom indicate a bullish move in the coming week.
Initial targets are 12600 and 13150.

AMZN bullish divergence with RSI confirmationAMZN on 4H formed a clear bullish divergence with lower lows being formed in price action and higher highs in the MACD. This can also be considered a double bottom. (possible reversal)
I was late to jump but entered at 2182.70 and holding especially as RSI crosses the 50 mark and suggests a bullish trend.
AMZN has been bearish and for awhile, so will be careful to look out for weakening of this small trend.
Planning to hold till either MACD crosses over and/or RSI becomes overbought.

PEOPLEUSDT possible bounce in the golden pocket BYBIT:PEOPLEUSDT
Following up from my previous technical analysis on PEOPLEUSDT ,
We possibly have a bounce happening in the Fib Golden pocket and we have bullish divergence on awesome oscillator and Cipher B
PEOPLE has been volatile over the last few days, so think about your entries and TP's.
Possible TP areas - Top of the channel forming, daily levels above on my chart or the POC. Feel free to chart the same levels on your chart.
See the video for details.
if this idea helped you, please give a thumbs up and feel free to follow for more ideas and trade setups
Not Financial advise. DYOR. Papertrade before using real money

Descending Broadening Wedge Partial Decline at an .886 RetraceWe have a Descending Broadening Wedge with a Partial Decline on Zcash at an .886 Fibonacci Retracement with some RSI Bullish Divergence on the Daily.

USDCHF Short Term Buy And Mid Term Sell IdeaH4 - Bearish convergence.
Bullish divergence
Basically I expect pullbacks and then potential continuation lower.
H1 - Bearish trend pattern.
Price has reached a key support zone.
Bullish divergence.
My short term view is bullish and my mid term view is bearish here.

Bullish Divergence & EQ Up Close #BitcoinZoomed in on the Hourly timeframe we can see the EQ playing out a bit more. This EQ however is placed in a position which also indicates that it is a Bearflag.
Aside from the potentially bearish pattern forming, there is also a Bullish Divergence on the RSI below, as indicated by the arrows.

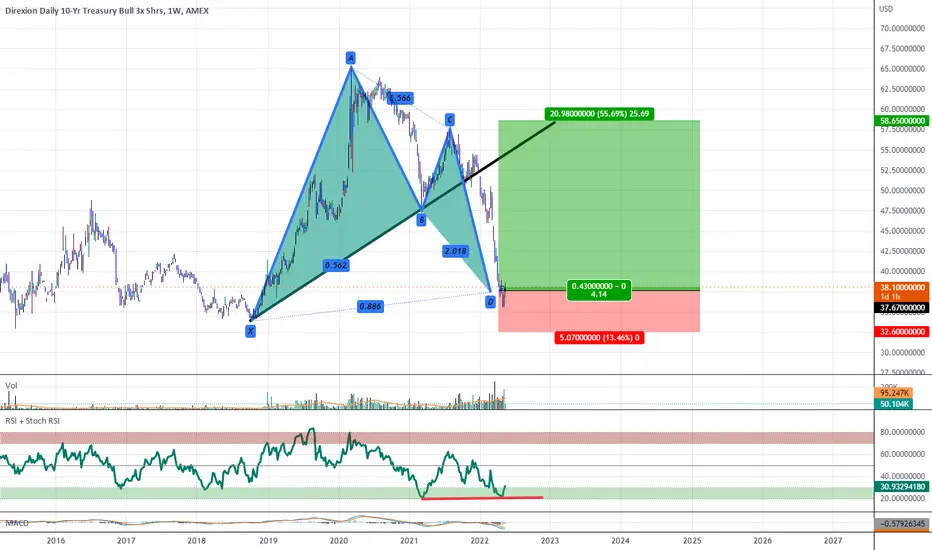
US10 YR Treasury ETF: Bullish Divergence at PCZ of Bullish BatThere is RSI Bullish Divergence at the PCZ of a Bullish Bat that's Visible on the Weekly Timeframe. This may also signal the beginning of a moderate pullback within the DXY as initially, I expect the DXY to show a Negative Correlation with Rising US BOND prices.
4HR Double Bottom with Bullish Divergence on a "Stable Coin" We have a Bullish setup here on this failure of a stable coin and while things look fundementally bad for it i still cant ignore the technicals. I come at this chart with the mindset of all the money i put in is basically like throwing cash in a pit of fire but it's a risk i'm willing to take on the off chance that this Double Bottom plays out. My stoploss is non existant here as there is no support; absent of this Double Bottom playing out and pivoting the UST back to near it's target it can only go to 0 and die from here.

NZDCHF Buy IdeaD1 - Price is bouncing higher from a strong support zone.
Bullish hidden divergence followed by continuing divergence.
Expecting the price to move higher further.
H1 - Bullish trend pattern.
Higher highs.
Until the two strong support zones hold my view remains bullish here.

ACMUSDT | Falling Parallel Channel - Bullish DivergencePrice action and chart pattern trading
> Falling parallel channel correction - Entry @ Pullback
> Target upper parallel channel resistance / SMA50
> 2nd target at key volume profile resistance level
> Stoploss at the lowest LLS bullish candlestick
> RRR: 3:1
Indicator:
> Smart money strong volume support
> Banker chip multiple entries
> Fundflow RSI bullish divergence signal coming out of the oversold zone
> KDJ stochastic bullish divergence
> BBD signal bullish approaching baseline indicating stong uptrend swing
Always trade with affordable risk and respect your stoploss

Bullish divergence + local low ichimoku scorePotential rebound coming in to the end of the week/early next week. Price may test the box another time, as it has shown to be resistance.

Weekly Double Bottom with MACD and RSI Bullish DivergenceWe have a Clear Double Bottom Visible on the Weekly and Lots of Bullish Divergence and Little Resistance above
