Bullish Shark Could Take Algorand Up 400%We have a bit of Bullish Divergence on the RSI and MACD at the PCZ of this shark best case scenario is it comes up to make a Higher High at the 1.618 Extension
Bullish Divergence

Double Bottom Visible on the Monthly We have some Bullish Divergence here at the entry of a potential Double Bottom.

Bullish Shark 1.13 Entry on CRVUSDWe have a bit of Bullish Divergence at the 1.13 Extension of a Bullish Shark and I Will be targeting the 50-61.8% retrace from here.


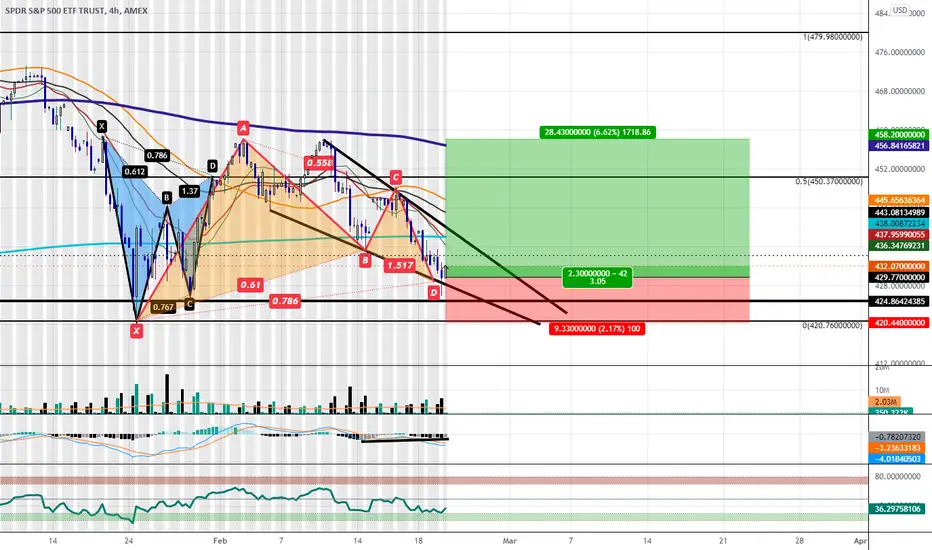
The $SPY is Potentially Setting up for Another Short-term BounceToday on the 4HR Timeframe we went down Below the Demand Line of a Falling Wedge Channel but ultimately closed back within the Channel then Bullishly Engulfed at the PCZ of a Bullish Gartley on the close of the next candle. We also showed slight hints of Bullish Divergence on the MACD whilst this was going on. This looks to be pretty good for any Market Bulls out there in the short to midterm but i we aren't completely out of the woods yet as the Macro is still Bearish. I will be looking for a Midterm bounce in the SPY but wont be targeting much higher than $450 before looking to see more continuation to the downside.
Piercing Line with Bullish Divergence at PCZ of Bullish BatI think that we may see it make one final push towards 44k before ultimately reversing bearishly and continuing the downtrend.

Bulls taking charge looking at USTECH, looks like we are about to go long on this one.
The support has been tested, bullish divergence in play.

EURGBP - Looking To Buy PullbacksD1 - Bullish divergence
Higher highs.
Price has respected a strong support zone and is bouncing higher.
H1 - Bullish convergence.
Currently it looks like a pullback is happening.
Until the strong support zone holds I expect the price to move higher further in the short term.

ICPUSD Bullish Shark with lots of RSI Bullish DivergenceWe have what seems to be a Lower Low Double Bottom at the PCZ of a Bullish Shark Pattern with a bunch of RSI Bullish Divergence that if it plays out will take us up to around a minimum of $50

Falling Wedge in Polkadot combined with a Bullish Divergence!Hey Traders,
As you can see on the 4HR of Polkadot (DOT.) The price action has formed Lower Lows and Lower Highs symptoms of a falling wedge! The price target out of this pattern would be at $23 (+22%). In the rare case it does break down, the target for that is $14 (-18%). There is a 70% chance Falling Wedges breakout to the upside and a 30% chance they fall to the downside. However, I think there is a VERY good chance we breakout mainly due to the Momentum Oscillator (RSI) showing a Bullish Divergence with Higher Lows while the Price is in a Decline.
Safe trading,
-Pulkanator

20-30% Chance in Splunk | Bullish Divergence on the Weekly | A weekly close above this level could mean some upside. Maybe a Gap-Close or bouncing around in this Wedge.
Possible Chart Patterns:
bullish: Double Bottom (Target 248)
bearish: Head-And_Shoulder (Target 90-95)
Nevertheless, it is at the Neckline of a Head-And-Shoulders, so be cautious of a break out of this Wedge
Also the near future depends on the Ukraine Crisis (short-term downside possible | 110$ level of Support).
Plan:
Either small buy in now and check for Weekly close and next weeks opening (pullback due to Ukraine Crisis possible) and buy more if it drops to lower trendline of the Wedge.
Sit still and check if Ukraine crisis heats up (whole Market depends on it).
Put-Call-Spread for the near future, if we drop lower: sell puts at trendline and buy more calls.
Please Watch the Indices (leading the Way) and be prepared for Volatility.
A risky play, with good Risk-to-Reward Ratio.
Please be critical of every Analysis you see (no one can foresee the future) and trade on your own risk.

API3 Will Break Any Day Now!Hello traders,
As you can see on the daily chart of API3, the price performance has been in a downtrend recently however the Momentum Oscillator (RSI) is showing a bullish divergence by presenting us with lower lows! The weekly MACD is also revealing a possible divergence to the green, I see a very low likely hood of it continuing to be red mainly due to the fact MACD's come in swings of 3, which we have already experienced.
Safe trading,
-Pulkanator

Descending Inverse Head and Shoulders on The Graph!Hey traders,
As you can see on the 1HR of The Graph (GRT). The price has formed an inverse head and shoulders with a descending neckline/ resistance. To find the inverse head and shoulders price breakout target, you measure the impulse move of the head and add it to the top of the neckline. This is cool and all but as a bonus, we additionally have a Bullish Divergence on the Momentum Oscillator (RSI)! This makes me really confident we will see a small recovery of +5% in the immediate short term. Set your TP for .437.
Safe trading,
-Pulkanator

NZDJPY Buy IdeaD1 - Price is bouncing higher from a key support zone.
Bullish divergence.
No opposite signs.
H4 - Bullish trend pattern.
Until the two strong support zones hold my view remains bullish here.

ZEC ZCash Bullish divergence + 1st Higher Low on DailyWeekly: After an extreme drop, price went below -1 ATR, but by the looks of it, it seems it is about to close above 1 ATR level. If so, it will become a nice setup on the weekly, which I will provide a setup for, when that sets up. The impulse is still red, but when I peek at the setup of 3 days, I see it's blue already, and with crypto I cheet with this factor sometimes as it is so volatile.
I expect this to close above 100$ support. sRSI is maximum oversold and EFI is ticking up
On the daily we have a nice bullish divergence, and a higher low, which shows a rejection candle, and from there it ticks up. The bullish divergence is on both MACD-H and EFI. sRSI is already rising up and nog overbought. I expect prices to reach between the slow EMA and 1 ATR level.
stop 88,21
entry 98,5
TP 1 111,35
TP 2 115,84
I phase out in parts, therefore I set 2 target profits. But I prefert TP2 here, as this is only on 0.5 ATR, but I have to check the background of the crypto market, as we're in a bear market currently, I am therefore conservative.
PS
The arrow should point to that wick, after the bullish div, but Tradingview morphed the graph somewhat
Trade 2022#002

NZDCHF Buy IdeaD1 - Price has reached a key support zone.
Bullish divergence.
H4 - Multiple false breaks
Bullish divergence.
If the price breaks above the high at 0.61450 we may then consider it as a validation for the bullish view and may expect the price to move higher further.

CADCHFClassic AMD Trade With Multi-Confluence
We Have A ACCUMULATION ( A) BOX
We Had Price Selling A Bit Forming Our MANIPULATION ( M)
Whilst Forming A MANIPULATION, It Filled The Small Liquidity Void
Filled In The Bullish Order Block
Formed Divergence
PD Arrays Checklist
Old Low ✔️
Imbalance ✔️
Bullish Orderblock ✔️
Breaker Block ✔️
Mitigation Block (In Progress)
Type Of Trade
Reversal AMD Trade
Discount PD Arrays Active
Divergence Reversal
Fake H&S Pattern
Trendline Phantom
My Expectation
Price To Start The Distribute Upwards
Price To Mitigate On The Order Block
Price To Fill The Small Liquidity Void And Retrace Downwards
Price To Take Out Lows And See Bearish PD Arrays Active

GBPAUD Buy IdeaH4 - Price has reached a strong support zone.
Bullish hidden divergence.
H1 - Bullish divergence.
Until the key support zones hold my view remains bullish here.
A valid breakout above the downtrend line would be the validation for this bullish view.

Bullish div PENN weekly and false break on dailyWeekly
Bullish div on MACD-H and EFI. We do see 4 EFI diverging locally in the latest decline.sRSI is about to to a strong degree it seems, and might tick up.
Daily:
FB and 1st HL, impulse green. Might possibly start a new uptrend and fullfilling the weely setup
"Entry: around 44
TP1: 57,14
TP2: 62,9
R/R Ratio

CHFJPY - Looking To Buy PullbacksH4 - Price is bouncing higher from a key support zone.
Bullish divergence.
Downtrend line breakout.
H1 - Bullish convergence.
Currently it looks like a pullback is happening.
Until the key support zone holds I expect the price to continue higher further after pullbacks.

Bullish Divergence on Monero (XMR)Shown here on the 4HR Chart of Monero (XMR) you can see that the Momentum Oscillator (RSI) is signaling a medium/ weak bullish divergence. Now, remember, the RSI means general strength, not what the price is doing. So when the RSI is trending up and the price is at a standstill you can bet that the upside is coming. Hope this helps for a short-term trade!
Safe Trading,
-Pulkanator

VET/USD - Potential Bullish DivergenceWe have a potential Bullish Divergence with the Price on the VET Chart and the MACD Line on the Moving Average Convergence Divergence (MACD) indicator as indicated by the Converging Blue Lines. Note that the MACD RED Histograms have also shrunk in size, confirmation will be if the MACD Line (Blue Line) crosses back above the Signal Line (Orange Line) on this 1 day timeframe.
Note that the Stochastic Indicator (STOCH) is showing that VET has plenty of room to move up before entering the Overbought Zone on this 1 day timeframe. Note that the %K (Blue Line) is still above the %D (Orange Line).
At the moment of typing this, VET is fighting stay above its Least Squares Moving Average (LSMA) on this 1d timeframe. A successful daily candle CLOSE above the LSMA on this 1 day timeframe will be considered a Buy Signal for this indicator.
At the moment VET is back above its Bollinger Bands Lower Band but note that VET is still well below its Bollinger Bands Middle Band Basis 20 Period SMA for this 1 day timeframe. For any recovery to become sustainable longterm, we need the Price to CLOSE above the BB Middle Band Basis with a successful re-test as support on this 1 day timeframe.
VET is also in a Falling Wedge Pattern on this 1 day timeframe. A Falling Wedge Pattern is a potential Reversal Pattern. Note that the APEX of the Falling Wedge Pattern is at $0.026 which is around 22nd March 2022.
At the moment of typing this, VET is back above its Volume Profile Fixed Range Point of Control (VPFR POC) for the fixed range of 6x daily candles that i have selected.
Obviously VET is still under the influence of BTC so we have to keep an eye on what BTC is doing as a drop with BTC will drag all alts down with it.
I hope this is helpful with your Trading and Hodl-ing.

Double Bottom with MACD and RSI Bullish Divergence.I thing this one is gonna go up massively if we are to get a relief rally on BTC.
We have bullish divergence on the 2 hour and are looking to break above the moving averages
it looks promising so long as we hold higher lows.
