Bullish Divergence on Shorter TFImmediate Support seems to be
around 82 - 84.
If this level is not sustained, we
may witness 65 - 72 range.
However, Bullish Divergence on Shorter
time frame may give it a spike of 3-5 rupees.
Bullish Divergence

$HNT Bullish Exaggerated Divergence on Daily RSIBeen accumulating a very large position of FWB:HNT
Bullish Exaggerated Divergence on the Daily RSI.
Price looks to have bottomed claiming previous lows.
Helium Mobile is one of the strongest IRL DePin projects 💯
$600m Market Cap is extremely undervalued compared to the rest of the industry.

$BTC Trading Idea – Short-Term BounceCRYPTOCAP:BTC Trading Idea – Short-Term Bounce
Pattern: #BTC is forming a double bottom, indicating a potential trend reversal.
RSI Divergence: Clear bullish divergence on RSI confirms buying momentum.
Target Levels:
First target: $89,000
Second target: $91,000
Third target: $93,500
Outlook: Expecting a short-term bounce before a potential correction. Monitoring price action closely for confirmation.
This setup suggests a high-probability move to the upside in the near term.

a Sign of Hope..Continuously making LH LL (Downtrend).
Currently at an Important Support level.
Double Bottom formation around 1200.
Bullish Divergence is there on Daily TF, which is a Positive Trigger.
However, the stock will reverse its trend once it will Cross & Sustain 1465 atleast.
& if this level is Crossed & Sustained, we may witness 1700 - 1730 initially.
On the flip side, breaking the Current Level (around 1200), will bring more selling pressure
& we may witness 1000 - 1040.

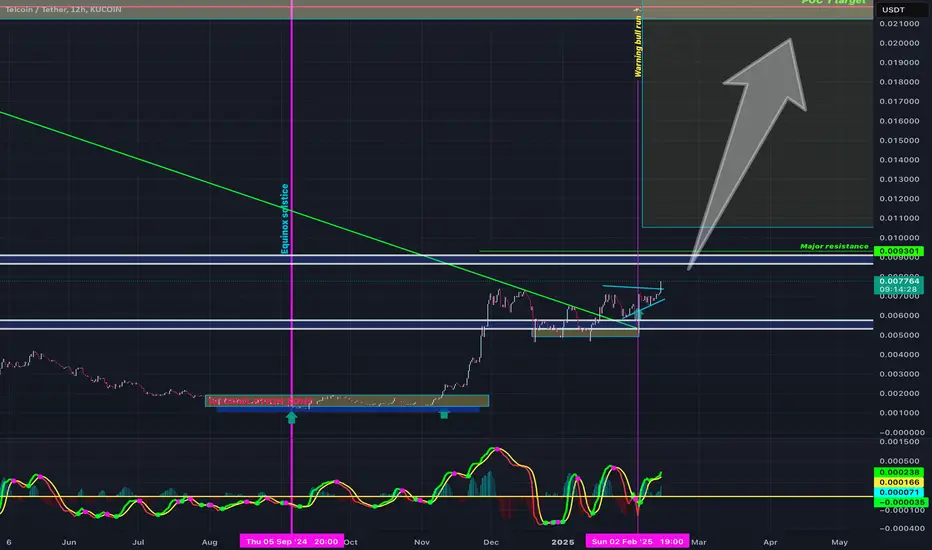
breaking the key resistance at $0.007761 suggest,bullish trend Telcoin is currently ranked #209, with a market cap of approximately $658.96 million.
Price today is gaining steam, breaking the key resistance at $0.007761 suggest a bullish trend, with the 50-day moving average rising and positioned below the current price, indicating potential support for future price movements.
Analysts have identified key resistance levels at $0.007761 and $0.013669. If TEL surpasses these levels, it could signal further upward momentum.
Conversely, support levels are noted at $0.00610 and $0.00472. A decline below these points may indicate potential downward movement.
Overall, Telcoin's recent performance indicates a optimistic outlook, don’t sleep on $telcoin
Let’s see how it holds 🍀✨
TOTAL3 made Bullish Divergence and Reversal at 740BThe asset has formed a total of three waves on the weekly timeframe and recently made a retest at the 740B level. It is likely to form a double bottom pattern here, with the RSI trendline indicating a clear bullish divergence. This suggests a potential bounce from this point, and based on these indicators, the next move is expected to propel the price to the 1.5 to 3 billion range.

Bullish divergence and False Break on JKHY on DailyStrong upwick bar, bouncing with fb from 170 support, bullish div on many indicators, expecting rise up to 1 ATR
TP 177,49
E 172,37
SL 169,07
Good bullish div, one remark: 4H TF is still in downtrend, 13EFI is still not showing much strength.
Also, the impuls on weekly is still red, but Factor 3 is blue , so I'm okay with that, also because the movements are close to the flat EMA's on the weekly.
Furthermore, the bullish div is showing a false break.
Trade #00011
Results so far:
6 from 10 worked out. Hitrate: 60%

Bullish divergence on 4H BTC-USD There is a bullish divergence between Price and RSI on the 4H BTC-USD chart

JD LSE Bullish Divergence on dailyStrong decline, now while ending the decline it's pulling a bullish divergence on the daily, weekly turning up as well
TP 102,5
E 95,44
SL 91,95
Trade #00007
3 trades still open
trade 1 to 3 are closed: hitrate 100%

7202: Weekly Trendline Support7202 has shown reversal from downtrend
Weekly Bullish Divergence on RSI
Trendline support
HH, HL formation on daily time frame
SL or HL or below trendline support
Trade with proper risk management

Reversal Trading Strategy Using GOLDEN RSI Divergence Indicator Overview
Reversal trading strategies capitalize on identifying turning points in the market where a potential reversal from a downtrend to an uptrend, or vice versa, occurs. In this post, I will introduce a strategy based on divergence patterns spotted with a custom RSI (Relative Strength Index) indicator.
This method enhances traditional RSI analysis by making divergence detection clearer and actionable. By combining it with a strong understanding of price action, traders can gain an edge in timing market reversals effectively.
Key Features of This Strategy
Divergence Analysis: The core of this strategy is to identify bullish or bearish divergences between the RSI and price action.
Custom RSI Indicator: The custom RSI indicator simplifies divergence detection by highlighting critical levels and marking divergence points directly on the chart.
Confluence with Price Action: Reversals are validated using trendlines, support/resistance zones, and candlestick patterns.
Chart Example: S&P 500 Index
In the attached chart:
Bullish Divergence:
The price made lower lows, while the RSI made higher lows (indicated by green arrows).
This divergence signaled weakening bearish momentum and potential reversal.
Entry Point:
A clear breakout above the trendline validated the reversal.
Enter long positions near this breakout level.
Stop Loss:
Place the stop loss just below the recent swing low.
Target Profit:
Aim for the next major resistance zone or use a fixed risk-reward ratio (e.g., 1:2 or 1:3).
How to Spot Divergence
Bullish Divergence:
Price forms lower lows.
RSI forms higher lows.
This indicates waning bearish pressure and a potential upward reversal.
Bearish Divergence:
Price forms higher highs.
RSI forms lower highs.
This suggests weakening bullish pressure and a possible downward reversal.
Why This Strategy Works
Strength of RSI Divergence
RSI divergence reflects the loss of momentum in the current trend. By detecting it early, traders can position themselves ahead of major reversals.
Combining Confluence Factors
The success rate of this strategy increases when RSI divergence aligns with other technical factors like:
Horizontal support or resistance levels.
Trendline breaks.
Volume spikes.
Practical Tips for Using This Strategy
Use Multiple Timeframes: Confirm divergence signals on higher timeframes for stronger setups.
Avoid Overtrading: Only act on clear and validated divergence setups to minimize false signals.
Risk Management: Never risk more than 1-2% of your trading capital on a single trade.
Conclusion
This custom RSI-based divergence strategy is a powerful tool to identify high-probability reversal setups. When combined with proper risk management and confluence analysis, it can significantly improve trading outcomes.
Start experimenting with this strategy on your demo account and refine your approach before deploying it in live markets. If you have questions or want to discuss this further, feel free to comment below!

USDJPY ChartThere is Bullish Divergence. We will wait for the breakout of last LH then go for buy trade

Bullish on PEPEPEPE is experiencing a price correction following a significant pump on November 13th. I've identified a bullish wedge pattern that has formed since that date, and PEPE appears to be following this wedge with the potential for a break toward resistance. Despite the recent price decline over the last few days, the On-Balance-Volume (OBV) indicator shows bullish divergence, suggesting upward momentum may be on the horizon.
From a fundamental perspective, I believe PEPE spiked on November 13th, primarily due to its listing on the Robinhood exchange. This exposure is likely to attract retail investors, which could contribute to PEPE's upward momentum in the coming weeks.

Cronos CRO In Trouble - BUY & HODLCronos can go bust, but even so, it's on Sale.
CROUSD / CROUSDT will go straight bull at one point.
So, I am still buying these poopy coins on each major fall they have.
Yeah, that's what I do.. putting my money into a black hole.
My next good BUY LEVEL: $0.03 .
Who knows, maybe I'll actually get rich.
My Technicals on CRO:
* Elliott Wave A-B-C Pattern
* Fibonacci Retracements
* Fibonacci Time Zones
* Double Bottom
* Cycle Analysis
* Bullish Divergence
Fibonacci Time Zones tell me that the beginning of '23 will be amazing!

POPcat Bullish divergence When analyzing potential reversals, I typically look for a few key signals and indicators. First, I check for signs of losing momentum. Next, I observe if the price action is above the Daily Pivot while remaining below the 50 MA, as this suggests the reversal isn’t confirmed yet. Additionally, the overall market sentiment is currently extremely bullish, which further indicates that a reversal may be imminent.

ETH to $25K - No Joke - BUY & HODLEthereum is at levels not seen since the Crypto Stone Age.
The Crypto Markets will start BOOMING!
ETH ( ETHUSD , ETHUSDT , ETHEUR ) is getting ready to go Bullish.
When? Early '23.
The Fibonacci Time Zones and Cycles tell me that the 3rd Fibonacci Summation is NOW.
So, I reckon Cryptos are getting ready for something BIG.
I do see a last drop before that though.
From Jan '18 until Dec '18 ETH had a whooping 94% crash.
We're only at 82% from Nov '21 top. So I am waiting with buying interest for a much better level.
I am buying big dips, adding value.
If you look at the Ellipse, Ethereum is doing the same pattern it did on the previous Bear Market.
Hmmm...
I've decided on my best BUY level: $550 .
Technical Analysis:
* Elliott Wave A-B-C Pattern
* Jan '18 - Dec '18 Fractal Sequence
* 88.6% Fibonacci Retracement
* Harmonic Pattern: Bullish Cypher
* Fibonacci Extensions Confluence
* Bullish Divergence
* Demand Zone
What more do you need?
Oh yeah, a much better price. :D
We went to the Moon, now let's go to Mars!

Bitcoin BTC to $250K - BUY & HODLBitcoin went to the Moon with Dec '17 top.
Then it corrected 88.6% on the Fibonacci Retracement with Dec '18 bottom.
After that it went to Mars and hit the tops again in Nov '21.
It was a 2000% gain.
What can you tell from this?
Percentage-wise, Correction is lower than the gain.
So, the Dominant Trend for BTCUSD is UP!
OK, back to Earth.
Let's gather fuel and power-up the rocket.
Time to go Interstellar.
Before I go into the technical stuff, allow me to keep things simple for you.
I took the liberty and measured the BTC Cycles.
But you don't need to worry about that, just follow my lead!
I used a fancy tool called Fibonacci Time Zones.
This tells me roughly when the next Bullish Cycle for Bitcoin will start.
We are on the 5th Fibonacci Summation milestone, and another 2000% gain is destined to commence.
When?
Early '23 , like all other Cryptocurrencies.
What's the level?
My ultimate levels are: 10K & 7.5K .
I will buy more there.
I will HODL for the long-term because I know it's a waiting game.
Now you have what you came for: when & where.
You can go ahead and open the next idea. :)
Thank you and you're welcome.
But if you capable of digesting what's to come below, then I put my hat down...
Bitcoin ( BTCUSD , BTCUSDT , BTCBUSD ) Technical Analysis:
* Elliott Wave Cycle: Complete V Cycle Degree (white)
* A-B-C Elliott Wave Correction (red)
* Ending Diagonal in Cycle C (red)
* Harmonic Pattern: Cypher
* 88.6% Fibonacci Retracement
* 161.8% (Golden Ratio) Fibonacci Extension
* Bullish Divergence
* Dominant Trend Line (turquoise dotted)
* Demand Zone
* Fractal Pattern
If you get all this without a headache then you're a legend!
The Aug '15 to Dec '17 is what I'm expecting, and it's a BIG one.
Good luck my fellow HODLer..
Thanks for the like,
Richard, the Wave Jedi.

GBPUSD Trade PlanChart shows a bullish divergence between price and RSI, alongside an inverse head and shoulders pattern, indicating a potential bullish reversal.
The trade setup suggests a buy stop above the neckline at 1.27268, with a stop loss at 1.25861 (below the lower low).
Profit targets are TP1 at 1.28680 (first resistance) and TP2 at 1.30080 (higher resistance).
Ensure confirmation with a strong breakout above the neckline.
Partial profits can be taken at TP1, moving the stop loss to breakeven for a risk-free trade.
If the price closes below 1.25861, the setup is invalidated, and no entry should be made.

CXW Inverse Head and Shoulder + Bullish Divergence!Hey Folks!
Not a fundamental analysis or financial advice, but trading idea on why it could do well in the coming months and beyond. I have discovered a technical repeat pattern in this one. I first found this stock after Trump made his statement regarding large deportations if elected. So naturally I look up prison stocks lol.
I made a nice trade on it last time it dipped and reversed, and I want to bring it to everyone's attention.
The overall pattern is shaping up nicely for a big move, a long election season is approaching border security will be a big deal and Core Civic will benefit in form of major government contracts, especially if Trump gets re-elected, even Biden might get pressured to crack down on border security.
From the company, I'd like to see a new fundamental catalyst to capitalize on this bullish setup.
Happy Trading!
OnePath

Educational post BTC bullish divergence.You need to use RSI indicator. That's how I spotted the reversal.
Bullish divergence.
Bullish divergence happens when the price makes lower lows, but an indicator (like RSI or MACD) makes higher lows, suggesting weakening downward momentum and a potential upward reversal.


NZDUSD ChartThere is Bullish Divergence. So chance of trend reversal wait till breakout last LH. Then take buy entry.
