Must Be Bull Divergence Wednesday for $BTCNot a guarantee to bounce on these bullish divergences, but maybe some slight hopium?
Fibo
Bullish Divergence
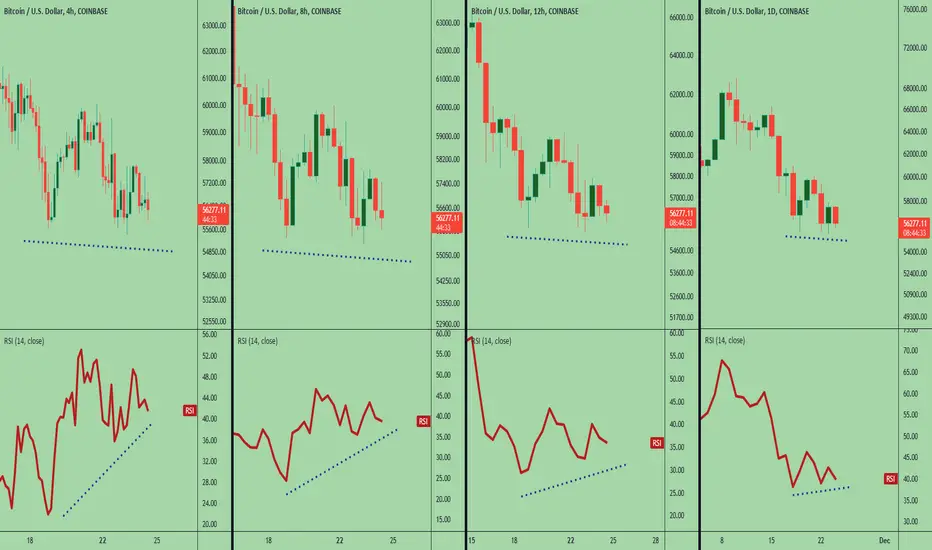
Bitcoin Short And Mid Term ForecastD1 - Bearish convergence.
Expecting the price to move lower further after pullbacks.
H4 - Bearish trend pattern.
Price has currently reached a key support zone.
Bullish divergence.
Basically my short term expectation is bullish and my mid term expectation is bearish here.

CakeBnb - Series of bullish Divergences in 12h TFCake is near bottom.
Wait for the 3D to turn up.
W TF there will probably be Adam pattern forming. Sharp V coming..
Not Financial Advice. Do your own research.

WTRH breakout from descending channel?I moronically sold some call options on this and missed out on the huge gains up towards $2.50.
Am I seeing things hoping to make it back or is this another setup? Copying the gains from the last pump, another 200% gain would see WTRH back up towards $3. There is also a bullish divergence (red lines) that is also similar to the last dump and consolidation. This time it has happened over a much shorter time period, so it might be confirmation bias? Anyways, RSI bottoming out with a BuD, could be a juicy pump in the near future.
NFA, aka Never Financially Adept, Naturally Fiscally Averse, NOT Free Avocados, and probably Not Financial Advice.

Bullish Gartley Double Bottom EntryBullish Divergence on the Daily Double Bottom at the PCZ of a perfect Gartley Pattern

Falling Wedge Hanging Out At Potential SupportIf we break this wedge we could go for a huge ABCD move that would take us to the 1.618. So long as we continue to hold onto this support level like we've been doing for the past few months we should expect to see this eventually break upwards.

POLKADOT SPOT BUY SIGNAL - BOTTOMPOLKADOT SPOT BUY SIGNAL
Entry: 41.50-38.50
Target: 46.10 , 49.85 , 54.00
DOT Daily chart looks really good here. I bought DOT spot and will swing it!

4hr Bullish Engulfing Higher Low Above Bullish Shark PCZThe price and the RSI are attempting higher lows above the PCZ of a Bullish Shark and the 4 Hour is Bullishly Engulfing if price may attempt a breakout of the trendline after the closing of this Engulfing Candle and the RSI will attempt a rally above the 50 line.
My targets here will be the .786 and .886

The only divergences guide you needHello, everyone!
There are a lot of traders and many of them use divergence in their own way. Most of these ways lead to the deposit losses in the long run, because generate the late entries. I like to trade with Alexander Elder’s approach to the divergence. It has the clear entry condition and the small stop-losses in case of mistake. Divergences allows to enter the market exactly before the actual trend reverse, thus you always buy the dip and sell the rip, which produces the best risk to reward ratio. Foe divergence defining we will use MACD indicator, but you can choose any oscillator with zero-lne. After reading this guide you will be able to define divergences on every appropriate oscillator.
Let’s consider this approach!
Bearish Divergence
What is bearish divergence? For the true bearish divergence we should see four obligatory signs.
(1) Point C on the price chart should be higher than point A.
(2) Point C on the MACD is below than point A.
(3) The MACD histogram have to cross the zero-line to the downside to form the point B
(4) The MACD histogram have to cross the zero-lne to the upside after the (3).
Now it’s time to find the entry point. Point C is formed when the decreasing column appeared on the MACD. (5) It is the time to execute short position . Stop loss we should take above the point’s C high. As you can see we have the very small stop loss with the huge profit potential.
Next condition enhances the short signal:
(6′) Decreasing MACD lines while the price increases.
Bullish Divergence
Bullish divergence is the opposite to the bearish. We have to see the following conditions.
(1) Point C is below the point A on the price chart.
(2) Point C is above the point A on the MACD histogram.
(3) We have to see first MACD histogram crossover with zero-line to the upside to form the point B.
(4) Than we have to see the opposite crossover to the downside.
Now it’s time to wait the first increasing column on MACD histogram to spot the point C and (5) execute the long positions . Stop loss should be set below the point C low.
We can often see the price decrease continuation to the point D, this point is (6) also forms divergence, which enhances long signal, like the (7) divergence with MACD lines.
In this particular case the stop loss was not hit, but it could be the case. In this case we should re-enter position when the divergence conditions was met again.
DISCLAMER: Information is provided only for educational purposes. Do your own study before taking any actions or decisions at the real market.

BTC Bullish Divergence + Inverse Head & ShouldersBTC now showing some solid bullish divergence since the beginning of this latest price move on the hourly. Both RSI and Chaikin Oscillator are climbing but not into overbought zones, feels comfortable. We also just breached the A/D line for the first time in this move (yellow highlight) implying bulls are accumulating and vying to retake control. This all comes in tandem with a classic inverse head & shoulders pattern - we're currently trading at the neckline, if BTC can break $58.4k with volume it should quickly rally to the next resistance zone at ~$60k. If that happens I don't expect a shaky retest but instead think BTC could blow through $60k to fully resume it's broader uptrend.

BITCOIN BEARISH PULLBACK BUILING UPMarket sentiment is bearish at the moment. We saw price broke the weekly market structure and made a temporary support at the level. Price gaining bullish momentum and pushing towards daily and 4H demand zone. Kindly refer to the chart and watch out for the noted levels.

Bitcoin is about to go parabolic !As I mentioned yesterday, there are many similarities between the 2021 and 2017 bullrun.
On the daily we are actually putting in a double bottom as we speak with bullish divergence on the RSI.
This is a wild coincidence especially when the RSI bullish divergence is angled on the exact same angle as 2017(30degrees), assuming we bounce from here.
This could mean were about to go parabolic. Time will tell. Good Luck!

GBPAUD Short Term Buy IdeaD1 - Price is bouncing higher from a strong support zone.
Bullish divergence.
Expecting short term bullish moves to happen here.
H4 - Bullish trend pattern.
Until the two key support zones hold I expect the price to move higher further in the short term.

bullish divergences at 618 fibonacciwe just got bullish divergences on vmc oscillator on the way down, vwap crossed on 37 min and down and money flow green. GL to all. use proper risk mangement

BTC-USD Bitcoin road to Recovery 68K and new ATHsInterval: 4hrs
Description: After the Taproot upgrade Bitcoin gets as low as 53/54Ks and recovers for 68/69K ATH with parabolic flight. Afterwards new ATHS 79K and others are on the horizon.

USDCHF Intraday Buy IdeaD1 - Price is bouncing higher from a strong support zone where the bottom of the range coincides.
No opposite signs.
Expecting short term bullish moves to happen here.
H4 - Bullish divergence.
Higher highs.
Until the strong support zone holds I expect the price to continue higher further.

BNB Update Analysis!BNB UPDATE ANALYSIS!
As you can see my yesterday prediction price about BNB. i suggest BNB will make falling
wedge bullish pattern. But suddenly BNB
drops the price until reach 570.1.
But after the effect. I can see another bullish pattern
that possibility appears on BNB H4 Timeframe chart.
BNB now have possibility to create D.B.W bullish pattern.
As you can see on stochasitic indicator. There will be make regular bullish divergence. So
the stochastic and DBW pattern may be the reason behind BNB will goes on the bullush trend again.
I also predicting that BNB bullish move 688.7 - 707.8 price range. Because there are 3 Fibbonaci cluster areas with
the golden ratio converges in the area of the price range.
Note : The market will always change, I'm just sharing my view on the possibility the market will go away. If you have a different perspective from your analysis view, let me know in the comments.

DOT-USD - Bull Case Polkadot tries to hit $61 based on the FIBInterval: 4hrs
Description: Polkadot recovers from the sale, and tries to hit $61 milestone by Nov 22.

$CGC Revisiting The Bat PCZ For a Second Time.CGC had a bullish setup in this area before why not try and go for it again and potentially fill the wick that we created during the last run?
We have bullish Divergence on both the MACD and RSI suggesting that we may get a bounce from this zone again and this time we may even go higher than the last time.
Check out the related idea section if curious as to what conditions CGC was under just before the last bearish reversal.

Bullish Gartley With Bullish Divergence We recently had a surge in volume to the downside but still are bullishly diverging on the RSI at this potential PCZ.

ADAUSDT / ADABTC Long until end of November15minute length graph is the wrong one I have put ! Please look at the 5 hour length graph below ! sorry !!!!
I see rsi (relative strength index) as the 1st differential of the price by time !
(let's study how rsi values are created later and see if my idea is right or wrong XD)
The fundamental is that If I see the rsi going up where the price is going down or not going up, I buy !!
But there are major conditions that I put on after this fundamental to confirm the bet. I don't buy something just because I saw the upwards divergence.
I close the position with loss when the rsi value goes down too much that the upwards divergence has lost its shape.
(I look at local minimal points of the price, trade volume of those points and whether rsi values of those points are going up)
I hold until the point where I feel and examine that it is fair price aviation for that good upwards momentum we have been leveraging on.
(I only do spot trade now, no leveraged bets. I mean I am leveraging on the upward force !)
There are many minor details among this process, I can tell you if you want just let me know I might make a video of sh1tty quality of me trying to explain those stuff, but it's really just the fundamentals that the legends have been emphasizing quite much !
For example, in ADA USD or ADA USDT graph, you can find three lower apex prices in the 5-hour unit chart, they were impactful lower points in my eyes.
However, I observed rsi values of those three points went up subsequent to the former ones.
So I looked at every other hour unit graph and one extra rsi graph with different numbers for averaging tick bundle (length), and I confirmed to myself that the anabatic force is being applied, and I also felt that it isn't too weak to fail to support the anabatic energy, and also it isn't in short time interval either.
So I made a speculation that the price would go up to around 2.821$ in usdt scale for binance chart, and that time will be roughly around 19th of November this year !
So from today, my plan is to hold on to ada for about 8 days !
I will close the position if the rsi anabatic divergence is interrupted with a bigger catabatic rsi change, but I wouldn't sell ada if that divergence is still there. In that I mean, even if the price of ada in usdt scale hits lower than 1.78$, I wouldn't actually close the position if the divergence hasn't been disturbed !
There are much more that I would love to talk about during this thought anabolism, I will tell you just one more principle during this process.
It is about why I used binance usdt chart for feeling how ada is doing !
I mean, I could have used adakrw, adausd in coinbase, kraken, etc ... There are so many other counter-values or exchanges that forms a team.
However, I have chosen binance usdt chart for ada for speculation, because I believed that it has the biggest volume among all the other, and I also believed that it will be harder for the bigger one to possess a bigger overpotential than the smaller one when it comes to the inertia of real price - shown price regression.
Like, if you are to ask the answer to a question that your teacher has given you for homework, I would believe a friend who has a higher score on that major would have more tendency to answer it better than a friend who has a lower score !
Here it is just my playground and I am trying to have fun.
I am happy to share my thought process, and you can share what you think, I'll be fine with it !
Here is ADABTC chart if you want to try applying my thought process just for fun !
BINANCE:ADAUSDT

EURGBP - Looking To Buy PullbacksW1 - Price is bouncing higher from a key support zone formed by the 100% Fibonacci expansion level of the first wave.
Bullish divergence.
H4 - Bullish trend pattern.
Higher highs.
Bullish hidden divergence.
Until the two strong support zones hold my view remains bullish here.

AUDCHF Bullish DivergenceWe can see that Bullish Divergence was Detected and also reached the support zone. so we can go for a long. Good luck 🙂
