Bullish Pennant- BreakoutWatching HD closely here and looking for a breakout (Broader Market Conditions Permitting) -
- MACD is seemingly about to cross
- Bullish hammer right on the 50-day EMA
- Slight bullish divergence on the RSI
- just some support and resistance levels to keep an eye on along with some RSI based supply and demand zones
PT1- $325.78
PT2- $328.73
PT3- $329.49+
Bullish Divergence

Bullish Shark Visible On The WeeklyWe have a Bullish Shak with lots of Bullish Divergence at the Oversold Zone.

Big Data and The Chart Patterns Suggest A Pump In Yields is NearI think we will see a pump in the Yields, the DXY, and a decline in Commodities. I posted the wrong ticker before but this is the correct one so if you entered the trade on TYD get out of it and enter TYO instead.

Bitcoin Dominance May Be Looking To Increase In The Coming WeeksWe are at the PCZ of a Bullish Shark and showing signs of Exhaustion and Bullish Divergence I suspect this will negatively impact that BTC Pairs in the market.

GBPAUD Possible ReversalRSI indicating Bullish Divergence so a possible reversal may show up here. Possible trap to short sellers.

$UBER Bullish DivergenceClosed out last Uber trade with profits. Re entered here as I noticed 11/19 calls sweeping.
Indicators showing bullish divergence and trading well below respected AVWAP.
Looking for a reversal and move back up towards the AVWAP/middle of channel. Run up to earnings also in play with the 11/19
11/19 45C 1.77 avg 21K OI
11/19 47.5C 1.2 avg 4K OI

It Looks Like A Double Bottom But Very Likely Could Be A TrapI was looking at this earlier as a potential double bottom with bullish divergence and was looking to take a position after the sessions opened but after a few hours of waiting and letting the trading of this asset go on during the sessions i have not seen anything that would signal immediate bullishness.
I think that this "Double Bottom" Has potential to trap many bulls and instead send the price down to around $9.
The signal i will be using to enter short is once the MACD breaks the trendline and crosses bearishly i think we will see a nice move down to the $9s
EURUSD Aug 25th Swing AnalysisWeekly MFI is oversold indicating possible bottom out and major trend continuation to upside. 4H bullish divergence. 4H engulfing candle crossing ichimoku cloud. If price breaks channel looking for swing to resistance levels and final swing price goal of around 1.23000. In the past when price moved from this area it took a month give or take to move 500-600 pips when it was ready. Since August is almost over. If price breaks channel expecting September and October to be bullish and get to final price 1.23000.

BTC Double Bullish Divergence! On 1hr TF, we have bullish divergence on MACD and RSI. I think this will be the BTC path.

Bullish Bat Entry on Potential Double Bottom.Lets see if we can get a double bottom from here. The MACD Looks ready to cross bullishly.

Post-Profit Reentry at PCZ of Bullish GartleyA few weeks ago USDCHF bullishly reversed at the PCZ of a Bullish ABCD and reached the profit taking zone and has since reversed bearishly from that profit taking zone. Now it looks to want to make a higher low and could be forming an Inverse Head and Shoulders along with a Bullish Gartley to back it up.
I will look to reenter long here and aim to ride this up to much higher targets this time.

$SOS Looks ready to explode Just noticed the bullish divergence in the OBV indicator and went long calls and a few hundred shares at 2.7
With Crypto going on another bull run , stock appears to be completing phase C wyckoff accumulation . Expecting a move up soon.
Just an idea not advice, but with how long this has been basing I prefer shares over options to avoid any theta burn

Bullish Divergence Near SupportNZD Must Hold this level or else it's at risk of making deep retraces to the downside.

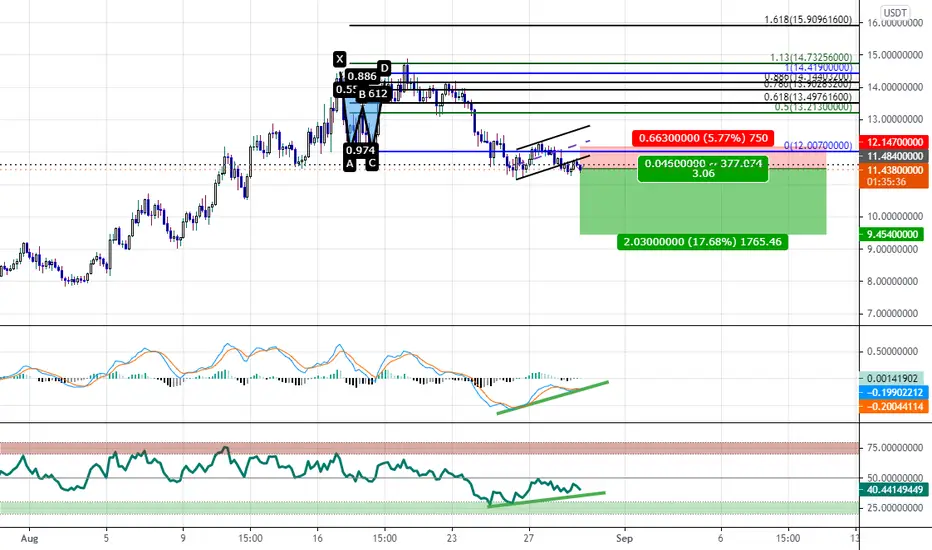
Weekly Bullish Engulfing at 0.886 PCZ of Bullish SharkThe execution of this trade is pretty simple: You have Bullish Divergence and you have a Weekly Bullish Engulfing. Stay above the low of the Weekly Bullish Engulfing candle and you should be clear for takeoff.

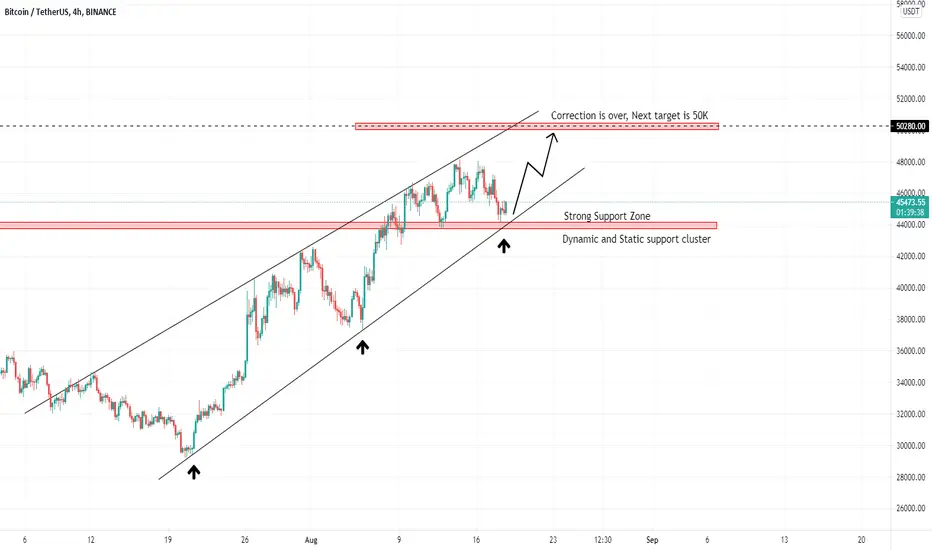
Bitcoin is going to see 50K sooner than anyone expect!Hi dear followers, Bitcoin is supported by a strong support zone also some bullish Divergence had been seen in bigger time frames which shows Bitcoin is going to touch 50K sooner than anyone expect.
In previous analysis I said Bitcoin will see 42K Before 50K, Given the current situation, this is not possible!
Get ready for the next wave, Don't forget that overall trend is still bullish.
Good luck
XAUUSD August 19th AnalysisPrice in overall uptrend. Created trend continuation pattern on 1H. Bullish divergence as well. Expecting price to break pattern and continue to 1801 area as next resistance level.

GBPAUD Short Term Sell Idea Update!!!In this pair my short term view was bearish and I was expecting the price to move lower further towards the two key support zones.
On the H1 chart, the price action followed my analysis exactly as I expected it to. The price moved lower further and provided a fantastic move to the downside and reached the first key support zone until it was blocked by a bullish divergence.
Original Idea

Bullish Price Action on BTCAs can be seen in the chart below, the upward waves have been getting steeper while the downward waves have been getting shallower. This means the bears are losing momentum and the bulls are gaining momentum. There are also bullish divergences in the RSI. These signals combined mean it is extremely likely that we see an uptrend for 1-2 days at least to 48k and beyond.

MU saw some people on Bezinga Stream floundering on this..This shows MACD Bullish Divergence and thats to $92. My path shows to $120-128. Chart looks really. Good. I used the Cloud this time to find the same move in the past. As i think its more reliable when you can find price action dip into the cloud the same way and with the same kind of candles that have been painted. I customized this Cloud way out of wack from the standard I dont know what possessed me to use the settings I have but It has been very reliable.
by iCantw84it
07.30.2021

Crypto Poised For Another Weekend PumpIt seems Binance USDT pairing oracles are having issues on TradingView at the moment so we switch to BTCUSD Coinbase exchange to give us a more updated view of my previous idea on Bitcoin that is currently playing out nicely.
As you can see in the chart there are a lot of things going in terms of what has played that has given us a clearer picture. One of the first things that stands out is the bearish head and shoulders pattern that broke today and resulted in a decent pullback of a 5% measured move.
And in doing so created a slightly higher low on the 4 hour chart.. meanwhile the RSI is diverging and still putting in lower lows which means we now have hidden bullish divergence on the RSI on the 4 hour timeframe.
The key to this is in the fact that A) a bearish pattern has completed itself and B) bears failed to pivot the macro movement of price with a lower low that would of course created the first leg of a potential downtrend.
This leaves us now with momentum for a retest of previous highs right around $46500. There are bearish things to keep in mind as Bitcoin does appear to be rounding on its chart which means Bitcoin's price action needs to get moving as further consolidation in this area would seem more favorable for the bears than the bulls.
We do have eerily similar hidden bullish divergence that played out in July that resulted in a quick 10% move to the upside. That would be enough to give BTC another higher high on its way to what could be much higher price levels in the not so distant future IF this was to play out.

GBPUSD Falling WedgeFalling wedge pattern on 1H with bullish divergence. Expecting price to reach resistance zone. Have to wait and see how price reacts at zone after pattern breakout to determine if it's trend continuation to upside.

Bullish ABCD PCZ ReachedWe have a Bullish Engulfing at the PCZ of a Bullish ABCD Near Support with Bullish Divergence on the RSI.

Buy Eurusd now after it pull back from demand zoneBuy Eurusd now after it pull back from demand zone
And RSI is rising and make bullish divergence
EURUSD
TYPE : BUY
TF : H1
ENTRY PRICE : 1.1765
STOP LOSS : 1.1735 (30 PIPS)
TAKE PROFIT : TP1: 1.1785 TP2: 1.1825 TP3: 1.1880 TP4: 1.1916
