GBPJPY Inverse Head & ShoulderPrice made Inverse Head & Shoulder on both 1H & 4H time frame. Currently 15 min bollinger band breakout o start 1H BB breakout. 1H Bullish Divergence. Expecting 200-300 pip move.
Bullish Divergence

1HR Falling Wedge Breakout With Bullish DivergenceXLM is attempting a break above a descending channel and we may see it try to recover some of it's losses soon.

Natural Gas Inverse ETF Looking Bullish In RangeNatural Gas is looking bearish with a potential bearish ABCD:
There for in an attempt to play this bearish move down i will be looking into trading this inverted ETF.
This ETF seems to be trading near the bottom of a long term trading range that has never been broken in it's 10 years history while showing MACD Bullish Divergence and being Oversold on the RSI so i see this as the perfect place to buy.

Diamond Double Bottom with Bullish DivergenceCheck the related ideas below for other still very valid reasons to be bullish on this pair.
GBP/USD bullish divergence pip sesssion Pt.2-Discussed in previous posts, bullish divergence and we struck out TP2(golden egg). My prediction is we are still in a bullish trend, composing technical analysis.
-first structure level will be broke. Fade the breakup( false breakout). But will head back up to our structure level(top orange box) at top crown!
Risk v. Reward:
.57%(80pips) - 1.39%(195pips)

Bullish AB+CD PCZ ReachedIn the previous chart i made of this coin i provided an early C entry and now that we've reached targets i am providing a potential D entry.
If there's any bullishness left in this coin's market this is where you'll find it.

GBP/USD Bullish divergence/UptrendAs you can see we a going for a bullish trend, just temporary being only time will tell. A bullish divergence was show and we are Heading for structure zone(orange box) with prediction that it will hit:
Tp1- 1.39055
Tp2( golden egg)- 1.39847
RvR: .6% to 1.15%
Handful of pips to be grabbed ladies and gentlemen!

EURUSD July 14th Daily AnalysisPrice currently in Monthly range zone 1.18206 - 1.22313. Daily RSI shows Bearish Divergence & Hidden Bullish Divergence. Bearish Divergence is when price made reversal from top of zone to bottom. The hidden Bullish Divergence has been slowly getting created. The marked circles are hidden bullish divergence which means trend continuation to upside. There has been a reversal pattern formed on 4H. You can view pattern in my link to related ideas. Waiting for breakout of pattern.

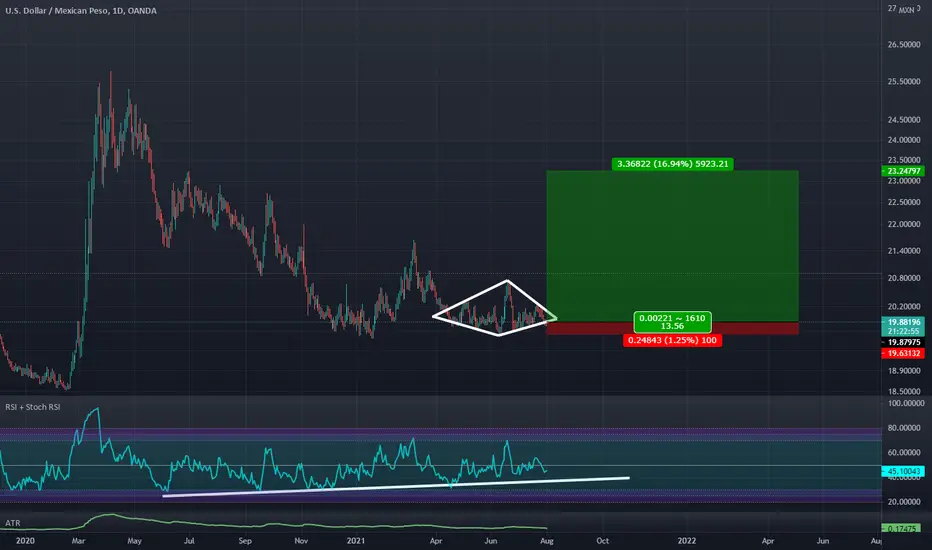
GRPUSD Correction down then a pop back up to current priceUsed the Algo Key Code and on the Daily there is DIvergence. Anytime there is divergence price can actually drop down make a U shap in price action then pop up to fullfill the divergence. So thats what this looks like its doing on the 15 min time frame. The Daily is showing it will go to $1.39 I wouldnt bet the farm on it. but maybe the pig.
by iCantw84it
07.24.2021

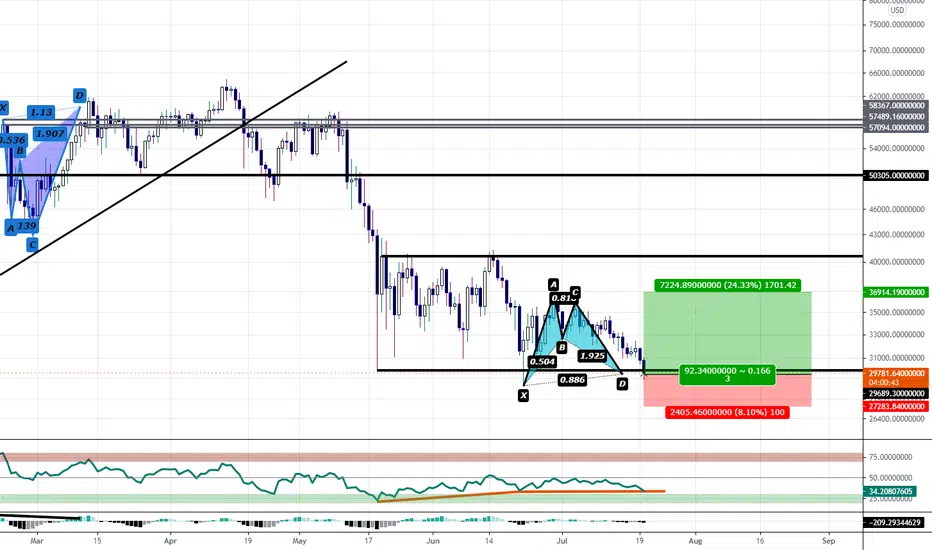
Bullish bat near bottom of a range: RSI DivergenceWe have RSI Divergence near the bottom of a range at an 0.886 PCZ to a bullish bat pattern if we're lucky we may see a run up back to around $35,000 but if BTC Breaks the range and fails to stay above $28,000 then we will likely see BTC dump down to $18,0000 or lower.
Weekly Bullish Divergence and Falling Wedge at 786 RetracementWe have both Hidden and Classic Bullish Divergence at the 0.786 retrace and a Falling Wedge Visible on the Weekly Timeframe.

GBPJPY July 20 Bullish divergence on 30 min indicating reversal/pullback.
Price made Engulfing on 30 min confirming reversal/indication.

FILDA Bullish Divergence on RSI Has Lead to Explosive MovesEach time we have seen bullish divergence on the RSI compared with downward sell pressure, we have seen explosive moves up.
At the end of May, the price was falling dramatically, printed a higher low on the RSI and immediately rebounded with an 82% move in days.
The same thing occurred in the middle of June as well, falling price, higher low on RSI followed by a 170% move in 6 days from the higher low on the RSI.
Will be interesting to see how this plays out, but will we get a similar reaction this time?
Couple the potential upside returns with 71% APR rewards for staking in the Filda DAO, and this gem could be worth adding some to your crypto portfolio!
- CA$HLESS

Strong Long 🥗 Top AI Long // Bullish Divergence"We've received an ultimate Bullish buy signal from our Machine Learning bot."
▶️ KEY POINTS:
- There's Bullish Divergence on RSI
- Negative Funding Rates = Bears pay money to Bulls
- Price Action is on the top of Bullish pressure from Top Traders
- Price bounced upwards from the Linear Regression channel support
🆕 Don't forget to bookmark this page for daily updates!

Bullish Bat with Bullish Divergence on DailyWe have bullish divergence on both the RSI and MACD at an 0.886 retracement.
I will buy between the 0.786 and 0.886 and put my stoploss below 28 cents.
I will be aiming for 15-18 cents for profit taking.

ETH/USD: Bullish Divergence in RSI and price action confirmed!!!I look that Ethereum show us a good entry to make a reversal of the trend buying in the yellow zone where represent the key support in Daily timeframe, but more later I will going to create another interesting analysis in Daly timeframe in Ethereum. I use my old strategy to prove the zones to know in least to use lines, becuase in the past the zones it's get me good result in my trading just analyzing from Daily timeframe.
s3.tradingview.com
Now, if you look in H8 timeframe, Ethereum forming a bullish hammer, and that will be a good signal that at least Ethereum could to recover the trend to up.
I entry in this trade where I put my SL at $1,777 USD and my target will be around of $2,400 USD.
In some minutes, I will going to analyze the Daily timeframe

ETH Correction Coming to an End?Follow up from my last idea.
Could this be the end up this massive dip?
We are still within the falling wedge on ETH and can also see a bullish divergence on the RSI on the 4HR time frame. MACD seems to be slowly turning up as well if you zoom in(Be be grasping at straws here), as well as the RSI slowly creeping back up.
Ethereum seems to have respected the trend line going back to the 28th of February during this massive correction and has bounced perfectly from the trend line from the 25th of March on the 14th of July.
We may see some more potential downside before we go back up again but, going off of the both of the trend lines I don't think we will see under $1800 unless the market actually crashes which most people seem to be expecting.
Going to wait for more confirmation before going long again though, these red candles are scaring me.
Let me know what you think and if you have any ideas on what might happen :)

Bullish Divergences Above the 200 day Moving AverageI think it may try to go back up to around 55 dollars in the short-term before continued downside in the long-term.

EURUSD July 12th AnalysisPrice currently at bottom of monthly zone. Weekly sellers exhaustion. Creating a reversal pattern on 4H. Also Bullish divergence on 4H. Expecting price to break out of pattern and reach TP 1 and TP 2.

Bitcoin appears to be trading in a bear flag!In dark blue, you can notice a bearish flag pattern forming with multiple bounces off the horizontal baseline of support and what appears to be a series of lower highs underneath a downward sloping resistance line.
A possible Macro H&S pattern would coincide with a blow-off top at the launching of Goldman Sachs bitcoin futures contracts, similar to late 2017 CME BTC futures contracts calling the tippy top. I have drawn a bearish hypothetical scenario in red.
On the RSI there is a series of higher lows indicating a potential bullish divergence taking place. A bullish divergence occurs when prices fall to a new low while an oscillator fails to reach a new low. This situation demonstrates that bears are losing power, and that bulls are ready to control the market again—often a bullish divergence marks the end of a downtrend.
On the KST there were recently two bullish crosses and it looks like a higher high may be created for the first time since the blow-off top in March/April.

[2021-07-10] BTCUSDT, Bullish DivergenceAS the RSI creates an oversold reading followed by a higher low that matches correspondingly lower lows in the price, a bullish divergence occurs.
This indicates rising bullish momentum.
In addition, the falling wedge is a bullish pattern regardless of what kind of market it appears in.
The break happens when a price goes through and stays above the resistance line.

Gold Misleading RSI Bullish DivergenceGood day guys! It has been a few days since my previous post. Those who follow me know that I am a long term trader, so when I enter a position, I look to hold that position for days at a time. On the chart, I wanted to show you what I found in common with all these positions I entered into as the trends continues downward. There appears to be price action rejecting the trend line/zone, an aggressive move to the downside with price action making lower lows and RSI making higher lows. This brings forth a small rally or price action ranging a bit before continuing to the downside. I am a probabilities and statistics nut, so I do not see why the odds are not highly likely to provide the same outcome. If you notice, price action is slumping over, which is bearish. I teach this in my advance teachings. Gold will have its run to new highs. However, based on the fundamental and fears of rising interest rates, I do not believe that time has come. In other words, "it is too soon." To gain access every time I send out an update, be sure to follow for my technical and fundamental analysis from tradingview.com . Well we do appreciate you for checking out our post and remember, we will see you on the other side.
Rodrick Goss (CEO)
Third Eye Traders

CHFPY Sell Idea Update!!!In this pair my view was bearish and I was expecting the price to move lower further.
The price moved lower directly here without pullbacks and provided a fantastic move to the downside delivering around 200 pips move until it was blocked by a bullish divergence.
Original Idea
