STRONG BULLISH DIVERGENCE ON DAILY TFBitcoin clearly indicates bullish divergence on daily time frame. 30885 looks good for long setup. Invalidation level should be below 27185.
Bullish Divergence

Tata Motors - A Short Term BuyAlthough Tata Motors stock is down more than 70% from its fall, there is still no signal for a reversal in monthly chart.
But it may give a good returns in next 1-2 months.
Tata Motors can give a returns upto 30-40%, as we can see a growth in volume ans RSI is in oversold position.
Also in daily and weekly chart buying has been seen forming Bullish Divergence.
We can set a target of 250 in next 2 months.

cup pattern and bullish divergence min target 1821 max 1857invalidation at 1857
above 1857 probably stuck at 1874 resistance
normally target 1821 then drop to 1704
or target 1839 or 1857 then drop to 1668 or lower
so rejection at 1840 or 1857 would indicate a stronger bearish movement
also could rejected at 1805 and drop to 173x

SuperBTC bullish divergence $SuperBTCSuper is one to watch. Double bottom on the daily with bullish divergence on the smaller time frames

XRP bullish divOn the 1hr and also on the 2/3/4hr
Has still to play out, dad bitcoin has to be calm and respect the downward support line of the channel for now
At least this is saying me that short term sellers have less strength than before.

Bullish Bat 30-50% Upside Potential if it plays out.If we can hold the 886 and especially not make a lower low then i expect us to see significant retrace upwards as Crypto continues to remain sideways within it's massive range.

Similarities between DASHBTC and ETHBTCI have had a favorable view of Dash for a while and have been trying to construct a trading plan. The scratching in the back of my head had me look at the DASHBTC chart and compare it to the ETHBTC chart and here are the similarities I plan on using until my plan is invalidated for the next couple of years.
Chart Overview and Analysis
The black bands were drawn on the monthly chart and are zone of serious consolidation for many years for both trading pairs. When price finally clears the area on the monthly timeframe there massive gains to be had. The top of the zone failed as support there was a multi-year bear market against bitcoin
Ethereum moved faster against bitcoin but it also had less upside and downside. Dash is taking longer to consolidate against Bitcoin but when it finishes it very likely will have more gains for the patient.
The speed of the movements can be seen with ETH already way above its 400w EMA and finding resistance and consolidating against zone of price action where it failed to find the 400 as support.
Dash has a chart pattern against the 400 EMA just as ETH and I suspect it will resolve bullishly. This will take price action above the 400 EMA and to the resistance trendline which is now some 7 months old. From there a retest of the 400 EMA/Megaphone support would be very natural.
DASHBTC retesting the 400 EMA is a very serious even. It could be over a 50% pullback on the pair and an even more serious pull back against USD, up to 70 percent. DASHBTC could resolve itself bullishly while DASHUSD and BTCUSD are in a multi-year bear market.
More Charts
Below is the Fib Retrace from DashUSD ATH to bear market low and we see that price action failed right in the golden pocket. I suspect we will see a lot of consolidation and the next major stall will be at the 0.786 and then price action will test the 0.618 as rough support.
The next chart is the most provisional but it shows a possible recovery route for Dashusd. There was a quick move to just shy of the 0.5 retracement level, a consolidation and then a move to the the golden pocket. I expect something similar but not an exact repeat.
Here is a zoom in of DASHBTC on the daily chart. The MACD Histogram has a lot of bullish divergence as does the MACD (Asprey Version) and the RSI has found a technical double bottom. I suspect price action will stall at the top of daily BB and Keltner Channel and have some chop but the price action in February does show I could be pleasantly surprised by a very quick move to resistance.
DashEth on the weekly is looking like it will return to the black trendline and possibly beat it as resistance. The purple arrows show bullish divergence and the orange line shows a technical double bottom. Very promising and even if it stalls at the black trendline again it still doubles against ETH.
Final DashUSD targets
Here is Dash next to ETH on the long term chart. Both have the ichimoku clouds on the weekly setting turned bullish and it makes it clear that in very short order DASH could be closing in on its 1.414 fib extension over $8,200 or perhaps an even higher fib target. Off to the left we see the importance of taking profit before the major levels as ETH came to less than 10% of the 1.414 level. But if Dash is anywhere near close to target in a year or so I will be a very happy man.
One reason why I do like fib channels is it called the Eth high perfectly. I might have to settle for mere 5k Dash before a major consolidation. A mere 30x from here.
Closing Thoughts
This charting reflects a lot of my trading style and personality. I am sure they new coins out there that may have more upside than Dash and that are moving a lot faster but as I get further along in my trading and active investing I want something with more history against both itself and major alts. All the general disclaimers of this not being trading advice and myself not being a advisor apply.

NZDJPY Sell Idea Update!!!My idea here was to look for pullback and sells until both the key resistance zones hold.
The price action followed my analysis exactly as I expected it to here. The pullback that I was looking for happened, most importantly the price was holding below the key resistance zones. The price then moved lower as I expected it to and provided a nice move to the downside until it was blocked by a bullish divergence.
Original Idea

Bullish DIV on SRMFirst some FA: kraken announced SOL and SRM will be listed on 17th of June so this should push the price up.
As you can see there's a clear bullish DIV (the div is on CCI as well) and there's a compression on BB indicating something is about to happen. Considering the recent maket dump combined with the bullish DIV I think this should go up.
At 4h timeframe VLPR (not shown) mark current price around the control like, in this case buys and sells are almost the same. It's a decision point, I think it'll go up, you can buy now and set a tight stop loss.

Bullish Bat on weekly. Follow-up to a previous short trade.Back in February I posted a Short Setup who's target was the PCZ of this Weekly Bullish Bat. 4 months later we have finally reached our weekly target and now with some of the profits made from the short it's time to flip long.
For context on the original trade setup check the related Ideas section.

Drop and PopNot enough fear in the market. Social media analysts are looking at every blip as a pump signal back to 50k. Greed has overridden minds. The deep drop would capitulate the entire market creating a fresh start for the next move up. all imo.

U.S dollar/ Brent Crude Oil 1W. Golden cross about to happen, and trend line broken. I'm optimistic about what happens from here. Bullish

Restaurant Brands Breakout Based on technical analysis, I see Restaurant Brands breaking through resistance which is the red cloud above the candles.
Heres why I believe this,
Double Buy signal on the Guth 3x confirm which is highly accurate
Growing bullish divergence as indicated by the MACD and D+ ( green shadow below candles representing growing bull strength )
Daily volume is low meaning the selling of should be nearing and end initiating a bull cycle as investors buy this low
Comment your thoughts below & like if you see this happening

4H Double Bottom Territorythis is what we need to get the momentum rolling towards the EMA and Triangle Top Confluence

How to analyse Divergences using RSI for BTCUSDThis tutorial on RSI Divergences is the second part of a RSI Masterclass series.
We have already discussed how to make use of the basic RSI indicator in our previous masterclass tutorial. We will understand the use of Divergence oscillators in short timeframes for BTCUSD.
A divergence happens when the price of an asset (BTC in this case) moves in the opposite direction to a momentum indicator or oscillator.
It is the opposite of a confirmation signal, which is when the indicator and price are moving in the same direction.
How to use Divergence in trading
A divergence is often seen as a sign that the current market action is losing its momentum and weakening, meaning it could soon change direction.
there is a significant chance of a price retracement
Bullish Divergence
A bullish divergence is the pattern that occurs when the price falls to lower lows, while the technical indicator reaches higher lows.
After a bullish divergence pattern, it is common to see a rapid price increase.
Bearish Divergence
A bearish divergence is the pattern that occurs when the price reaches higher highs, while the technical indicator makes lower highs.
There is a likelihood of a rapid decline in price following the divergence
Please note:
One of the most common problems with divergences is ‘false positives’, which is when the divergence occurs but there is no reversal.
The technique does not give a set price point at which to open or close a trade, just an indication of the strength or weakness of the underlying market sentiment.
-------------------------------------------------------------------------------------------------------------------------------------------------------------------
If you find the analysis useful, please like and share our ideas with the community as well as follow to stay updated with new ideas!
- Mudrex

Bitcoin Falling Wedge - Bullish divergence - LongBitcoin is currently on the edge of breaking out of a falling wedge. at the same time there is also a bullish divergence.

BTC - BULLISH DIV on the 4hrThink this is officialy the bottom.
Capitulation has already happen 2 days ago.
Now we see a bullish div on the 4hr.
Send it back:)

Weekly Falling Wedge Breakout may lead to a Trend Reversal We have triple MACD Bullish Divergence on the weekly and a breakout of a falling wedge. We will likely breakout and retrace back up near the 50 percent retracement area at around 10 dollars.

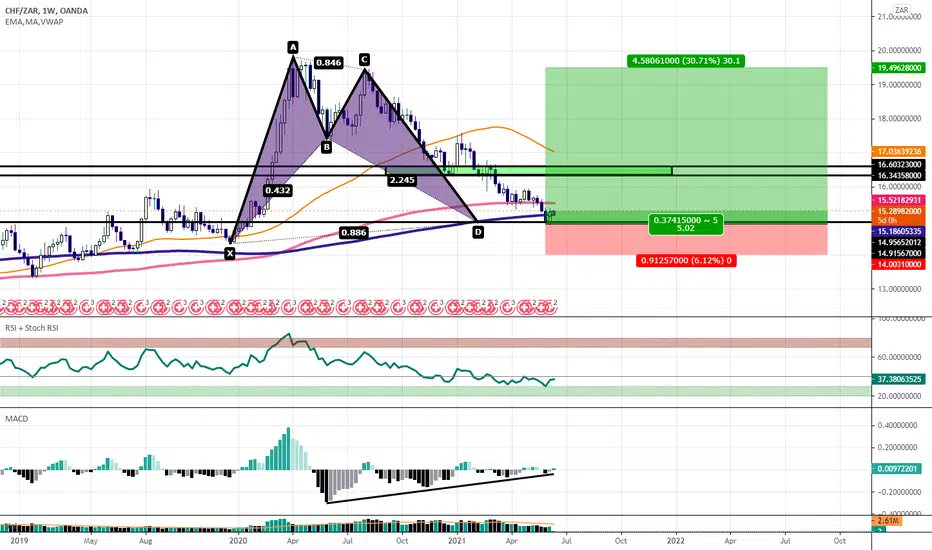
Tweezer Bottom Bullish Reversal at the 0.886 Retracement.The is literally the final ground the USD has to stand on: Hold the 0.886 and you're off to test much higher prices once again.
Tweezer Bottom with Bullish Divergence on both MACD and RSI at the .886 along the bottom of a Falling Wedge at the PCZ of a Bullish Shark.

Bullish Update for BEST Inc SetupA few weeks ago i posted a Bullish Crab setup for BEST INC and while the price did briefly dip below the PCZ, the price never got near our stoploss and is now well above our PCZ.
BEST will be releasing earnings within the coming weeks and i expect it to have major gains leading to and after earnings.
As of today i have discovered that not only did BEST have a bullish crab on the daily, it also has created this long term weekly and monthly channel that it's at the bottom of with lots of bullish divergence on the RSI.
For more context on the original Bullish Crab idea refer to the idea located on the related ideas tab below.

BTC Trend ReversalBTC is repeating a pattern from the middle of April. That pattern is a Bullish Divergence (which you can read about here )
Since the last time this pattern occurred, BTC remained in a small uptrend for about 16 days.
Is now the the reversal that is going to start the inevitable run to 100k for BTC? Who knows.
But it does look like BTC can at least bounce back up 17% into the high 50,000s and possibly to 60k.
Please comment, like, and follow for more!
Trade at your own risk

