Quick Look - Bullish Divergence vs Bearish DivergenceHere is a graphical representation of the simple concept of bullish and bearish divergences.
Rules are pretty clear
Bearish Divergence
Happens only in uptrend
Observed on pivot Highs
Price makes higher high whereas oscillator makes lower high, indicating weakness and possible reversal
Bullish Divergence
Happens only in downtrend
Observed on pivot Lows
Price makes lower low whereas oscillator makes higher low, indicating weakness and possible reversal
Watch out for hidden divergences on the opposite pivots and breakouts in the direction of trend.
Bullish Divergence

$VFF: Log Scale Bullish Shark Visible on the MonthlyWe've got an 0.886 Bullish Shark visible on the Monthly Log Scale Chart with heavy amounts of MACD Bullish Divergence, if we can reach the minimum Bullish Shark targets, then we should expect to see VFF reach 5 dollars in the coming months.

XAUUSDXAUUSD has formed falling wedge pattern at strong support zone with significant bullish divergence.
It seems like gold is getting ready for serious upward direction.
Will the buyers attack these bullish territories?
What you guys think of it ?

NEOUSDTNEOUSDT is trading in bearish trend and recently it has formed double bottom pattern with strong bullish divergence.
price is fading selling pressure after double bottom pattern seems like bulls will take control from here.
If the price is successfully close above 8.5 level, it will be time for bulls to take control.
What you guys think of it ?

NAS100NAS100 has completed Bullish bat pattern at very strong support zone with bullish divergence as well. If we put all these confluences together ,Then NAS100 is must due for strong bullish correction.
What you guys think of it ?

TRXUSDTTRXUSDT has completed AB=CD pattern and form support zone. Currently the support zone is being sustained with strong bullish divergence. but price is still below the long term declining trendline. If the price gives healthy closing above falling trendline, it will be a nice buying setup.

ARBUSDTARBUSDT is trading at very important zone. Although the pair is in bearish channel but selling pressure is not favorable as there is strong bullish divergence at support zone. In past bulls took charge from this support zone. Will bulls again attack on this level?

EURUSDEURUSD is in nice bullish trend. Recently the price has retraced a bit and reached to our buy area which is also the region of inclining trendline. Bullish divergence is also suggesting a upward direction for pair.

EURCHFEURCHF has formed a falling wedge pattern with strong bullish divergence. As the price has already shown the good bullish reaction from this level. Will the price continue to grow higher ?

SIRI | Great Long Entry | LONGSirius XM Holdings Inc., an audio entertainment company, operates audio business including subscription entertainment services in the United States. It operates through Sirius XM, and Pandora and Off-platform segment. The company's Sirius XM segment provides music, sports, entertainment, comedy, news, traffic and weather channels, and other content, as well as podcast and infotainment services on subscription fee basis; and live, curated, and exclusive and on demand programming services through satellite radio system and streamed via applications for mobile and home devices, and other consumer electronic equipment. Its Pandora and Off-platform segment operates music and podcast streaming platform, which offers personalized experience for listener through computers, tablets, mobile devices, vehicle speakers, and connected devices. In addition, the company offers podcasts including true crime to politics, sports, comedy, and other podcasts under Stitcher brand. Further, it distributes satellite radios through automakers and retailers, as well as its website. The company also provides location-based services through two-way wireless connectivity, including safety, security, convenience, remote vehicles diagnostic, maintenance and data, and stolen or parked vehicle locator services. Additionally, it offers satellite television services, which offer music channels on the DISH Network satellite television service as a programming package; Travel Link, a suite of data services that include graphical weather, fuel prices, sports schedule and scores, and movie listings; and real-time traffic and weather services, as well as music programming and commercial-free music services for commercial, office, restaurants, and other business. The company was incorporated in 2013 and is headquartered in New York. Sirius XM Holdings Inc. is a subsidiary of Liberty Media Corporation.

Can CMG recover from the post earnings drop?CMG had earnings today which were a beat but apparently less than expectations
of investors and traders. On the 15-minute chart, the indicators support a reversal
with a bounce on the dual time frame RS lines showing a bit of bullish divergence.
Decelerating bearish momentum on the MACD with lines converging under the histogram
suggests a reversal is impending. Further, the mass index indicator is in the reversal
zone but not yet triggering the signal with a drop below the zone. I will take a
long trade of CMG. They say trade what you know, My local CMG is always buzy and
a love either food. I believe that CMG is ready to give me a big rebate on my
patronage. I will take a call option expiring 8/18 striking $2100. I expect to realize
a large profit having done a similar trade on CMG more than once in the past. The expected
premium of $7300 will be about $700 of risk given a stop =loss but I expect a reward
of 4-6 times that if not more.

XVGUSDTXVGUSDT is in under strong sell pressure and has created strong demand zone with bullish divergence. These confluences giving the strong buy setup signals. What you guys think of it ?

GBPUSD ALERT: BULLISH DIVERGENCE DETECTED! 🚨📈💡 GBPUSD ALERT: BULLISH DIVERGENCE DETECTED! 📈🚀
🔍 What we've discovered during our examination: 🔍
📈 Bullish Divergence: Despite the prevailing bearish trend, we've identified a bullish divergence forming on the GBPUSD 1-hour chart. This could be a sign of a potential trend reversal! 📉🔄📈
📈 Relative Strength Index (RSI): The moment indicator RSI is backing this bullish divergence signal, suggesting a possible upward momentum in the near future! 📊🚀
🚨 Trading Alert: 🚨
📌 Time Frame: 1 Hour ⏰
📌 Pair: GBPUSD 🇬🇧💱🇺🇸
📣 Our analysis indicates a potential bullish move for GBPUSD, but a word of caution before you hit that trade button: 🛑⚠️
🚫 Trading always involves risk, and even though the indicators look promising, it's essential to consider your risk tolerance and use proper risk management strategies. 💼🛡️
💡 Trading Tip: 💡
📌 Wait for Confirmation: It's crucial to wait for additional confirming signals before entering any trade. Always look for supporting evidence to strengthen your trade decision. 🕵️♂️🔍
📌 Set Stop-Loss: Protect your capital! Always set a stop-loss order to limit potential losses in case the trade doesn't go as planned. 🛡️💰
📌 Stay Informed: Keep an eye on market news and events, as they can impact the forex market. Stay updated to make informed decisions! 📰🌍
Remember, the market can be unpredictable, so never risk more than you can afford to lose! 🙅♂️💸 Trade responsibly and smartly! 🧠💪
Happy trading! 🚀📊💹
#Forex #GBPUSD #BullishDivergence #TradingAlert #TradeResponsibly

NZDCADNZDCAD is trading in downward direction but currently the pair has created strong demand zone around 0.8160 region and reacted well from this region. Currently the pair is facing mild resistance in 0.8190 region . if it break through 0.8190 it will a nice buy setup.

NZDCHFNZDCHF is trading in bearish parallel channel. Currently the pair is trading at the channel lows and also form falling wedge pattern with in the channel. As it has also created bullish divergence which indicating it might touch the channel highs again.

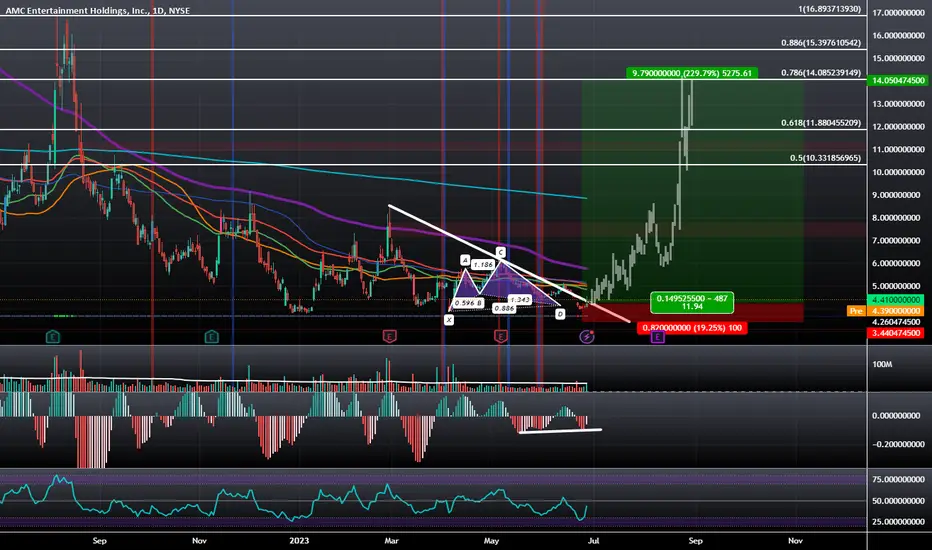
AMC: Bullish Dragon Seeking BreakoutAMC, after Bullishly Diverging at an .886 has broken out of a Bullish Dragon and could rise all the way up to the zone of $10–$14 if the level of $4.40 is taken.
📈 Bullish Divergence & Support Zone Entry 🚀📊 The Relative Strength Index (RSI) is showing a bullish divergence, indicating potential price reversal.
💪 The price is currently in the support area, optimal entry point for the trade.
⛔️ Place stop loss below support area to avoid fake-out.
🎯 Take profit below resistance area for a 1:2 risk/reward ratio.
#TradingView #TechnicalAnalysis #BullishDivergence #SupportAndResistance #TradeSmart #TradingStrategies #StockMarket #Forex #CryptoTrading #Bitcoin #BTC #InvestingTips #TradeSignals #FinancialMarkets #MarketAnalysis #PriceAction #TraderCommunity #Charting #RSI #TradeSetup #ProfitPotential #Cryptocurrency #BitcoinAnalysis #BitcoinTrading #CryptoInvestor #CryptoSignals #DigitalAssets #Altcoins #BlockchainOpportunity

ETH Ready for Another Leg UpThere is 3 day hidden bullish divergence on Ethereum. Currently holding above the POC of a value range scaled from the 880 low to the all time high. This level also just happens to be a shallow common 23% retrace area that ETH has held nicely above since June. If this divergence is to playout, I like 2403 as the first main target which would be +30% move to the upside.

EURNZD (Euro / New Zealand Dollar) Currencies Analysis 30/03/21Bullish Divergence with MACD and Break above the Bearish Trend line are the evidences of trend reversal
we can target the Fibonacci Projection Parallels legs and Extension levels
we may hove some retracement along the Move up which is very normal for a healthy uptrend

The S&P Volatility Index is Set to Spike up to over $50There is a Bullish Gartley visible on the Log Scale chart that is currently giving us a Potential Double Bottom at the 0.786 PCZ with Bullish Divergence on both the RSI and MACD and if it plays out, I think it could spike all the way up to around $55 before coming back down and continuing to the historical lows.

DXY RSI Bullish Divergence at Bullish Butterfly PCZFrom the looks of it, DXY will try to hold the 1.414 Butterfly PCZ and make its way up towards previous Resistance. I don't think DXY will Break the Resistance, but it does look like there is a good case to be made for DXY coming back up to challenge those levels.

AUDCHFAUDCHF trading in long term bearish market. Currently the pair has formed wedge pattern along with strong bullish divergence, which indicating the pair's trajectory is about to turn.

GALA Daily Bullish DivergenceGALA/USD is sitting at a deep 88% retrace currently and if can begin to take out previous local highs around 0.026, that could give it the juice it needs to see the daily bullish divergence on the MACD play out.
If so, a target of 0.042 near the value area high of the volume range I have shown would be in the cards.
A stop loss would be just below 0.018.
