#REN : Upto 75% Profits Opportunity In The Mid Term.#Accumulation_Recommendation
Pair : #REN / #BTC
Technical Analysis
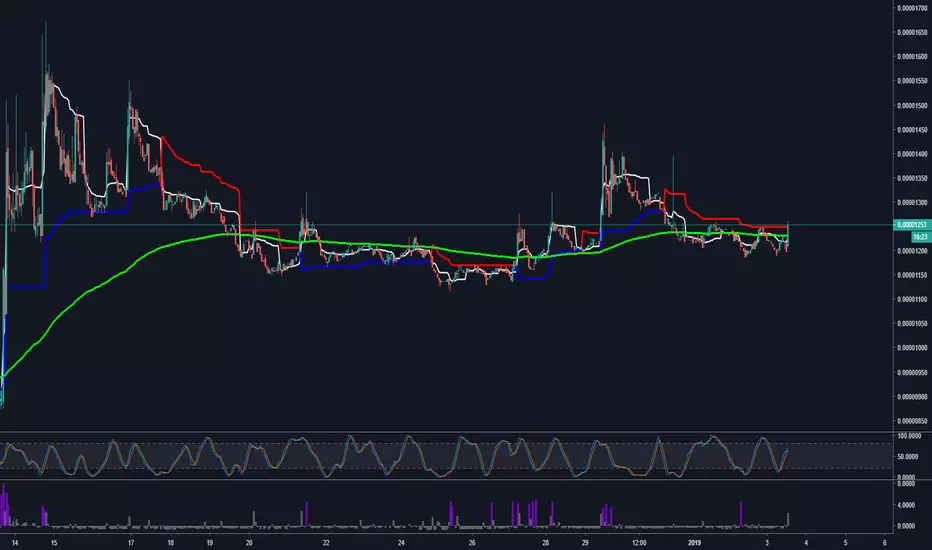
Pattern Creation : On the daily time frame of REN and BTC pair on Binance we have seen that a creation of a bullish engulfing candle stick with a good shape of a falling wedge. It is still trying to break out from the falling wedge and can't be considered as a confirmed call unless we see a close above the resistance line of the triangle.
Indications :
Volume showed a very good amount of increase on the yesterday candle but is currently showing a slow and decreasing volume level on today's scenario. This might be taken as an indication for a false pump if the trading volume continues to decline further by the following days.
- RSI looking good and on favor of the bulls but we still need a cross over by the MACD lines and seems to be on the way though. EMA is still above the current price at around 877 sats and need to go further downward below the price for a confirmed call.
Note : For a confirmed and confident trading move we need to break the price level represented by the red circle on the chart. And Volume needs to continue to be flood in for a more bullish trend too.
Even though its looks a risky trade at the moment, using a strict stop loss and risk management we can have a good profit for the mid term.
Accumulation Price Area : 790 sats - 820 sats
Distribution Targets
Target 1 : 872 sats
Target 2 : 920 sats
Target 3 : 973 sats
Target 4 : 1055 sats
Mid Term Targets
Target 5 : 1137 sats
Target 6 : 1202 sats
Target 7 : 1254 sats
Target 8 : 1402 sats+
Stop Loss : 681 sats
Capital Accumulation : 3%
Risk : High
@Togetherweaccumulate
Bullish Engulfing


btc closes weekly candle as a bullish engulfing candle!time to buckle up and enjoy the ride! We have currently retested the double bottom neckline and should confirm a daily higher high on the next 1 day candle...that along with the 3 day golden cross and the weekly closing as a bullish engulfing candle means there are bull signs everywhere! There still a slight possibility on this first attempt to trigger the double bottom that bearwhales could still dump us back down even all the way to 8.5k or even 7.2k on a fakeout...but as long as we achieve the higher high on the daily which I strongly believe we will....we could do a fakeout and dump here and still very easily rebound around that zone and still trigger the double bottom. I'm not relying on or waiting for a dump like that to occur but will have a little bit of fiat ready to buy a dip like that should the opportunity arise.

#XVG : Up to 300% Profits Opportunities For The Mid Term.#Accumulation_Recomendation
#XVG / #BTC
Accumulation Area : 63 sats - 66 sats
Distribution Areas
Target 1 : 78 sats
Target 2 : 93 sats
Target 3 : 106 sats
Target 4 : 118 sats+
Stop Loss : 55 sats

GROW Double BottomDowntrend over last few weeks may be over as todays bullish engulfing shows signs of reversal. Watch for break of 0.35 to confirm bull break from falling wedge. Close above 0.35 would also be a hammer on the weekly chart. Good buy right now with strong support at 0.30, price target at recent tops of 0.51, potentially higher with any good news releases.
Upcoming catalysts include new contract signings, approval for use of technology on cannabis and more agro-industrial partnerships.

If wedge breaks up on current 4hr candle target= 11.9kI was anticipating we would break out of the wedge slightly lower here bu considering the previous 4hr candle closed as a bullish engulfing candle we could close the current one above the wedge and maybe even break here...if no I anticipate the 9924 horizontal will be the zone we break up from. I still think its quite likely we will be retesting the 1 day 50ma again before the larger 1 day and weekly consolidation is through.

Bitcoin Weekly : Still High Probability To Test The 10K level.#Bitcoin_Update #Weekly
Each Bullish Engulfing candlesticks formations since the beginning of 2019 was followed by yearly highs. Still Bitcoin's market indications showing a possible upward trend continuation to the next strong resistance at $9800 and $10000 for the shorter term. Inbox us for more discussions and subscriptions.
Drop your likes if you agree or your comments if you disagree.
With Regards.

EURCHF is bouncing from the lower end of a large rangeOANDA:EURCHF
FX:EURCHF
FOREXCOM:EURCHF
SAXO:EURCHF
EURCHF is bouncing from the lower end of a large range.
Price action has remained above the large support band between 1.1106 to 1.1200 on the weekly chart. The bullish hammer candle that was posted on the week ending 7th June 2019 suggests that buyers could return in the short term.
The daily chart displays a large range and if the buying continues to the close this evening, a bullish engulfing candle will form today.
The intraday chart (4H) appears close to completing a flag pattern, which suggest continuation of the short term trend.
Here is our recommendation today: We look to Buy a break of 1.1220.
Price action is forming a bullish flag which has a bias to break to the upside.
Price action has posted a bullish Engulfing Candle and is positive for short-term sentiment.
Further upside is expected, however, due to the strong resistance above we prefer to buy a break of 1.1220, which will confirm the bullish sentiment.
Target 1 at 1.1280.
Target 2 at 1.1340.
Stop loss at 1.1185.
For FREE technical analysis , trade ideas, Ask the Analyst feature and much more, sign up to Signal Centre HERE

Simple candlestick analysis on the btcusd weekly chartSimply put, our weekly candle just closed as a bullish engulfing candle...that means that it covers the entire previous weekly red candle and more. This is almost always a very reliable sign of incoming bullish action and I would think even more so on the weekly timeframe. I'm most certainly bullish and think 9.6k-10k before our first real 31-41% correction is likely...however at this point we could even visit 11,12, or even 13k before the big correction..hard to tell...I do hear talk of a gap on the CME chart at around 8500 however and we all know gaps always get filled, so whenever we have our big correction we will likely revisit 8.5k if we don't do a bear trap before then to fill the gap. Anyways, in summation: Bullish engulfing candle on the weekly chart? Should be an easy long....lets see if it pans out.

Bullish Deep Crab USDJPYAll reasons are on the chart.
Double bottom not confirmed yet.
Good luck all.

Bullish Divergence+Bullish Engulfing $waves. Waves gonna waves?After it broke the falling resistance, waves creating a bullish candle on latest daily chart; bullish engulfing. this is simple impulse waves possibly created. with very good trend on the other small cap altcoin, can waves will be the next catalyst?


TWTR - Big CandleTrading off the big candle. TWTR looking super strong. Trade above, trade above, HL's and HH's. Stop = $37.75 Target 20% In @ $40.16 with 0.2% capital at risk.
Bias: TWTR's mgmt does not seem to make the same blunders as both FB and Youtube.

NZDCHF 4H LongAscending trend line coincides with key level. 4H bullish engulf formed on strong support. Good chance for a long here. All the best!


Week 9 Trade 1 GA LongReasons for entry:
- Price is currently on a uptrend
- Price has rejected and retested the 61.8 fib
- Possible hammer candlestick forming on the 4hr, weak hammer candlestick already formed on the 2hr
- Strong bullish engulfing on the 30min timeframe
Entry Timeframe:
- 30 min bullish engulfing
- @1.8240
Stop Loss:
@1.8200 (-40pips)
Take Profit:
- Target 1 @1.8400 (+160pips) = Risk/Reward : 1:4.1
- Target 2 @1.8550 (+310pips) = Risk/Reward : 1:7.9
Notes:
-

But no one's looking! WANBTC double bottom?!Recently Wanchain has fallen out of the Top 100 on CMC, some people may never check page 2...not everyone is as saavy as you! (HINT: This is in our favor)
On the Daily Time-frame for BINANCE:WANBTC there's a huge bullish engulfing candle with massive volume found inside yellow ellipse.
Then we find it retraces back to, holds and bounces from that same close/open...Double Bottom possibility.
This entry looks like a dream come true, but will it make dreams come true?
Stack IT, Flip IT and Reverse IT

Week 6 Trade 2 GJ LongReasons for entry:
- Price has made a new higher high & higher low
- Price broke above and retested 143.15
- Price has rejected the 4hr 61.8% fib
Entry Timeframe:
- 1hr bullish engulfing @143.36
-
Stop Loss:
@143.60 (-6pips)
Take Profit:
Target 1 @144.75 (+139pips) = Risk/Reward : 1:23.2
Target 2 @146.00 (+264pips) = Risk/Reward : 1:44
Notes:
- I have a very tight SL because it is still possible for price to make a more agressive pullback before forming new highs and having a tight SL would allow me to re-enter at a better price point

COPPER time to buy? Bull-Steam Ahead! COPPER: After major lows were taken out finding liquidity, it opened up the gates for the bulls to charge ahead. Major bullish engulfing on the daily showcases the immense amount of bullish strength currently for Copper. Expecting Copper to at least re-test the top of the range and even break higher. At these prices Copper seems to be at quite the discount. Definitely not a time to be selling. Look for corrections on smaller time frames to go long.
Hope that helps :)
Trade with care folks!
~Price Action Nation

COPPER time to go long. Bull-steam ahead!After major lows were taken out finding liquidity, it opened up the gates for the bulls to charge ahead. Major bullish engulfing on the daily showcases the immense amount of bullish strength currently for Copper. Expecting Copper to at least re-test the top of the range and even break higher. At these prices Copper seems to be at quite the discount. Definitely not a time to be selling. Look for corrections on smaller time frames to go long.
Hope that helps :)
Trade with care folks!
~Price Action Nation

$SYSBTC Syscoin Short Term Long Channel Bounce 1 Hour Time FrameWatching a short-term 1 hour bullish engulfing candle bounce play off of support. I'm long at current level and looking for price targets at or above the 1460 satoshi area. Don't fall in love with her just trade the bitch! Viva La Crypto!
Bitcoin Weekly Bullish Engulfing - What Does This Mean?Yesterday Bitcoin closed the week with a bullish engulfing candle. A bullish engulfing is where the green candle is much larger than the previous red candle.
As you can see in the chart, 5 out of 6 bullish engulfing candles meant other green candles to follow on the weekly chart.
It also helps that Bitcoin has experienced sideways price action for the last few weeks, which adds to the probability of a trend change. Also as shown in my previous charts, the momentum has been changing in favor of the bulls.
The bad news is, Bitcoin is currently facing major resistance at 7,800 so the bullish engulfing candle was certainly needed to help Bitcoin over come this resistance. Not only has Bitcoin failed at surpassing 7,800 in early June, there is also a major trendline that stems from March that is suppressing the price.
If Bitcoin is able to pass this resistance, then the next resistance line is 8,200. If Bitcoin can pass this level, which I believe would be easier than passing 7,800, then I believe a retest of $10k seems likely.

GBPUSD BULLISH 2019Today, European President Draghi was due to testify about the economy and monetary policy before the European Parliament Economic and Monetary Affairs Committee, in Brussels. To sum up what he said in his speech, he clearly stated that the European economy is stabilizing from its draw-down in the 2007-2008 financial crisis. This is why we have been seeing the economy struggling to get back in the past 10 years. As a position trader, I'd like to see this kind of news and although it is not the GBP currency we are talking about here, it is still inter-related to the EURUSD. My technicals point towards a bullish engulfing breakout from 1.2870 resistance on November 22, 2018. I like to buy the dips so I am already in longs. My short term target will be 160+ pips to 1.2900 resistance and my intermediate target around 1.3200 resistance.
