6month log chart on xrpusd suggests crazy potential targetsThe bull pennant we are in shown here on the 6month time frame seems to have a symmetrical triangle for its flag. The breakout target for just the symmetrical triangle is in the $33 range. Factor in the pole of the flag and the potential target skyrockets to 1.2k. Definitely not financial advice and certainly no guarantee it will hit either target as it’s still up in the air if log chart targets reach their full target as reliably as linear chart patterns do. Even if it does hit these targets you can see the apex of the pennant in its current trendline trajectories doesn’t occur until 2026. The only way I see price remaining inside this triangle for that long is indeed if the SEC ripple case is extended through appeal and taken to the Supreme Court. Hopefully not but it isnt impossible. If this were to occur I would simply keep dollar cost average accumulating until it was to break out from the triangle which would give me more opportunity to take some profit at the first target but then also hold onto some of the asset in case it does indeed reach the full bullflag breakout somehow all the way up at 1.2k. Simply posting this hear so I can see how well price action chooses to follow this pattern over the next year or few. Once again *not financial advice*
Bullish Flag

TSLA ULLISH JULY 18 2025Tsla is lloling extremely bullish technically. If it stops me out ,il exit but my my targets from here would be $390.
Always put a SL & decide a target before your entry

Anand Rathi in BULLISH FLAG What more to explain about the beauty of the Ch(art)
- P Senthil Kumar
Chart Lover

Weekly/monthly bullflag on xrpusdAn even higher target than the symmetrical triangles two potential targets materializes when we confirm the breakout up from this bull flag. It will likely have a bullish target somewhere around $5.20. Upon reaching this target it will also be breaking above a big cup and handle that will then have an even higher breakout target which I will post in my next idea *not financial advice*

SOL / ETH at Critical Inflection PointSOL / ETH loses the 50WMA.
Has been trading below it for the past 7 weeks, something we haven't seen since 2021.
Has also broken down from the 8 month bull flag / parallel channel. Retesting the key POI I've been eyeing.
HOPIUM: We've seen great rallies after CRYPTOCAP:SOL goes down ~40% vs CRYPTOCAP:ETH , which it is at now. We SHOULD see a turnaround here soon.
And I still believe SOL will greatly outperform ETH this cycle, especially when the ETF launches and Alt Season kickstarts.
Right now we're seeing a typical market cycle BTC > ETH > Large Caps > Mid Caps > Micro Caps

EUR/USD Bullish Continuation SetupMarket Structure Overview:
The market remains in a clear higher timeframe bullish trend, consistently forming higher highs and higher lows. Recently, price has entered a descending channel, resembling a bull flag formation — a classic continuation pattern that typically precedes a strong bullish breakout.
Key Observations:
✅ Descending Channel (Bull Flag): Price is respecting a downward-sloping channel while remaining above key demand zones.
💧 Liquidity Pools: Multiple liquidity highs have been left untouched above — suggesting fuel for a potential impulsive move upward.
🧹 Liquidity Sweep: On both H4 and H1, we see a clear sweep of previous equal lows, tapping into a significant demand zone.
📈 Reaction from Demand: Strong reaction from the demand zone suggests institutional buying interest.
🔵 Projection: A bullish breakout from the flag could target the liquidity above 1.1800, with immediate resistance near 1.1740–1.1760.
Bias:
🔼 Bullish — as long as price holds above the most recent demand zone (~1.1649), the bias remains bullish with expectations of a breakout and continuation toward previous highs.
Note: We must see how the market opens on Sunday night going into Monday. Based on the initial price action, we can determine the best trading opportunities and direction for the upcoming week.

Weekly timeframe version of previous HBARUSD postWanted to show my previous hbar idea which was on the daily time frame on the weekly as well so I could fit the pole of the bullflag in the frame here. I will put a link below to my daily time frame version of this post which goes into slight more detail about each pattern and also the Nvidia hbar news. *not financial advice*

HBARUSD has 3 bullish patterns stacked on top of eachotherThe inverse head and shoulders in the light blue, the light tan is the bull flag, and the pink is the double bottom. Currently price is above the Bullflag and the Inverse head and shoulders pattern. The bullflag also counts as a descending channel pattern as well. We just recently retested the neckline of the inverse head and shoulders as exact wick support which is a good sign. All 3 should provide eachother with the bullish confluence needed for them to be validated, but in addition to this technical bullishness we have some fundamental bullishness occurring just recently too as NVIDIA just announced their new Blackwell chips — claiming them to be the future backbone of AI infrastructure — which are integrating verifiable compute which has its fundamental trust layer built on Hedera. This also provides great bullish confluence and heightens the probability these 3 chart patterns will all be validated and reach their full targets. I will keep updating this post as they do so. *not financial advice*

#BTCEUR #1D (Binance) Bull-flag breakout and retestBitcoin looks very good for bullish continuation after regaining 50MA support on daily, against the Euro.
⚡️⚡️ #BTC/EUR ⚡️⚡️
Exchanges: Binance
Signal Type: Regular (Long)
Amount: 12.0%
Entry Targets:
1) 93017.86
Take-Profit Targets:
1) 108422.28
Stop Targets:
1) 85296.36
Published By: @Zblaba
CRYPTOCAP:BTC BINANCE:BTCEUR #Bitcoin #PoW bitcoin.org
Risk/Reward= 1:2.0
Expected Profit= +16.6%
Possible Loss= -8.3%
Estimated Gaintime= 1-2 months

$BTC Tapping ATH - Is this REAL!?YUUUGE Daily Close today for CRYPTOCAP:BTC
Bullish cross on the 20/50MA.
Appears to have broken out of a bull flag.
Need PA to stay within this POI in order to confirm another leg up.

XRP is ready ?XRP has been consolidating since last high from Jan this year. MACD shows that the momentum is picking up and I see it is ready for next move.
A weekly close will confirm it.

Bullish Flag Pattern.
Bullish Flag Pattern.
Crossing 435 with Heavy volumes will
trigger more positivity & will expose
New Highs targeting 700+
On flip side, breaking 300 now, will
bring more selling pressure.

Bitcoin - Bullflag formation towards $111k?After the long and steep rally in Bitcoin that began on April 9th, the price is now entering a period of consolidation and forming a classic bullish continuation pattern known as a bull flag. This type of structure often appears after a strong impulsive move to the upside and signals that the market may be gearing up for another leg higher.
Bull Flag
On the daily timeframe, BTC is in the process of developing a bull flag by printing a series of lower highs and lower lows within a narrow descending channel. This pullback phase comes after a significant rally and is generally considered a healthy part of a trending market. It reflects a cooling-off period in which the market digests the prior gains while maintaining a bullish bias. This type of structure typically resolves to the upside, continuing the dominant trend. At present, BTC is approaching a key upper boundary of the flag formation, which also aligns with a prior zone of price rejection. This area could act as resistance in the short term and will likely play a crucial role in determining the next directional move.
4H Fair Value Gap
Zooming in on the 4-hour chart, we can observe a clearly defined fair value gap (FVG) between the $102,700 and $103,800 levels. This imbalance was created during the sharp move up and now represents a potential area of interest for buyers. If price retraces into this zone, it could act as strong support where demand steps in, filling the imbalance and potentially triggering the next upward leg. Fair value gaps often serve as magnet zones in trending markets, and in this case, could offer a key entry point for those looking to position long within the larger bullish structure.
Liquidity Levels
One of the more critical areas to watch lies around the $111,000 level, where we see a double top on the lower timeframes. This region holds a significant amount of resting liquidity just above it, as evidenced by the liquidation heatmap. These clustered stop-loss orders and leveraged positions create a liquidity pool that could attract market makers and large players looking to trigger a stop run. As price approaches this level, it becomes increasingly likely that the market may spike into this liquidity before deciding on a longer-term direction. This liquidity zone acts like a magnet and is a common target for short-term wicks and fake-out moves.
Expectations
The current expectation is for Bitcoin to push higher toward the $111,000 level before the market makes a more definitive move. While this upside continuation seems likely in the short term, caution is warranted, especially considering the structure on higher timeframes. The weekly chart is starting to show some signs of exhaustion, with momentum slowing and potential bearish divergence forming. As such, the move to $111,000 could simply be a liquidity grab—a final push to trap breakout traders—before a deeper correction or reversal unfolds. If price does manage to break the all-time high with convincing volume and sustained follow-through, the bullish case would strengthen significantly. Until then, however, it’s important to remain cautious and recognize the risk of a fake-out at these elevated levels.
Conclusion
Despite the strong rally in recent weeks, Bitcoin still faces substantial resistance overhead. The $111,000 level stands out as a critical zone that could act as a magnet, drawing in price action before reversing to the downside. This area is not only technically significant but also loaded with liquidity, increasing the risk of a bull trap. Traders should remain vigilant and avoid getting caught on the wrong side of the move. Watch closely for signs of exhaustion or divergence as price approaches this level, and be prepared for potential fake-outs designed to lure in overly aggressive participants. Staying patient and waiting for confirmation remains the most prudent strategy in this environment.
-------------------------------
Disclosure: I am part of Trade Nation's Influencer program and receive a monthly fee for using their TradingView charts in my analysis.
Thanks for your support.
- Make sure to follow me so you don't miss out on the next analysis!
- Drop a like and leave a comment!

BTC daily bull flag formationBTC is looking bullish on the daily chart in my opinion. One more pullback might be in order before we test new highs on the daily chart. The 100 sma has crossed over the 200 sma and the 50 sma is crossing the 21 sma. The rsi is neutral at time of publication. This bullish breakout could occur in late july after a pullback in the near term.
I think bitcoin is setting up to make another all time high push as summer draws on.
Not financial advice. Do your own DD.
Thanks for viewing the idea.
Comment what you think is going to happen over the course of this summer.

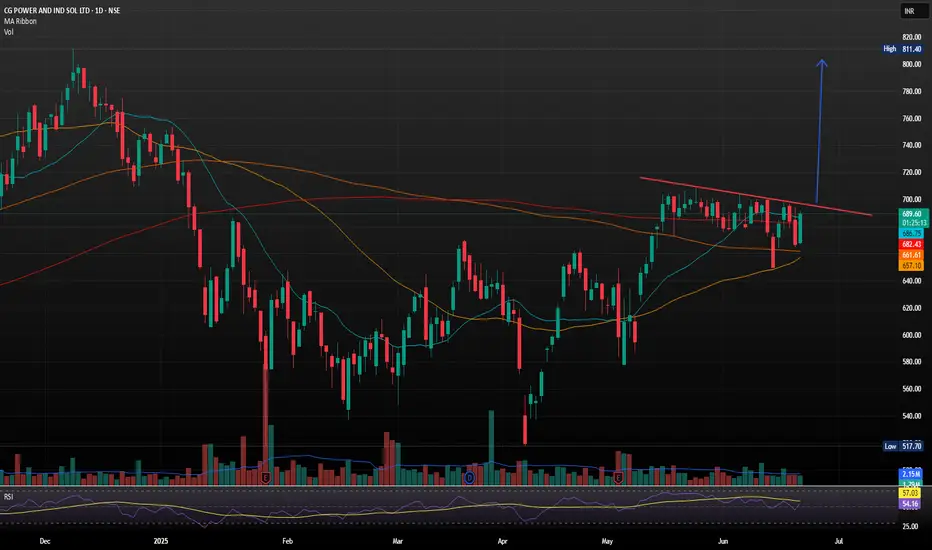
CG Power and Industrial Solutions with Strong Bullish Flag SetupCG Power and Industrial Solutions just landed its largest-ever single order a 641 crore contract from Power Grid Corporation of India Ltd (PGCIL) for high-voltage transformers and reactors
The company, now under the Murugappa Group, reported consolidated FY25 revenues of 9,909 crore. However, annual profit dipped to 972.98 crore from 1,427.61 crore in FY24, despite a strong Q4 showing with a 17% YoY rise in net profit to 274.26 crore.
- Inverse Head & Shoulders Breakout: The stock recently broke out of an inverse H&S pattern, a classic bullish reversal signal, with strong volume confirmation. Holding above 690 could push it toward 750 TO 800.
Support & Resistance Levels
- Support: 663–679 demand zone
- Resistance: 694, 704 and 712
Trend Summary
- Short-Term: Neutral to bullish
- Medium-Term: Bullish bias if it sustains above 690
- Volatility: Elevated, so expect sharp swings
Bitcoin - Breakout incoming towards $115k?Introduction
Bitcoin (BTC) has been consolidating just below a key resistance level over the past several days. This period of sideways movement, without any significant pullbacks, reflects notable strength in the market. Such price behavior often precedes a strong directional move, and in this case, the technical setup continues to favor the possibility of a bullish breakout.
1H BullFlag Pattern
On the 1-hour timeframe, BTC is forming a well-defined bull flag pattern, which is typically a bullish continuation signal. This flag began to develop after BTC surged from approximately $105,000 to $110,000, creating the flagpole that represents the initial wave of upward momentum.
Since that move, price has entered a consolidation phase, forming the flag portion of the pattern with declining volume and tighter price action. If BTC breaks out above the upper boundary of this flag, the measured move target projects a rally toward the $115,000 level. Reaching this target would represent a new all-time high for Bitcoin, signaling a continuation of the broader uptrend.
4H Fair Value Gap (FVG), Downside Scenario
Although the overall structure favors a bullish outcome, it is important to acknowledge the potential for a short-term retracement. On the 4-hour chart, there is a Fair Value Gap (FVG) between $105,700 and $106,800. If BTC fails to break out immediately, this zone becomes a logical area to monitor.
Price may revisit this imbalance to fill the gap left behind by the recent upward move. A dip into this area could present a strong opportunity for long entries, particularly if buyers step in with conviction. Filling this FVG would allow for a more balanced structure before BTC attempts a sustained move higher.
Conclusion
BTC continues to show impressive resilience as it consolidates near its prior highs. The presence of a bull flag on the lower timeframes, coupled with minimal downside volatility, suggests that a breakout above resistance is becoming increasingly likely.
However, reclaiming the previous all-time high remains a critical step before targeting the projected $115,000 level. How BTC reacts to that key resistance area will provide important insight into the strength of this rally.
At this stage, the bullish case remains the higher probability scenario, while any short-term pullback into the FVG zone could offer a healthy reset and a potential long setup for continuation toward new highs.
Thanks for your support.
- Make sure to follow me so you don't miss out on the next analysis!
- Drop a like and leave a comment!

Lemonade Inc.: Breakout in Motion — Cup, Flag, and No BrakesLemonade Inc. (LMND) is accelerating after a clean breakout from a textbook cup with handle pattern, where the handle formed as a tight bullish flag. The breakout occurred around $32, and since then, price action has been sharp, controlled, and uncorrected — currently trading at $42.42 with buyers clearly in charge.
On the fundamental side, LMND is moving through a recovery phase: operational losses are narrowing, revenue is stabilizing, and the company is aggressively leveraging AI to automate its insurance processes. Expansion into Europe continues, and institutional interest is visibly rising — confirmed by volume building alongside price. Within the insuretech sector, LMND is starting to look like a comeback story rather than a cautionary tale.
Technically, the setup remains strong:
– Golden Cross confirmed (EMA50 crossing EMA200)
– EMA50/100/200 all below price — bullish structure firmly intact
– Volume expanding on up-days — healthy confirmation
– RSI hovering in the 60–65 range — momentum is intact, no signs of exhaustion
Targets remain aligned with the structure:
– tp1 = $64 — measured move from the flag
– tp2 = $94 — full realization of the cup pattern
Tactically, this is no longer a “wait and see” setup — the move is in progress. No correction so far, only continuation. Momentum traders may consider entries into strength. Above $45, the move could accelerate further as more participants recognize the structure.
LMND is showing technical and fundamental alignment — confirmed breakout, improving narrative, and strong trend structure. While the impulse holds, this chart favors continuation, not hesitation.

PNUT/USDT – Bullish Breakout from Falling Channel!PNUT Breakout Alert – 200% Potential on the Table
Hey Traders — if you're into high-conviction setups with real momentum, this one’s for you.
PNUT has officially broken out of a textbook falling channel after a healthy consolidation. This pattern often signals trend reversal and renewed bullish momentum — and PNUT looks ready to move.
🔹 Pattern: Falling Channel
🔹 Breakout Confirmation: Clear candle close above resistance
🔹 Previous Move: +204% before entering the channel
🔹 Current Setup: Long entry with defined risk-to-reward
🔹 Target: ~0.85
🔹 Stop: Just below the breakout zone
🧠 Technical Perspective:
Volume uptick during breakout confirms buyer strength
Strong support retest zone around 0.28–0.29
Holding above this range could fuel a significant leg higher
📌 This setup offers a clean structure with a high R:R potential. PNUT has proven it can move fast — now it’s about following the breakout with tight risk management.
📥 Add to your watchlist and let price action lead the way.

TOST getting toastyTOST Technical Analysis (Breakout Setup):
Current Pattern: Bull flag forming after a strong breakout from the $40.50 zone with increasing volume.
Resistance: $44.33 – key level to break for momentum continuation.
Support levels:
$42.00 (top of previous consolidation zone)
$40.55 (bull flag base and breakout pivot)
Ideal Breakout Play:
Watch for breakout above the flag’s upper trendline, ideally clearing $44.33 with volume.
A daily close above $44.33 confirms continuation — target $47–48 short-term, with potential run to $50 psychological.
Invalidation:
Break below $40.55 on volume negates the setup, suggesting failed breakout.
Favorable Path:
Consolidate slightly → Break flag above $44.33 → Ride momentum to $47–48. Risk/reward favors long bias above $44.33.
💡 This is a textbook bull flag following a high-volume breakout — high probability if volume confirms the breakout.

GU Bulls Raise "Flag" Eyeing Higher PricesFX:GBPUSD has formed a Bull Flag and we could be getting ready to see the Bulls take the spotlight!
After Price broke through the Previous Level of Structure, Price retraces the High of 1.35589 to the 50% Fibonacci Level @ 1.35022 and is supported pushing Price back up from the Previous Level of Structure.
-The 50% retracement signals the end of the Consolidation Phase of the Pattern.
Now with a Bull Flag being a Continuation Pattern, we can suspect that Price will give us a Bullish Breakout of the Descending Channel and Retest before moving higher Confirming the Pattern and once the Breakout is Validated!
Based off the "Flagpole" of the Pattern, if a Bullish Breakout is Validated and the Retest is Successful, the extension of the Set-up would place the Price Target @ 1.3640 which is at the next big level of Resistance.

GOLD- BULL SIGN - BUY CALL - Bullish Flag patternMarket is making a Bullish Flag Pattern and it seems when breaksout with a Buy Stop order, it will move to its projected TPs

XAUUSD Bullish Flag Breakout – $4,300 Target in SightGold (XAU/USD) continues its strong bullish momentum in 2025, and the current price structure reveals a classic bullish flag pattern on the daily chart, suggesting further upside. This setup presents a potential continuation of the prevailing uptrend, possibly leading to new all-time highs in the coming months.
🟢 1. Clear Bullish Trend Foundation
Gold has been in a strong uptrend since late 2024, supported by:
Global inflationary pressures.
Geopolitical instability.
Central bank gold purchases and dollar weakness.
This uptrend is visually supported by a well-defined rising structure, with higher highs and higher lows.
📐 2. Bullish Flag Pattern Formation
The current price action has formed a bullish flag, a bullish continuation pattern that appears after a sharp rally. The flag represents a period of consolidation or pullback before the next impulsive move up.
The flagpole is the sharp rally that took place from mid-February to April 2025.
The flag itself is a downward-sloping channel or wedge, indicating temporary profit-taking or market indecision.
Volume typically decreases during the flag formation, then surges on breakout—confirming trend continuation.
This pattern is now showing signs of a breakout to the upside, suggesting the bulls are regaining control.
🔍 3. Key Technical Levels
🔹 Major Resistance Zone (~3,500–3,600):
This zone has acted as a supply region in the past.
Price is now testing this level and attempting a breakout.
A successful retest of this zone as new support will confirm the breakout.
🎯 Projected Target: $4,300+
Measured move target based on the flagpole’s height.
Clean projection points to the 4,300–4,350 area as the next major upside objective.
🛑 Support & Stop-Loss :
Strong support exists around $3,125, aligning with the flag base.
This area is a logical stop-loss zone for traders entering on the breakout.
🔁 4. Expected Price Behavior
Breakout: Price is expected to break above the flag resistance and the horizontal supply zone.
Retest Phase: A pullback toward the breakout zone (~3,600) could occur before the next impulsive move. This would offer a prime buy-on-dip opportunity.
Final Impulse: A sharp rally could follow, targeting the 4,300+ region.
💡 5. Trading Psychology Behind the Setup
During the flag formation, short-term traders take profit, and new buyers hesitate due to perceived overbought conditions.
However, the overall market sentiment remains bullish, with larger players accumulating during dips.
Once the resistance breaks, fear of missing out (FOMO) often drives prices sharply higher.
⚠️ 6. Risk Factors to Watch
Sudden USD strength or rising real yields.
Geopolitical de-escalation that reduces safe-haven demand.
FOMC rate surprises or unexpected hawkish policy shifts.
✅ Conclusion: Bullish Breakout Setup in Play
Gold is poised for another leg up after completing a textbook bullish flag pattern. With macroeconomic tailwinds and a solid technical base, this setup offers a high-probability long opportunity targeting the $4,300 zone. Watch for a confirmed breakout and possible retest to load long positions with solid risk-reward.

BTC is in an ascending triangle and we are an upward movement.Bitcoin is currently in an ascending triangle pattern, which is a bullish continuation pattern in technical analysis. This suggests that buyers are gaining strength and there is a high probability of an upward breakout. The fact that we're already seeing an upward movement supports the idea that a new uptrend may be starting.
In short:
Bitcoin is forming an ascending triangle, and we're witnessing an upward price movement, which could signal the beginning of a stronger bullish trend.
