DXY Daily - Bull flag loading A daily sustained close above 96.50 will confirm the bullish break and will set in place the next leg higher for the greenback.
Bullish Flag

NZDUSD - Bullish FlagIs there a Bullish Flag setup potential in all mix of things? Well, probably.
Aggressive Traders can look for buying opportunities that extend above the breakout and potentially stretch to 0.6855 that went slightly beyond the first Shark Pattern completion.
Bearish Shark Pattern traders will then need to wait for candle confirmation before any attempt in shorting this pair.
Finally, the market is awake.

Swing trade opportunityForming a bullish flag after triangle breakout
there is opportunity for long when it breaks the flag pattern with good volume and strong candle.

BAJAJELECBajajelec has formed three patterns on chart; Cup n Handle, pole n flag & Bullish flag pennant.
Unfortunately it dint breakout of any of these patterns, so cannot be recommended to buy now.
But if breaks above 1320 then its a breakout in all these pattern & then it could be bought with stop-loss of 1275 & technically targets are unbelievable as per patterns which is 1600+

1 YEAR LONG BULL PENNANTADA is currently in the stage of forming an almost one-year-long Bull Pennant. Expect a big upthrust in the following few months.

Bharti Airtel correction over?Hello Traders, The last trade HCLTECH given yesterday hit the first target and we are booking it in this choppy market.
The next stock is also a one to go long on as it seems the correction in bhartiartl seems to be over and done for.
There's a demand zone near 650 levels which has been tested and stock took a good demand and reversed from here, we'll try to buy after the breaking of first resistance i.e 670.
Buy Above 670
Targets mentioned in the chart above
lease LIKE, COMMENT and SHARE to motivate and support me. I'll keep on posting new ideas on Indices & Stocks. Be sure to follow so that you don't miss any good trades that might have been rewarding.
Any comments and critiques will be appreciated even if it's of opposite view as a trader can also be right so many times.

NIFTY 50! as on 3/01/2022Shared this analysis of nifty 50 on 20 december!
That expecting the bullish move AND HERE IT IS!!
Forming a Flag Pattern and gave a breakout and a good bullish move in First trading week of 2022!
AS I ANALYSED EARLIER!!!
A good Resistance level at 17665 where nifty presently is!
A higher probability of retesting till 17380 or 17230 and then a pullback as ( Flag pattern is a bullish pattern)
Expecting NIFTY to hit 18110 And 18610 !!
Can take a bullish move after 17665 good breakout!
Check out previous analysis on my profile!

BTC/USDT 1W time frame CHART#BTCUSDT Exclusive TA update :-
$BTC currently trading at $47000
IMO this is best time to Buy #Bitcoin in 2022
As per chart $45000 is Strong Weekly resistance.
December Monthly Close Price is $46200
Which is act Like Strong support.
And $44000 also Monthly Good Support level .
$46400 is Weekly Strong Support.
Perfect Stop Loss for Spot Entry:- $42000
If Hold $44000 Monthly support then My 1st Target will be $55000
Most Important Point=
If $Bitcoin Break $655000 resistance then we can see Agaain All Time High 69000
Then next target will be 80k then final 100k
Bear View If break $44000 support and any Weekly candle close below $44000 then BTC bearish .
And If #btc Break 40K level Then we can see again 28800
Support Levels:-
Monthly = 44000
Weekly = 46400
Daily = $45000

$CHWY $Stocks Long Stocks
Bullish Flag Pattern on the Daily
Entry: $48-$50.00
S/L $46.00
PT 1 $57
PT 2 $62.
PT 3 $67
PT 4 Open $70+
Don't forget to like and follow and comment below.
Money Making Holidays

$TSLA heading to $1500 in year 2022.$TSLA heading to $1500 in year 2022. Need to break $1100 to confirm bull flag breakout.

AUDUSD expected buy after continuation pattern completesPrice reacted at a key level around 0.69935, it approached the key level with a descending channel which shows a potential reversal. A bullish engulfing pattern was then presented on the weekly timeframe, which added to the confluences we already had. After that l we were expecting a continuation pattern to confirm that the market is indeed buying. The continuation pattern is currently being created in the form of a bullish flag on the 4h timeframe, this gives us all we need to know that we are going long.
Look at buying AUDUSD when price breaks the flag on the upside at around 0.71934 with stop loss just below the flag and go for a 1:4 RR.
Solospike Trading

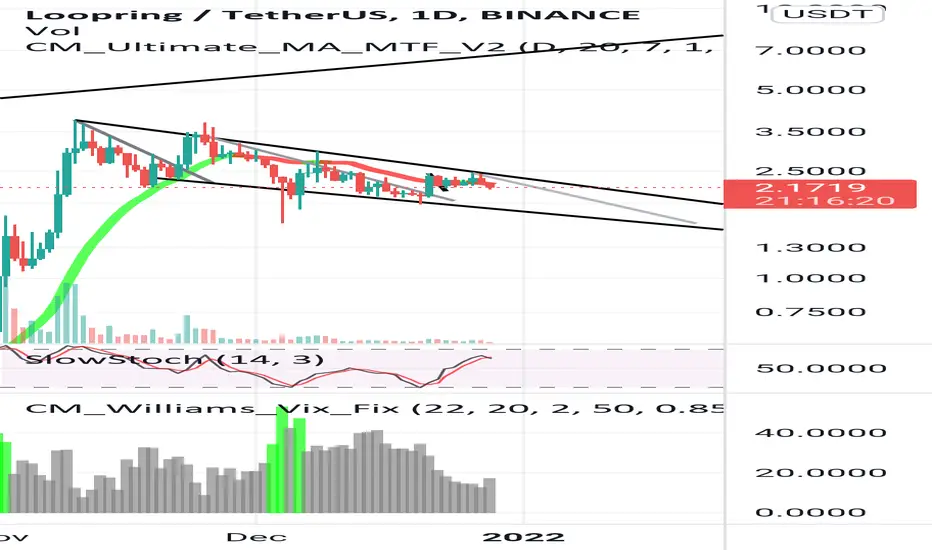
LRC rejectedIf no announcement comes this week we can see a slow bleed for the next 4 weeks.
Down to base of flag, 1.60 areas where to the last dump wick reached. This will maych the weekly me and the gamestop quarterly report at the end of january ( or their possible timeframe for announcement ).
Wait and see plus, Accumulate.
BUY AUDUSDPrice has formed a bullish flag and is now at the demand area of the flag. I expect a bullish move to the upside and a breakout from the rectangular pattern. My Take profit is set @ 0.72800

BTC USDT Rising criteria Depending on resistance and support, BTCUSDT will increase laying on moving support line to cross static resistance of 52,000 USDT to reach 64,000 USDT in the criteria shown in the Chart.

FTM I RE-RALLYINGIn context, depending when you see this, for the short term we would see price reaction on the downside but will break out of the pole (only if proved to be formed) and will make a good long term investment.

ENJ : Bull are coming?ENJ looks bullish since it already got rejected above 50 Daily EMA at 2.7450
Chart pattern : Bullish Flag.
The price have to Close above 2.9800 to continue it Bullish momentum.
If it fail, it will continue Bearish targeting 1H 50% Fib retracement at 2.5650.
Just my opinion. :D
Wish you all have a nice day. Hope this would help.

Aus 200 LONGAfter a bullish flag and break, the AUS200 has started to retrace to Support
This is an interesting area to BUY as there are a couple of wick rejections at the 7380 area
Using the bullish the momentum price may reject off this level again and then move to the upside to our highs.
Buy @ 7380’s
Stop @ 7365.1
3:1 RR


KIN Bullish Pennant on the daily.The Bullish Pennant is one of many chart patterns, in this case is a bullish indicator.
You can use the flagpole as an estimate for your targets, also keep in mind that the longer we take to break this structure, the harder we pump, so the possible 3x from the flagpole is a conservative estimate.

Shiba Inu Bull Flag Breakout soon?We all remember what happened here the last time..
If your new here you probably wont remember because we did it on my other trading account but i have several followers here from my previous account that they know very well... Either this chart makes you happy because you traded it with me last time and made a fortune.. Or it triggers & upsets you because you didn't believe in my analysis and told the story was done & over.
Today History is repeating, knowing Shiba hasn't done anything in the last month but going sideways, we have this great bull pattern about to do some serious move
We expect some good catalyst so the price can spike up again but wat gets my attention here is this:
Nov 2: 880,359 total $SHIB holders
Dec 16:1,066,221 total $SHIB holders 176,862 new SHIB holders in 45 days
That’s an average of +3900 new $SHIB holders each day!
and not only that, there are multiple big stores like Nordstrom that they now accept Shiba and Visa so far Shiba inu is growing more and more every day.
we just need one more strong catalyst to make the price explode and we know is Robothood
So to wrap this up, Whatever happens in the next days note we are in the same situation as the last daily bull flag...
no news no nothing and then the price just exploded like never before ! hoping this time will do the same thing.
-Mike


BBRI > BANK RAKYAT INDONESIA TBKBBRI membentuk pola Bullish Flag Wedge dan Inverted Hammer dengan Volume Besar,
Plan BOB:
BUY : > 4200
SL : > 4030 (4%)
TP1 : > 4550 (8%)
TP2 : > 5180 (23%)
Risk In Your Hand
Press Like & Follow if u like My Content.

BNB very Bullish, but short term bearish BNB is of great value, against ETH and BTC charts is working so well. Plus is reaching the bull band (SMA 21 and EMA 20) to find support and keep going from there completing the big bull flag.
One of the best Bullish scenarios I've seen! (if it holds)
Has been working out for us in our previews analysis
