9) CADJPY bullish gartley on 4hr chartFollow me and check the related ideas below to learn more details.
Bullish Gartley

BTC Gaining Momentum, Will Tron(TRX) Follow?When the BTC getting bullish momentum it is very likely altcoins will follow.
As we can see Tron just finished the harmonic Bullish Gartley pattern. We should see a very good buying opportunity in this case.
The stoploss is set to be very tight, so we dont risk the biggest loss if the Gartley Pattern were to fail.
Stay tuned for more.

10) CADJPY bullish gartley on daily chartFollow me and check the related ideas below to learn more details.

BULLISH GARTLEY ON AUDJPYOn the 4hr chart AUDJPY a Bullish Gartley has formed. The D leg is expected to complete at the 81.72 which is the 161.8 fib area where we look to take our long positions. Look for bullish evidence before taking the trade. Cheers

GBPCHF Potential Long OpportunityDescription: GBPCHF is testing the Fibonacci 61.80% of XA. If it breaks below 1.31900, the next target will be Fibonacci 88.60 1.31600 – 1.31500 region.
Pattern: Bullish Harmonic Pattern would be completed t D Leg. And we will look for a buying opportunity.
levels as described in the chart

gbpusd. unified gartleya potential bullish unified gartley is setting up on gbpusd. I will look at 60M timeframe to search for reversal signals within the buy zone when it completes. BOFORE IT COMPLETES NO ACTIONS ARE TAKEN.

6) GBPUSD bullish gartley on 1hr chartI will be updating GBPUSD ideas. Follow me and check the related ideas below to learn more details.

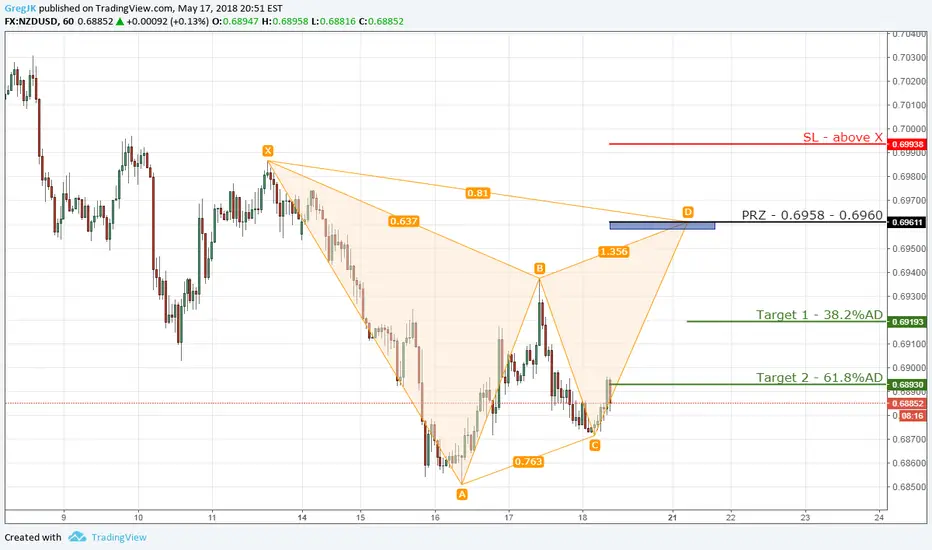
nzdusd.unified gartleya potential unified gartley patterns is close to completion. I will be looking at reversal signals to enter long within the buy zone.

7) NZDUSD bullish gartley on 1hr chartFollow me and check the related ideas below to learn more details.
Good luck.

5) NZDUSD bullish gartley on 1hr chartI will be updating new ideas on NZDUSD. Follow me and check the related ideas below to learn more details.

2) NZDUSD bullish gartley on 1hr chartFollow me and check the related ideas below to learn more details on NZDUSD.

4) EURUSD bearish gartley on 15min chartI will be updating new ideas on EURUSD. Follow me and check the related ideas below to learn more details.


XVGBTC Gartley butterfly is going to be formedThe coin is oversold according to various technical indicators, we took one of them to show you at the chart, it is Stoch RSI which is in a buy state now. Combining Ichimoku clouds with the rest indicators we forecast finishing of XABCD pattern and a huge bounce afterall. However XVG is a manipulated coin and the pattern may be broken, hence the growth will happen earlier.

XAUUSD bullish gartley on 1hr chartFollow me and check the related ideas below to learn more details on XAUUSD.


Gartley EUR/AUD (Daily-chart)Potential long entry around 1.57461 at the completion of the Gartley pattern
Comment below if you have any thoughts on this!

$SPY trying to recoverSPY completed a bullish Gartley in its daily chart and it's currently headed towards the resistance of 266.70.
Overall picture gives a downtrend nonetheless.
Stochastic RSI in oversold territory and MACD recovering but still in negative territory confirms it.
Not a trading advice, merely an idea for educational purposes

LSKBTC Lisk v Bitcoin Bullish Gartley? Lisk is not a cheap coin at $11.24 and has been trading nicely.
If they get their act together :), the Gartley may just stick!!
Entry any point now as 8 & 20 EMAs have crossed, target profit at 21.4 and 28.4k Satoshis respectively
@bizlus


GBPUSD GARTLEY PATTERN CHECKING GBPUSD If complete point D to buy
TP 1 - 61.8%
TP 2 - 38.2%
SL - BELOW 30 TO 50PIPS IN POINT D
Disclaimer:
The information contained in this presentation is solely for educational purposes. Does do not constitute investment advice. I may or I may not take the trade.
The risk of trading in securities markets can be substantial. You should carefully consider if engaging in such activity is suitable for your own financial situation.
I am not responsible for any liabilities arising from the result of your market involvement or individual trade activities.
Hope this idea will inspire some of you! Don't forget to hit the like/follow button if you feel like this post deserves it
