Intel at PCZ of Bullish Gartley with Bullish DivergenceI bought a little earlier at $50 not being sure if it would pullback to the PCZ but now that it's here i will be adding major size to the trade with my stop below X.
Bullish Gartley

USDCAD - Bullish GartleyAs you can see there are 2 Harmonic Patterns that have the same potential of forming up. Although the Bearish Shark Pattern is about to complete, however, my trading bias is on the Bullish Gartley Pattern.
You may wonder, "Why the Gartley Pattern rather than the Shark Pattern that's going to complete?"
Well, the reason is simple, having the Bullish Gartley formed, it can create a trading combo on the 4-hourly Bullish Flag Pattern. Is that simple.
That gives me the lowest risk and highest return possible.

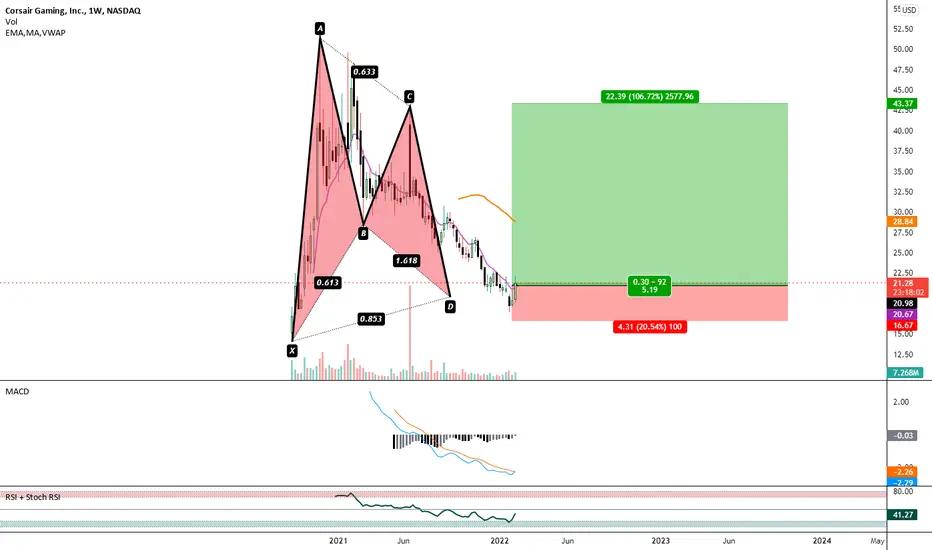
Morning Star at PCZ of Bullish Gartley Visible on WeeklyCorsair for it's entire life has shown nothing but Negative Momentum on the Weekly MACD but now only after hitting the PCZ of a Bullish Gartley has it decided to print a Bullish Candle Stick Pattern and show a Curling up in MACD Momentum; this may signal seller weakness and if this continues we will see the first bar of Positive MACD Momentum in the asset's Entire Lifetime, that may lead to a Climatic Rising in Price, perhaps all the way up to the $50s in the coming weeks.
GBPAUD - Bullish GartleyA Bullish Gartley Pattern that I'm personally waiting for a retest at 1.8845 for a buying opportunity. Well, I could say a placing of Buy Limit Level is possible as the market has already confirmed this Gartley Pattern.

GBPJPY - Bullish GartleyGBPJPY has an Emerging Bullish Gartley Pattern form within the Buy Zone at 155.23. Trend Traders can wait for a candlestick confirmation for a buying opportunity.

USDJPY-Weekly Market Analysis-Feb22,Wk2USDJPY is at its consolidation phase. The overall setup tends to have a Bullish setup. On the 4-hourly chart, you can wait for a Bullish Gartley complete at 114.00.
If you are an intra-day trader, you can consider engaging the Bullish Flag trading opportunity within the 8 Range Bar chart.

VIX Pump Part 3 Is Setting UpEver since breaking out of the falling wedge the VIX continues to put in higher lows at Harmonic Zones if the trendis to continue we should see the VIX run up to atleast $38 again as we have a Bullish Gartley with Hidden Bullish Divergence on the 4 Hour with the 200 and 800 MA holding us up here.

Monthly PCZ of Bullish Gartley Fastly ApproachesThis is an Update to a previous Idea i posted a couple weeks ago in which i expected GRT to give us a pullback from the top of a Parallel Channel as it was showing Hidden Bearish Divergence on the MACD and was near Deep Fibonacci Retracement levels. In that Idea i did hint towards a possible level that i felt GRT drop to and become Bullish at and now that GRT has gotten much closer to actually hitting the level i am posting the Bullish side of the trade.
For context of why i expected this pullback check the Related Ideas tab.

Terra Luna: Bullish Gartley with Daily MACD Bullish DivergenceIt's a bit of a high flyer right now but it is nice that it's attempting to use old resistance as support, the 200 Day Moving Average is nearby, and that the MACD is beginning to Diverge.
I'd simply give it a shot here and cut my losses if i9t goes under the low of X.

Bullish Gartley With Bullish Divergence on $AMCAfter a Huge Bearish 5-0 Decline, AMC is looking like it's ready to attempt a recovery of some of the losses as we have large amounts of 4hour Bullish Divergence on both the MACD and RSI. We are at a Weekly Support/Resistance level and we are at the PCZ of a Bullish Gartley visible on all Timeframes; Assuming we can get a couple more Bullish Days from here we will see an eventual Bullish Crossing of the Daily MACD which could lead to a decent rally.

Facebook Wave 4 On The WayI believe Facebook has enter wave 4 corrective move of a large wave 3. I've illustrated where I believe wave 4 will bottom before the accession of the final wave 5 before a VERY SEVER LARGE correction. As you can see, there's is also a potential bullish Gartley harmonic pointing to a potential bottom and happens to be right at the completion of wave 4 before the next leg up. This is my own opinion and I'm only showing what I may do. I'm not a financial advisor. I hope this helps some of you. Good luck!

ADVANC | Bullish Gartley | Possible Sideway wave correction Price Action & Chart Pattern Trading: Hold / Accumulate - Pullback Entry
> Possible breakout pennant triangle in sideway after forming bullish gartley as correction after minor Elliott Wave 5
> RSI & MACD bullish crossing signal line above base.
Always respect your stoploss
Good Luck

Weekly Bullish Engulfing and Bullish Divergence at 88.6% RetraceWe have somewhat of a Bullish Gartley here with kind of a Bearish 3 Line Strike but more of just a Bullish Engulfing on the Weekly at the PCZ of a Harmonic that's kind of a mix of a Bat and a Gartley. Lets just say it's a Bat for simplicity as it lines up with the ABCD move.

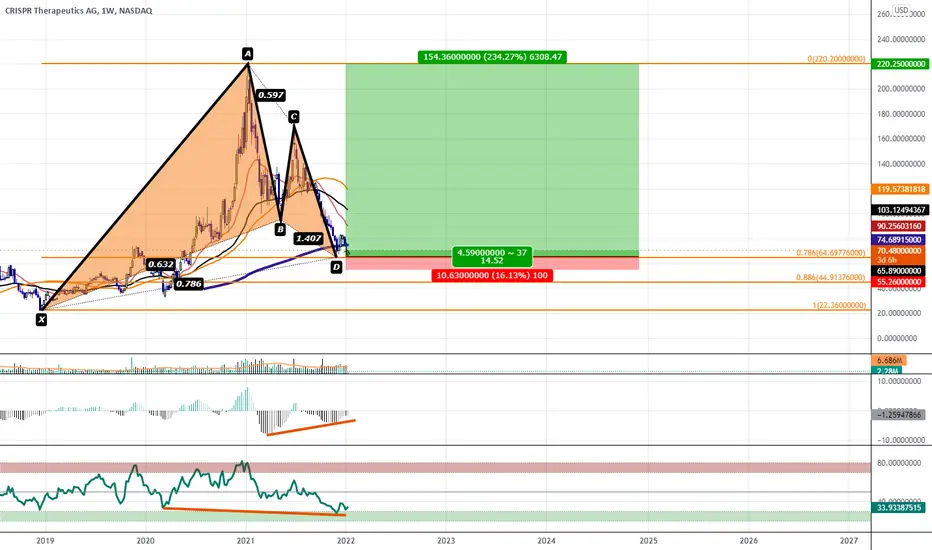
Bullish Gartley with Bullish Divergence Visible on the WeeklyWe have Classic Divergence on the MACD and Hidden Bullish Divergence on the RSI visible on the Weekly chart at the PCZ of a Bullish Gartley.
ALPHA/USDT (Interval 1D) Bullish GartleyALPHA is making a bullish Gartley pattern on a daily chart. Chart is self-explanatory. Lets hope this pattern plays out.

USDJPY-Weekly Market Analysis-Jan22,Wk2A Bullish Gartley Pattern could be a buying opportunity for many, however, I will wait for a confirmation signal, at least a reversal candle before engaging the trade.
What concern me is the candle formation on Friday close. I may engage the trade as early as 2hours after the market open on Monday.

C98USD: Bullish Gartley Within Falling Wedge at PCZSo the idea here is that we are near the bottom of a ranger and are springing back above the 78.6% Retrace PCZ while are Bullishly Diverging With Positive Momentum on the MACD Histogram and we are about to do Similar things to REN from here on out.

Bullish Gartley Entry with Bullish DivergenceLets see if we can get a big pump to over 1 dollar from here

The Oxy Protocol Gartley Trade Lives On!We Have 4 Hour Bullish Divergence and a Double Bottom at the PCZ of this Bullish Gartley that price action has held itself together surprisingly well at during the Bearish price Action on Bitcoin. We did however see a weird wick down in the Spot Market but the Futures Market held together very well at this PCZ and we might see another decent rise up.

MGOUSD Bullish Bat PCZ at Demand LineWe could see a reversal back to the top of the triangle from here.

Bullish Gartley With Bullish Divergence on the 4 HourWe had a huge drive down today and hit the PCZ of a "Makeshift" Gartley I was thinking it could be a Crab but a 1.618 wouldn't make much sense here so the closest thing to a clue we have is this "Gartley" we may see a reaction rally from here.

$FSLY Bullish Gartley: Buying Between the .786 and .886 Retrace.Been waiting a while for this one lets see if it will be worth it.
We got bullish divergence on the MACD nothing much on the RSI but still a nice looking Harmonic here at an old zone Support/Resistance so it's worth a shot.

Bullish Gartley PCZ Entry Reached; RSI OverSOLd.We finally had a huge sell down into the PCZ entry of this Gartley with lots of volume behind it; lets see if we can get a bounce and start going up from here again.
