Failed Wedge, New Setup. Is SUI About to Break Out?In my previous post about BYBIT:SUIUSDT , I mentioned a potential falling wedge pattern. However, the breakout above the 4.0040 resistance turned out to be a false breakout, and the price eventually dropped to the invalidation level at 3.5868. This made the setup invalid.
But despite the failed wedge breakout, BYBIT:SUIUSDT remains in a bullish trend overall. During the current consolidation, the price appears to be forming a new bullish pattern — a Descending Broadening Wedge (DBW).
This pattern typically starts with low volatility and gradually widens. Once price reaches its lower boundary, it often experiences a strong breakout to the upside.
Let’s break down the key price action in this DBW setup:
Price is moving within a Descending Broadening Wedge and is currently near the lower boundary of the pattern.
It’s also sitting around a key support level at 3.4833.
A rejection candle formed right at 3.4833, showing the market’s response to this support area.
A reversal confirmation would come if the price breaks above 3.6102.
A bullish divergence is also visible — price is forming lower lows, while the stochastic indicator is forming higher lows.
Based on these five price action signals, it seems that buyers are still in control, even though short-term volatility has created a series of lower lows.
That’s why I still believe BINANCE:SUIUSDT has more room to go up. What’s your take on this?
Bullishharami

HARAMIYes, you read it right.
Infosys Fut made Bullish Harami Candlestick Pattern on daily charts with 3 indicators suggesting buy.
RSI comfortably @ 60.15
MACD slightly below 0 line
ADX @ 25
OI 1.04%
Could be bought with stoploss below 1520 with targets of 1640 & 1740.

BANK NIFTY - Potential Bullish Move on Bullish Harami Formation
On the daily chart, a Bullish Harami pattern has formed, signaling a potential reversal after the recent downtrend. Here's my plan for this setup:
Entry: I'll be waiting for a 15-minute candle to break above the Entry Zone (51,784.80) . The high of that 15-minute candle will be my actual entry point.
Stop Loss: If any 15-minute candle closes below 50,194.30, I'll exit the trade to protect capital.
Target 1: 52,604.95 (First resistance)
Target 2: 53,375.30 (1:1 risk-reward)
Target 3: 54,965.80 / 54,840.50 (Major resistance area)
I'm watching for a breakout above the entry zone, ideally with strong volume for confirmation. The key here will be holding above the entry zone and making progress toward Target 1. If that happens, I’ll evaluate momentum for potential continuation toward Target 2 and Target 3.
As always, managing risk is crucial. If the price closes below the stop loss level on a 15-minute candle, I'll close the position. Let’s see how this setup plays out!
Disclaimer: This is not any financial advice, and for education purpose only.

BHARTI AIRTEL - Bullish SetupEnter only when 15minute candle closes above the Entry Zone Price - 1687.70
Targets are : 1745.25, 1802.8
Stoploss only when 15minute candle closes below the price - 1630.15
Note: This is not any financial advice, this is for education purpose only.

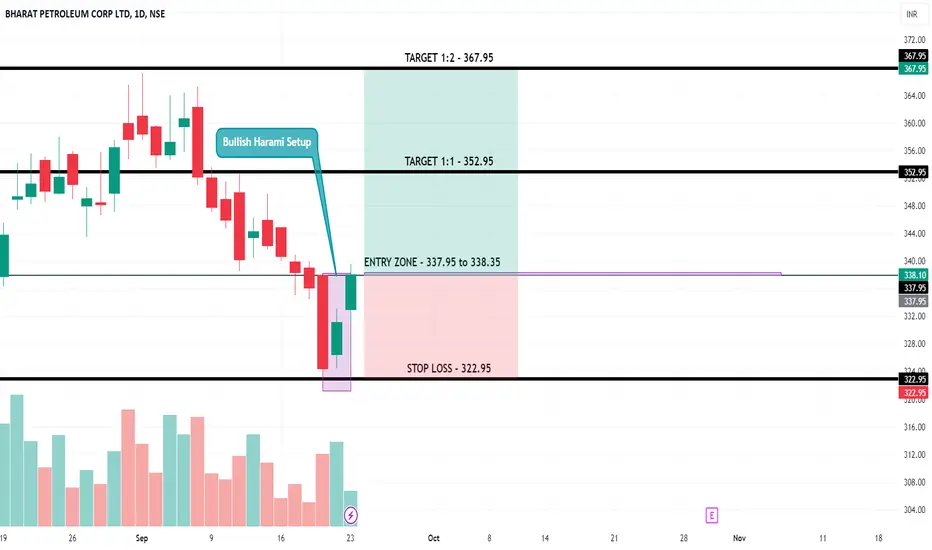
BPCL - Long SetupBPCL has bullish harami setup and already 15m candle has sustained above the price - 337.95 for more than 10 seconds.
Targets are: 352.95, 367.95
Stoploss only when 15min candle closes below the price: 322.95
Disclaimer: This is for educational purpose only and not any financial advice
ADM: Bullish Harami on the Weekly at a Bullish Gartley HOP LevelArcher-Daniels-Midland is sitting at the HOP level of a Bullish Gartley aligning with support with a Bullish Harami Visible on the Weekly Timeframe after setting record-breaking weekly volume into the test of the Support Zone.
ADM will close and confirm the Weekly Harami in less than an hour and from there we would expect to see ADM make an effort to fill the weekly gap above, perhaps going all the way up to the 61.8% retracement.

EURJPY LONG PROJECTIONEURJPY setting up to go long after it broke the H4 trendline, retested and rejected it. It has also broken a symmetrical triangle early without coming close to the apex point and created a small bullish harami pattern after the retest.
Could it finally gain momentum to push higher or could it consolidate more and test the 38.20% Fibonacci level then head up?

JSW Steel: Bullish HaramiWe can buy if open around @750 level
with SL @735 and target @765
Disclaimer - This post is only for educational purpose and do not treat it as a trading recommendation.

INDUSTOWER: Bullish HaramiWe can buy if open around@186.5 with target @190 and SL@184
Disclaimer - This post is only for educational purpose only and do your own due diligence before trading or investment.

AMC: A bottom sign! What to expect next?• AMC is still in a bear trend, and there is no reversal sign yet. However, there is a bottom sign on it today, just above a support level (black line at $6.80);
• Today’s candlestick pattern is a Bullish Harami, so far, and although it is not the most reliable bottom sign, it appeared in an important support level;
• This could make AMC bounce back up to its 21 ema again, but remember, this is not a reversal sign yet, just a temporary bottom sign;
• If AMC breaks its 21 ema or does a bullish reversal structure in the next few days, then we can talk about a reversal, but for now, let’s just ´pay attention to the Harami pattern;
• In addition, if AMC frustrates this bottom sign, it’ll just seek its next support levels, like the red line at $6.34 - $5.96;
• It all depends on how AMC will react from here.
I’ll keep you guys updated on this. Remember to follow me for more analysis like this! Keep in touch.

PEL - Bullish viewAll details are given on chart. If you like the analyses please do share it with your friends, like and follow me for more such interesting breakout charts.
Disc - Am not a SEBI registered. Please do your own analyses before taking position. This post is only for educational purposes and not a trading recommendation.

NIO Cars Have Four Wheels & A Double Bottom?NIO Cars Have Four Wheels & A Double Bottom?
I am confident that NIO vehicles have four wheels and a double bottom pattern on the daily chart.
Expected move-From the neckline to the peak of the pattern is approximately 10 bars or 10.99 ticks.
What confluences further influenced my position on NIO?
-9 MA approaching the 21 MA for a crossover
-Broke above the weekly timeframe resistance zone
-Bullish Harami pattern spotted on 4H chart.
*Special note- NIO gapped down January 24, 2022. The gap size is approximately 5.08% or 1.32.
The reasons aforementioned is the explanation for my bullish stance on NIO.
*This is not financial advice.
Peace & Prosperity,
MrALtrades00

ishares Trust iShares U.S. Transportation ETF (IYT)-Bullishishares Trust iShares U.S. Transportation ETF AMEX:IYT
I am bullish on IYT because I've identified a Bullish Harami pattern on the daily chart. Furthermore, we have several confluences on the MacD, RSI and volume indicators.
-The signal is crossing up like A.I. (Allen Iverson) on the MacD indicator
- The RSI indicator is pointing up
-The OBV indicator is displaying increasing volume
Peace & Prosperity,
Al
*******This is not financial advice**************This is not financial advice**************This is not financial advice*******

Toei Animation: Monthly Bullish Harami Visible at 61.8% RetraceWe are printing a Bullish Harami with Hidden Bullish Divergence at a 61.8% Retracement on the Monthly Timeframe; If this plays out we could see a rally up to 20,000 JPY

SILO > SILOAM INTERNATIONAL HOSPITALS TBKSILO membentuk pola Bullish Harami dengan Stochastic di bawah 20,
Plan BOB:
BUY : > 8250
SL : > 7600 (8%)
TP1 : > 9800 (18%)
TP2 : > 11300 (36%)
Risk In Your Hand
Press Like & Follow if u like My Content.

AN UPMOVE OF 3.77% IS BEING EXPECTED IN AARTI INDUSTRIESOn the 1 Hour Chart of AARTIIND, we can witness a beautiful Bullish Reversal Pattern Formation of "Bullish Harami" on the downside levels. Thereby, we are expecting a bullish momentum in the stock in the upcoming trading sessions. Where the stock is being expected to initially face a resistance at the levels of 965.85, 977.20, and 995.15. In addition to this, the stock may face a support at the level of 947.10. Closing Price (as on 06.12.21) : 958.90
Disclaimer: No financial information whatsoever published here, should be construed as an offer to buy or sell securities, or as advice to do so in any way whatsoever. All matter published here is purely for Educational and Information purposes only and under no circumstances should be used for making investment decisions. Viewers must consult their personal financial advisor before making any actual investment decisions, based on information published here. Any Investor or Trader taking decisions based on any information published here, does so entirely at its own risk. Investors and Traders should bear in mind that any investment in Stock Market is subject to unpredictable market-related risks.

BULLISH FORMATIONS IN SUNPHARMAOn the 1 Hour Chart of SUNPHARMA, we can see some beautiful bullish Formations of "Bullish Harami", "Hammer" as well as "Inverted Hammer" on the downside levels of the stock. Thereby, indicating a very strong bullish momentum in next trading sessions. In addition to this, the stock seems to be facing a support at the level of 746.25. As plotted and explained in the chart, we can say that it is being expected that the stock can face resistance initially at the levels of 758.45, 763.85, and 770.95. Closing Price (as on 03.12.21) : 753.35
Disclaimer: No financial information whatsoever published here, should be construed as an offer to buy or sell securities, or as advice to do so in any way whatsoever. All matter published here is purely for Educational and Information purposes only and under no circumstances should be used for making investment decisions. Viewers must consult their personal financial advisor before making any actual investment decisions, based on information published here. Any Investor or Trader taking decisions based on any information published here, does so entirely at its own risk. Investors and Traders should bear in mind that any investment in Stock Market is subject to unpredictable market-related risks.

FORMATION OF BULLISH HARAMI IN BURGER KINGA Beautiful Formation of "Bullish Harami" has been observed on the 1Day chart of BURGER KING INDIA LIMITED. Hence, a bullish momentum is being expected in the stock during the next trading session dated, 3rd of December, 2021. In addition to this, once again after June 2021, the stock seems to be facing a very strong support at the level of 144.65. As plotted and explained in the chart, it is being expected that the stock can face resistance initially at the levels of 150.90, 153.95, and 156.30. Closing Price (as on 02.12.21) : 148.60
Note : This Analysis is valid for the Next Trading Day only.
Disclaimer: No financial information whatsoever published here, should be construed as an offer to buy or sell securities, or as advice to do so in any way whatsoever. All matter published here is purely for Educational and Information purposes only and under no circumstances should be used for making investment decisions. Viewers must consult their personal financial advisor before making any actual investment decisions, based on information published here. Any Investor or Trader taking decisions based on any information published here, does so entirely at its own risk. Investors and Traders should bear in mind that any investment in Stock Market is subject to unpredictable market-related risks.

FB longEntry price: 337-342$
Target price: 377-384$
Candle pattern: Bullish Harami
Keltner Channels: the price beyond the lower band
RSI: indicator approached the 30 level, therefore the market is close to be oversold
Conclusions: RSI, candle pattern and Keltner Channels suggest the trend reversal. Thus, the long position is recommended in the support zone.
No financial advice

Weekly Bullish Harami with Hidden Bullish DivergenceThe 2022 call options for this one seems like a good play. Or you could buy some shares but im going the route of options.

TrendyTrades: AMAT AnalysisBullish Harami, bottom of channel, bullish trendline bounce, gap fill above. Gap fill can be used for PT.

TrendyTrades: MU ChannelBullish Harami signaling a reversal he at the bottom of the channel. Gap fill above can be used as PT.

Bitcoin making a Bullish Harami. Identifying Candlesticks.Keeping it very simple today.
Big red candle to the left totally enveloping a green candle to the right = Bullish Harami.
It's ok that there is a big red candle to the left. That candle needs to be there or else the current green candle wouldn't be what it is (bullish harami). It's relative.
----
Remember: Never take trades off of candlestick identification alone. Combine with other elements.
*I have been trying to get off of caffeine lately, ok. Don't get upset because this isn't a challenging lesson.*
