BTC ANALYSIS#BTC Analysis : Channel Following
📊As we can see that #BTC is following ascending channel on daily time frame. Currently the price is trading above its major support zone. Price is moving upwards within a long-term rising channel, recently moving towards its support from its support level. Expect a bullish move in few days.📈
🔖 Current Price: $87,700
⏳ Target Price: $91,500
⁉️ What to do?
- Keep your eyes on the chart, observe trading volume and stay accustom to market moves.🚀💸
#BTC #MajorSupport #Cryptocurrency #ChartPattern #DYOR
Bullishmarketstructure

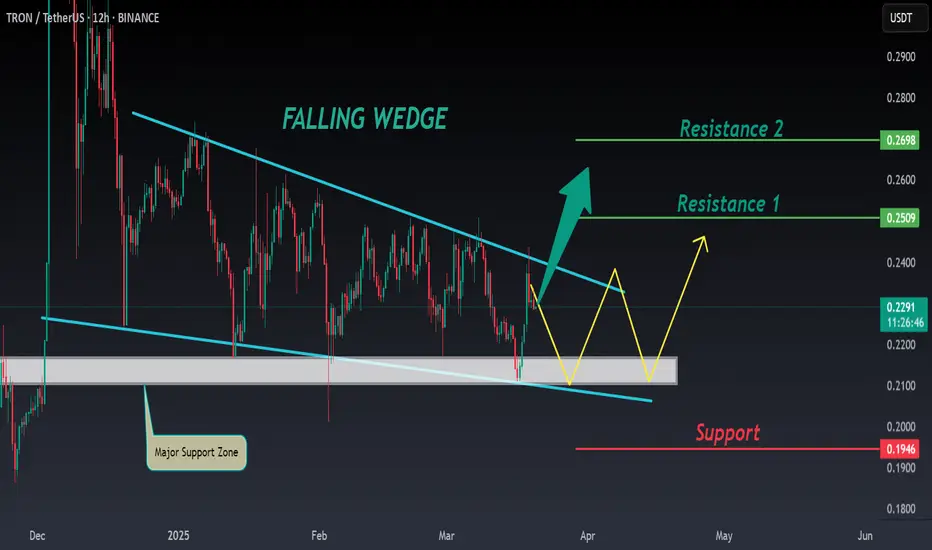
TRX ANALYSIS📊 #TRX Analysis
✅There is a formation of Falling Wedge Pattern on 12 hr chart and currently trading around its major support zone🧐
Pattern signals potential bullish movement incoming after a breakout
👀Current Price: $0.2290
🚀 Target Price: $0.2500
⚡️What to do ?
👀Keep an eye on #TRX price action and volume. We can trade according to the chart and make some profits⚡️⚡️
#TRX #Cryptocurrency #TechnicalAnalysis #DYOR
FET ANALYSIS🔮 #FET Analysis - Both Side Scenario 🚀🚀
💲💲 #FET is trading in a Symmetrical Triangle Pattern. If the price of #FET breaks and sustain the higher price then will see a pump otherwise it will retest the support zone first and then a reversal can come in #FET📈
⁉️ What to do?
- We have marked crucial levels in the chart . We can trade according to the chart and make some profits. 🚀
#FET #Cryptocurrency #Support #Resistance #DYOR

Apple Doesn’t Want to Fall From The TreeNASDAQ:AAPL JUST made a new all time high and we are currently at price discovery!
Any retrace toward $239’s - $238’s should be bought. There’s huge bullish momentum behind and this levels which aligns with previous highs, should hold.
If for some reason we get a steeper retrace then re enter at around $230’s for the ideal ENTRY which is not guaranteed taking into account current price action.

Indian Market, FIIs and their "Foolish" StoriesI am part of Several Social Media forums (on X, Telegram, Whatsapp etc...). In every channel, we forward FII/DII Activity so diligently Every day. But have we ever seen the Big Picture ???
Look at this link
trendlyne.com
For the Past 10 years, FIIs were net buyers only 3 times and the magnitude of such Buys is miniscule compared to the Magnitude of what they Sold. 👆👆👆
And In this 10 year period from 2014 - NIFTY has grown 290% Non-stop - with only 1 year in RED
I Feel personally ashamed that with so much data in hand, we don't do the proper analysis and go behind some TV Analyst and Stupid Finfluencer for so many years in the Trance that India is controlled by FIIs. If they withdraw - our market will be on its knees - begging 🙇♂??? Not possible. That's not the reality at all
Ignore the Noise being fed to us everyday.... Do you own Analysis, Stay Strong, Stand Strong - "On your Own Legs"
If you like my Analysis - Please give me a High-Fi 🖐🖐🖐
Disclaimer:
Stocks-n-Trends is NOT a SEBI registered company. We do not provide Buy / Sell recommendations - rather we provide detailed analysis of how to review a chart, explain multi--timeframe views purely for Educational Purposes. We strongly suggest our followers to "Learn to Ride the Tide" and consult your Financial Advisors before taking any positions.
If you like our detailed analysis, please do rate us with your Likes, Boost and share your comments
-Team Stocks-n-Trends

THE KOG REPORTTHE KOG REPORT:
In last week’s KOG Report, we said traders must be aware of the conditions they’re trading, and markets are moving at extreme levels, we said would be looking for that sudden turn in Gold that may catch traders out. We gave the initial resistance level on the open of 2330-35 where we anticipated the first move down into support, this gave traders an opportunity but it was short lived and only netted us 100pips. The move however, was pinpoint, into support and then the bounce giving the long trade back up level to level. We said a break of that support level is what will be needed for Gold to go down further, otherwise, the reaction from those levels could give the bounce, which is what we got into the region we wanted 2350-55.
During the week, upon breaking the resistance level, we continued with KOG’s bias of the week, looking for the higher levels 2365 and above that 2372, which we completed. Excalibur however had other plans and kept activating long and looking at the move we decided to continue with the move taking longs until Thursday’s close, where we suggested no more longs and gave the levels for the potential turn.
The third level worked a treat, giving traders the opportunity to short the market for a huge move to the downside, which is where we closed for the week. An absolutely fantastic week in Camelot, completing targets not only on Gold, but the numerous other pairs we trade, giving a record breaking pip capture for us since we started sharing our work.
So, what can we expect in the week ahead?
Are we now bearish? That’s the question on everyone’s mind at the moment! Answer, simply, no, not yet! This is a correction, but most likely profit taking at the moment, we still need a complete swing turn here to then start looking for this to target the lower levels we wanted last week, which are sitting around the 2270-50 region. For that reason, we’ll initially want to see how the markets open before taking any positions, there is a chance we will see gaps on open that may again catch some traders out, especially those who entered late session Friday and didn’t protect their trades!
We have the immediate resistance above sitting at the 2355-65 region, if held during the early part of the week, we feel there is an opportunity to short the market back down into the lower support regions, 2330-35 and below that 2310-2295. This is where we want to see the first RIP, and if we get it we feel the long is available into the higher regions where we will only follow Excalibur and hopefully get to carry and trades, if we get them.
Please note, breaking above that higher resistance level of 2365-70 will give us the move to fill that wick and potentially take us into an even higher high, so please be careful if you’re in the wrong way, make sure you act accordingly and have a risk model in place.
On the flip, continuing downside from the open, we suggest traders leave runners on any shorts from above, looking for the levels below 2310 and below that 2290-95 where we feel there may be RIPs, but only temporary, giving traders an opportunity to long the market level to level upside. If we get this move, we will be looking to add short trades and move with the market.
One key thing to note here, if this is a bearish move here, we need more confirmation on it, as institutions don’t usually stop in one day, they tend to continue the move so breaking that lower level of 2290-95 is important. Don’t worry about capturing moves from tops and bottoms, it’s extremely difficult to do unless you have the right guidance and experience in identifying the key levels. The market will always give opportunities, take it at your stride, use the levels provided and make sure you have a risk model in place.
More extreme conditions to come in the week’s ahead!
KOG’s bias for the week:
Bearish below 2365-70 with targets below 2310 and below that 2295
Bullish on break of 2375 with targets above 2425 and above that 2447
Keep an eye on the daily analysis as well as KOG's daily bias which as many traders have seen, work extremely well.
Please do support us by hitting the like button, leaving a comment, and giving us a follow. We’ve been doing this for a long time now providing traders with in-depth free analysis on Gold, so your likes and comments are very much appreciated.
As always, trade safe.
KOG

EURJPY 30m chart potential Falling wedgeThe the 30m chart the EURJPY is forming a potential falling wedge. On the chart infront, you can discover a bullish market structure
Additional confluences:
- Price has dropped to the support range created from the previous major high
- The price is testing the 0.382 Fib. Have in mind that the 0.5 and the 0.618 levels are also in the support range so it is possible for the price to drop lower. If it does, monitor if it's still in the ranges of the falling wedge. If it goes out of them, then the pattern will be invalidated.
- Price is close to the 200 EMA, Might drop a bit lower to test it before providing a potential breakout of the pattern to the up side

Equities at Technical Resistance with BULL Market StructureDJ:DJI NASDAQ:NDX
SP:SPX
Equities have rallied in June 2022. However, here in the S&P500 chart we can see a patter that is true for all 3 equity indexes. All three indexes (DOW, SP500, NASDAQ) are at a technical resistance level. This means that it is at a price level that it previously attempted, but was unable to cross above.
Let's consider that the price action AND RSI oscillator have been making prominent and consistent higher low and higher high which show that the current bull run is STRONG and backed by a bullish market structure. Now that the bullish market structure has carried the price all the way to technical resistance what will happen next? I see three possibilities (1=least likely, 3=most likely)
#1. Backed by this strong bullish market structure, the price will close above technical resistance and form a new support level from that previous resistance level. This will also single a continuation to further growth in the markets and a possible end to this bear market.
#2. Resistance level will stay the same, price will go down but still form a higher low. Price then rallies back up to the resistance level and proceeds the same as #1.
#3. Resistance level will stay the same, price will go down all the way to the support level or even lower. Signaling a continued bear market.
I will most definitely be on the lookout for how this level gets resolved.
