JPY/USD Breakout from Falling Channel – Bullish Trading SetupOverview of the Chart:
The Japanese Yen (JPY) against the U.S. Dollar (USD) 1-hour chart showcases a well-defined market structure, transitioning from a downtrend within a falling channel to a breakout with bullish momentum. The chart highlights critical support and resistance levels, a confirmed breakout, and a forecasted price movement that could indicate further bullish continuation.
This analysis will break down the chart patterns, technical indicators, and potential trade setups, providing a professional outlook on price action behavior.
Technical Breakdown of the Chart
1. Falling Channel Pattern – Downtrend Phase
The price had been trading within a descending channel, marked by two parallel trendlines (blue lines), indicating a controlled downtrend.
A falling channel is a bullish reversal pattern, as it signals that bearish momentum is weakening.
Within the channel, price action consistently created lower highs and lower lows, adhering to the structure of the pattern.
The red dashed trendline inside the channel acted as a dynamic resistance, rejecting price movements multiple times before the breakout.
📌 Key Observation: The falling channel pattern suggests accumulation, where selling pressure gradually diminishes, paving the way for a bullish reversal.
2. Support Zone & Bullish Breakout
The price eventually reached a strong horizontal support level (highlighted blue zone at the bottom), which acted as a critical demand area.
This support level had previously led to strong rebounds, making it a significant zone for potential reversals.
Bullish breakout confirmation:
A strong bullish candle closed above the upper boundary of the channel, breaking the trendline resistance.
The breakout suggests a shift in market structure from a downtrend to an uptrend, as buyers regained control.
The price has now moved above the previous resistance, confirming the bullish momentum.
📌 Key Takeaway: The breakout is a strong signal that sellers have lost control, and a potential bullish trend could emerge.
3. Resistance Zone – Key Barrier for Buyers
The next area of interest is the resistance level (highlighted in a blue rectangular zone).
This level has historically acted as a strong supply zone, where price previously struggled to break through.
If the price manages to sustain above this level, it would confirm bullish continuation toward higher price targets.
📌 Technical View: If buyers break past this resistance, it could lead to a strong bullish rally, reinforcing the new uptrend.
4. Target Projection & Forecasted Price Movement
The chart outlines a forecasted bullish path using a zigzag projection (black lines). Here’s the expected price action:
Short-Term Movement:
Price might face temporary resistance near the blue resistance zone.
A minor pullback or consolidation in this area is expected before further movement.
Retest of Support:
If price pulls back, it could retest the broken channel resistance or the support zone.
A successful retest and bounce would validate the strength of the breakout.
Bullish Continuation:
If the resistance zone is broken, price is likely to continue toward the target level of 0.006842, a previous swing high.
This level acts as the final upside target based on historical resistance levels.
📌 Key Insight: The market structure suggests that price will follow a higher-high, higher-low pattern, which is characteristic of an uptrend.
Bullishmomentum

#1000CHEEMSUSDT is setting up for a breakout Long BINANCE:1000CHEEMSUSDT.P from $0,0014000
🛡 Stop loss $0,0013740
1h Timeframe
⚡ Plan:
➡️ POC is 0,0013254
➡️ Waiting for consolidation near resistance and increased buying activity before the breakout.
➡️ Expecting an impulsive upward move as buy orders accumulate.
🎯 TP Targets:
💎 TP 1: $0.0014380
💎 TP 2: $0.0014700
🚀 BINANCE:1000CHEEMSUSDT.P is setting up for a breakout—preparing for an upward move!

GBP/USD Market Outlook & Analysis (Bullish)**GBP/USD Market Outlook & Analysis**
**📊 Price Action & Key Levels**
- **GBP/USD trades around 1.29300** in a narrow range, struggling for momentum.
- Last week’s **high of 1.29900** remains a key resistance level.
- **Key Support Levels:**
- **1.29000 (Psychological level)** → A breakdown may trigger more downside.
- **1.2850 (Next key support)** → Watch for buying interest.
- **Key Resistance Levels:**
- **1.2990 (Last week's peak)** → A breakout could open doors for **1.3050+.**
**🌍 Fundamental Drivers**
- **USD Weakness:**
- Fears that **Trump’s tariffs could slow the US economy** weigh on the dollar.
- Weak US inflation and a **cooling labor market** increase **rate cut expectations** for 2024.
- University of Michigan’s **Consumer Sentiment Index fell** to a 2.5-year low, fueling bearish sentiment.
- **GBP Struggles Despite BoE Expectations:**
- **UK GDP contracted by 0.1% in January**, capping the pound’s upside.
- However, **expectations that the BoE will cut rates more slowly than the Fed** provide support for GBP/USD.
**📅 Key Events to Watch**
- **Monday:** US **Retail Sales & Empire State Manufacturing Index**.
- **Wednesday:** **FOMC meeting** → Market expects no rate change but will closely watch guidance.
- **Thursday:** **BoE meeting** → If policymakers signal slower rate cuts, GBP could strengthen.
**📈 Trading Strategy & Takeaways**
- **Bullish bias above 1.29300** if the dollar remains under pressure.
- **Break above 1.29400** could see GBP/USD testing **1.3050** in the short term.
- **If 1.29000 breaks,** watch for a potential dip toward **1.28500** before buyers step in.
- **Major volatility expected midweek** with FOMC & BoE—trade cautiously!
📢 **Final Word:** GBP/USD remains in a tug-of-war between a weak USD and soft UK data. Stay patient and wait for confirmation before making moves! 💹🔥 #Forex #GBPUSD

Bullish week!!! Happy long week!!
It's looking like a bullish week a great setup yesterday. And few more sniping and will see and
Entry:148.191
SL:148.054
TP:148.790

SWING IDEA - SAILSAIL Stock Technical Analysis
Steel Authority of India Limited ( NSE:SAIL ) has been consolidating around the 95 resistance level for over a year. After multiple attempts, the stock finally broke out above this level in January 2024, turning it into a strong support zone.
Following the breakout, SAIL surged to a peak of 175, marking an 85% gain. However, the stock then saw a sharp retracement, correcting by nearly 47% and revisiting the rising trendline support around the 100-105 range. This level, which previously acted as resistance, has now become a critical demand zone.
Currently, SAIL is showing signs of renewed bullish momentum, bouncing off its trendline support and forming a potential reversal. The weekly MACD crossover, observed in the chart, further reinforces a trend reversal signal. Additionally, a short-term upside target of 12% is indicated, while a long-term potential target of 76% upside is visible in the chart, aligning with the previous swing high.
The chart also highlights three take-profit targets:
Target 1: The first profit-taking zone, offering an initial opportunity to secure gains.
Target 2: A mid-level profit-taking zone, aligning with previous consolidation areas.
Target 3: The final take-profit level around 175, marking the prior high and a potential full exit point for long-term investors.
KEY OBSERVATIONS:
One-year resistance of 95 was decisively broken in January 2024
Stock surged 85% to a high of 175 before correcting 47%
100-105 level now acts as a strong rising trendline support
Weekly MACD crossover signals a bullish momentum shift
Three take-profit targets identified, with the final target at 175
Potential upside target of 76% from support levels, aligning with previous highs
RECOMMENDATION:
Based on this technical analysis, holding SAIL for the long term could be a strong strategy. The potential returns include:
12% upside in the short term
76% upside from current levels, targeting previous highs around 175
This analysis presents a compelling buying opportunity in SAIL, fueled by its breakout, support validation, and momentum reversal.
IMPORTANT NOTE:
Investors should be aware that there is a chance the stock may retest the 100-105 support level before resuming its upward trajectory. This potential pullback should be carefully monitored, and investment strategies should be adjusted accordingly.
DISCLAIMER: This analysis is for educational and informational purposes only and should not be considered as financial advice. Technical indicators and historical data are not guarantees of future performance. Investors should conduct thorough research, assess risk tolerance, and consult a financial advisor before making any investment decisions.

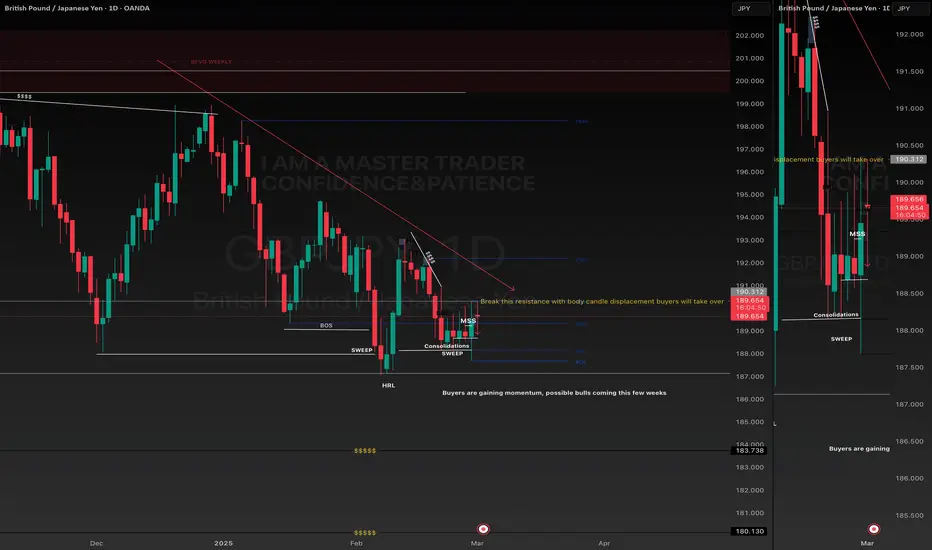
GBPJPY possible market shiftPrice fails to make swing low after sweeping all liquidities, price consolidates last week, buyers now are gaining momentum ? Possible if a body of a candle breaks Resistance
Solana (SOL) Holding Strong – Can It Reclaim $200?Solana (SOL/USDT) is currently testing a critical support zone around $140, aligning with a long-term ascending trendline that has provided strong support in previous market cycles. The 50-week EMA ($168.03) is also acting as dynamic resistance, making this an important decision point for the market.
The recent pullback from resistance at the previous ATH zone suggests some profit-taking, but if SOL can hold this key support level, a bullish reversal could follow, pushing prices back toward $200+ in the coming weeks.
However, a break below $140 could lead to a deeper retracement toward the trendline support around $100-$120.

USDT.D at 5.76% Key Level to Watch for Crypto Market “BOTTOM”Hey everyone! 👋 Let’s talk about a critical level on the USDT.D chart (Tether Dominance) that could signal a major opportunity for crypto traders. If you’re looking to long Bitcoin, altcoins, or other crypto assets, this is the area you need to watch closely: 5.76%.
Why is 5.76% So Important? 🤔
USDT.D measures the dominance of Tether (USDT) in the crypto market. When USDT dominance drops, it typically means money is flowing out of stablecoins (like USDT) and into riskier assets like Bitcoin, Ethereum, and altcoins. In simpler terms: a drop in USDT.D often signals a pump in the crypto market!
Right now, the 5.76% level on the USDT.D chart (as shown in the image) is a key support zone. You can see it’s been tested before, and it aligns with historical bottoms in the crypto market. When USDT.D hits this level, it often marks a turning point—a bottom for the crypto market—where prices of BTC, alts, and other assets start to rally.
What Does This Mean for Traders? 📈
If USDT.D reaches 5.76% and shows signs of reversing (like a bounce or consolidation), it’s a strong signal that the crypto market is ready to pump. Here’s why:
• Money Flow: A drop to 5.76% suggests investors are moving funds from USDT back into crypto assets, driving up prices.
• Market Bottom: This level has historically acted as a floor for USDT.D, meaning the crypto market could be at its lowest point before a big rally.
• Opportunity to Long: When USDT.D hits this zone, it’s a great area to consider longing Bitcoin, altcoins, or other crypto assets, as they’re likely to start pumping.
How to Play This? ⚡
1. Watch the 5.76% Level: Keep an eye on USDT.D as it approaches this key support. Look for signs of a bounce or reversal (like a strong candlestick pattern or increased volume).
2. Confirm with Other Indicators: Check Bitcoin’s chart, altcoin price action, or other indicators (like RSI or MACD) to confirm the market is turning bullish.
3. Take Action: If USDT.D hits 5.76% and starts to reverse, consider longing your favorite crypto assets. This could be the start of a big pump for BTC, alts, and the entire market!
Why This Matters for the Whole Market 🌍
The 5.76% level isn’t just about USDT.D—it’s a signal for the entire crypto market. When Tether dominance drops to this area, it often means the market has found a bottom, and we’re about to see a wave of bullish momentum. Whether you’re trading BTC, ETH, or smaller altcoins, this could be the best area to jump in for a long position.
Final Thoughts 💡
The 5.76% level on USDT.D is the area to watch right now. It’s historically been a bottom for the crypto market, and if we hit it again, we could see a massive pump across all crypto assets. Stay patient, wait for confirmation, and get ready to take advantage of this opportunity! 🚀
What do you think? Are you watching this level too? Let’s discuss in the comments! 👇
Why This Explanation Works:
1. Simple Language: It avoids jargon and explains USDT.D in a way anyone can understand.
2. Actionable Advice: It tells people exactly what to watch (5.76%) and what to do (long crypto assets).
3. Visual Reference: It ties into the chart you shared, pointing out the 5.76% level.
4. Engagement: It invites discussion, encouraging others to share their thoughts.
5. Big Picture: It connects the USDT.D level to the broader crypto market, making it relevant to all traders.

Currently making LH LLs but..Weekly & Monthly Closing above 60.67 would be a Positive Sign.
Though currently making LH LLs, but
Bullish Divergence on Daily TF is another Positive Sign.
Upside levels can be around 65 - 67
However, in extreme pressure, it may touch around 53 - 55
& that would be an Important Support level.

JOURNAL FOR MGC1!Today I placed two trades on MGC1! my first entry was a sell scalp which was strictly a technical entry and the second was the buy back up because it goes with the bias of gold being bullish, and inflation fears, so for each trade Ive wait on a area of consolidation (order block) then wait on a break out in this case after that impulsive move to the downside on gold I waited for an area of support to form with rejections of pushing lower at this point an order block should start forming, I tend to get a better structure of an order block forming on the 5min, once a bullish engulfing to print above the last high then I take the trade, today I had no draw down my entry was precise!

#SUNDOGUSDT remains in a strong uptrend📈 LONG BYBIT:SUNDOGUSDT.P from $0.04070
🛡 Stop Loss: $0.04013
⏱ 15M Timeframe
✅ Overview:
➡️ BYBIT:SUNDOGUSDT.P is showing strong bullish momentum after breaking out of a consolidation zone. The price is holding above the key $0.04070 level.
➡️ The highest liquidity area (POC) is at $0.03527, confirming strong buyer interest and support for the current trend.
➡️ A volume spike in recent candles suggests increased buying activity, increasing the probability of reaching target levels.
➡️ If the price breaks the $0.04150 resistance, the uptrend could accelerate towards higher levels.
⚡ Plan:
➡️ Enter long from $0.04070 upon confirmation of breakout.
➡️ Risk management with Stop-Loss at $0.04013, placed below the nearest support level.
🎯 TP Targets:
💎 TP1: $0.04150
🔥 TP2: $0.04205
🚀 BYBIT:SUNDOGUSDT.P remains in a strong uptrend, and a breakout above $0.04150 could lead to further gains.

ETH ANALYSIS🔮 #ETH Analysis - Update 🚀🚀
💲 WAs we can see that #ETH took a good support from its major support lime. We could expect a good move after it cross $3000. After that we could target for $4000.
💸Current Price -- $2700
📈Target Price -- $3000
⁉️ What to do?
- We have marked crucial levels in the chart . We can trade according to the chart and make some profits. 🚀💸
#ETH #Cryptocurrency #Breakout #DYOR

FCPO1! PUSHING UP AFTER BOS, POTENTIAL TO MOVE TO SUPPLY NEARBYSOY BEAN 4h channel and potential towards completing the triple bottom pattern

Gold (XAU/USD) Surges Past 50% FIB – Is $2,000 Next?
📌 Key Breakthrough in Gold!
Gold (XAU/USD) has just blasted through the 50% Fibonacci retracement level, a critical discount zone where buyers historically step in. This breakout has triggered a wave of bullish momentum, pushing price towards key resistance levels.
🔎 Technical Breakdown:
✅ 50% FIB Breakout: Price has cleared this key retracement level, signaling strong buyer demand.
✅ Key Resistance Ahead: The $2,765 zone remains the next major hurdle—a breakout here could accelerate price toward $2,825.
✅ Support Zone: The $2,745 level serves as immediate support, acting as a potential pullback area.
✅ RSI Overbought? The RSI is approaching overbought conditions, meaning a short-term consolidation could occur.
✅ MACD Crossover Incoming? A bullish MACD crossover is forming, reinforcing the upward momentum.
⚡ What’s Next?
If gold holds above the 50% FIB level and breaks $2,765. with strong volume, a push toward $2,825+ could be in play. However, failure to hold this breakout could trigger a pullback to $2.700 or lower.
📊 Will gold continue its bullish run, or is a pullback incoming? Drop your thoughts below! 👇
🚨 This is not financial advice. Always do your own research before making trading decisions.

The COMP is very interestingThe comp is at a great point to climb again, check this currency in the 2 hour time frame and don't miss out. Don't forget to like and subscribe

Not coin is fire !!Not coin currency chart in Time Daily is the best place to enter, be sure to enter because the bull market is very close.

JAN. 23, 2025 - BTC (4 HR) ROOF PATTERN ANALYSISJan. 25, 2025 - We're back at it this time on the 4HR time frame. We have a roof pattern playing out and we're going to analyze the possible price action.

PERSISTENT - Strong MomentumPersistent Systems Ltd. (NSE: PERSISTENT) has recently captured the attention of market analysts and investors, showcasing a powerful bullish trend that is hard to ignore. The stock's recent price movements and volume spikes indicate a robust upward momentum, making it a compelling prospect for traders and investors alike.
Key Highlights:
Bullish Momentum and Strong Bullish Candle
The chart for Persistent Systems Ltd. reveals clear signs of bullish momentum, exemplified by a strong bullish candle that has formed recently. This particular candle stands out due to its significant size compared to preceding ones, indicating substantial upward price movement and strong buying interest. The formation of such a bullish candle is often a precursor to continued upward trends, suggesting that the stock may have more room to grow.
RSI Breakout
Although the chart does not explicitly display the RSI (Relative Strength Index), the overall price action hints at a possible RSI breakout. Typically, an RSI breakout occurs when the index crosses above the 70 mark, signaling overbought conditions and strong bullish sentiment. This potential RSI breakout reinforces the positive outlook for Persistent Systems Ltd., indicating that the stock may continue to attract buyers.
5-Day Volume Breakout
A closer look at the volume bars at the bottom of the chart reveals a significant increase in trading volume over the past five days. This 5-day volume breakout is a bullish signal, as it demonstrates growing market participation and heightened interest in the stock. Higher trading volumes often add credibility to price movements, suggesting that the recent upward trend is supported by strong investor activity.
5X Volume Breakout and Price Change
The chart also highlights a remarkable 5X volume breakout, where the trading volume on the most recent day is five times higher than the average volume. This surge in volume, coupled with a substantial price change, underscores the strong buying interest and bullish sentiment surrounding Persistent Systems Ltd. Such a pronounced increase in both volume and price is indicative of a robust uptrend, suggesting that the stock may continue to perform well in the near term.
Conclusion
Persistent Systems Ltd. is currently riding a wave of bullish momentum, with several key indicators pointing to continued strength in the stock. The strong bullish candle, potential RSI breakout, 5-day volume breakout, and 5X volume breakout with a significant price change all contribute to a positive market outlook for the company.
For traders and investors looking to capitalize on this bullish trend, Persistent Systems Ltd. offers a compelling opportunity. The stock's recent performance, backed by strong technical signals, suggests that it may continue to rise in the coming days. As always, it's important to monitor market conditions and conduct thorough research before making any investment decisions.
Persistent Systems Ltd. is certainly one to watch as it continues to make waves in the market. 📈🚀

NAS100USD: Analyzing Bullish Institutional Order FlowGreetings Traders,
In today’s analysis of NAS100USD, we observe the continuation of bullish institutional order flow, presenting potential opportunities to align with this trend. The focus is on identifying evidence that supports taking bullish setups with proper confirmations.
Key Observations:
1. Institutional Support Zone:
Price is currently resting at a bullish order block, a strong institutional support zone.
This order block is reinforced by an FVG (Fair Value Gap) positioned above it, further solidifying its significance.
2. Liquidity Dynamics:
Sell stops resting below a recent low have been taken out, aligning with the order block.
This suggests institutional activity, as liquidity has been created for order pairing (buying against sell-side liquidity).
3. Price Positioning:
Despite being at a premium price relative to the intermediate high and low, there is no strong evidence to suggest a continuation into a discount zone.
The liquidity sweep below the low strengthens the case for a bullish reversal from the current level.
Trading Plan:
Entry Strategy:
Await confirmation at the current institutional support zone before taking buy setups.
Target Levels:
Focus on liquidity pools resting at the highs, as these are likely institutional profit-taking zones.
By aligning with institutional order flow and leveraging evidence of liquidity sweeps and strong support zones, we aim to capitalize on bullish momentum. Always remain vigilant and ensure confirmation before entering positions.
Kind Regards,
The Architect

DOGE Ready to Soar Breakout Confirmed with Consolidation AboveBreakout Confirmed
The price has broken out of the symmetrical triangle pattern on the 4-hour timeframe, indicating a bullish momentum.
Higher Time Frame Alignment
If higher time frames (like daily or weekly) are also showing bullish signs, it strengthens the breakout's validity and suggests the trend is likely to continue upwards.
Consolidation Above Trendline
The price is consolidating above the previous resistance (upper trendline), which has now turned into support.
This consolidation is a healthy sign of market strength, as it allows buyers to gain control before the next leg up.
Next Move
A breakout from this consolidation phase would confirm the continuation of the uptrend.
Immediate targets are $0.42 and $0.45, with a potential to move toward $0.50 if bullish momentum sustains.
Entry Strategy
Wait for a bullish breakout from the consolidation with increased volume for a safer entry.
Place a stop-loss just below the trendline or consolidation zone.
Risk Management
Maintain proper risk-reward ratios to account for any potential pullbacks.

If the 95-97K support holds strong I'll stay BullishThis resistance zone is well known. If the support 95-97K holds strong I will stay bullish
Stay vigilent
Stay safe
Education content

WOO ANALYSIS📊 #WOO Analysis
✅As we can see that #WOO was consolidating in a small range but right now there is a breakout or major resistance level. We would see a good bullish movement in #WOO
👀Current Price: $0.2490
🚀 Target Price: $0.2880
⚡️What to do ?
👀Keep an eye on #WOO price action and volume. We can trade according to the chart and make some profits⚡️⚡️
#WOO #Cryptocurrency #TechnicalAnalysis #DYOR

CLNE Option Activity Looks Promising There was more positive news on CLNE today and a lot of buying activity with a single order of 5,000 on .CLNE260116C4. 80% of the call activity happened at or above ask. 51% of calls had a delta between 0.41 and 0.60. I like longer exp dates and this time that's where most of the buying is. I'll most likely open a position Friday. I'm already long in shares. They do have some financial concerns from tax credits possibly ending and a few other things. Either way it may be a good short term play. Always watch volume and use some form of stop or hedge.
