XCN has serious breakout potential on the 5th wave count.XCN went on a massive run over the past few months, followed by a significant decline along with the overall crypto market. The chart, however, is telling a story of what could become a massive move to the upside on the 5th wave of the wedge pattern's internal wave count.
I wouldn't count XCN out just yet. I think good things are coming to XCN in the future, even if the 5th wave ends up failing this time around.
Good luck, and always use a stop loss!
Bullishpattern

ADA/USDT at Decision Point – Major Move Incoming!ADA/USDT is testing a major resistance zone after retesting the 100 EMA and bouncing from the rising support line. The price remains in a long-term symmetrical triangle, with the resistance trendline as a key breakout level.
The Stochastic RSI is recovering from oversold levels, indicating potential bullish momentum. A breakout above resistance could trigger a strong uptrend continuation, while rejection may lead to a pullback toward support.

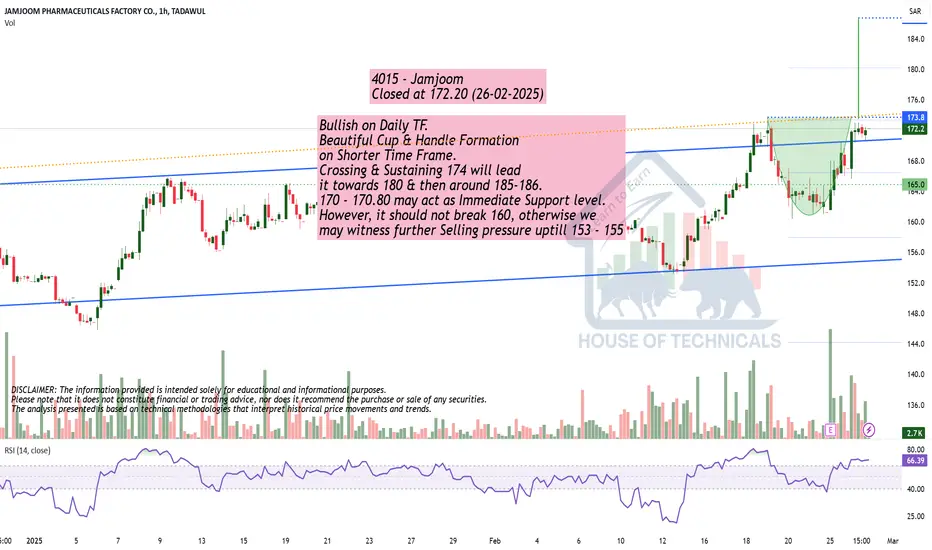
Bullish on Daily TF.Bullish on Daily TF.
Beautiful Cup & Handle Formation
on Shorter Time Frame.
Crossing & Sustaining 174 will lead
it towards 180 & then around 185-186.
170 - 170.80 may act as Immediate Support level.
However, it should not break 160, otherwise we
may witness further Selling pressure uptill 153 - 155
MINA ANALYSIS📊 ##MINA Analysis
✅There is a formation of Descending triangle pattern on weekly chart. Also #MINA is trading around its all time low level. If the price sustains here and give a bullish move then we could expect a bullish move otherwise we would see more dip.
👀Current Price: $0.3220
⚡️What to do ?
👀Keep an eye on ##MINA price action and volume. We can trade according to the chart and make some profits⚡️⚡️
##MINA #Cryptocurrency #TechnicalAnalysis #DYOR

Is Bitcoin Topping Out? Critical Levels to WatchSince the low of $15,476 on November 21, 2022, Bitcoin has surged to an all-time high of $109,588 on January 20, 2025. That’s an incredible +608% increase over 791 days. We also hit the long-anticipated $100K mark. But for almost three months now, Bitcoin has been stuck in a range between $90K and the all-time high, showing some indecision in the market.
Looking Back: Market Structure & Trends
Bitcoin spent over 250 days consolidating between $50K and $70K before finally breaking out in November 2024, right around the U.S. election. That breakout triggered a massive rally, pushing Bitcoin to 100K in just one month. Since then, bulls and bears have been battling it out, trying to establish control over this crucial psychological level.
A look at the pitchfork tool shows that Bitcoin has been rejected at the 0.618, 0.666, and 0.786 levels multiple times while trying to push higher. Recently, we lost the median line of the pitchfork and dropped below 100K, suggesting bullish momentum is fading. The 233 SMA/EMA on the 4-hour TF as well as the 21 EMA/MA on the daily TF has also flipped into resistance, adding to the bearish pressure.
Is February Shaping Up to Be a Bearish Month?
If we compare the current cycle to the 2020 bull market, the price action looks similar, forming a top where Bitcoin struggles to break higher. February could bring a healthy correction before any new leg up.
Key Support Zones & Confluences
Here’s where we could see solid support:
Unfilled CME Gap at $77,930 – Historically, Bitcoin tends to fill these gaps over time
Pitchfork Lower Support Line (~$80K) – If Bitcoin drops, this level aligns with multiple confluences by late February or early March
Fib Speed Fan (0.618 from $50K to ATH) – Perfectly lines up with the pitchfork lower support around $80K
Trend-Based Fibonacci Extension (1.618) – Another confluence at the $79K mark
Fib Retracement (0.5 from $50K to ATH) – Adds more support at $79.3K
Negative Fibonacci Retracement (-0.618) – Lands right at the open gap, reinforcing this zone
Daily 233 EMA/MA – Sitting at $81.3K and $76.4K, further supporting this region
Key Support Zone: $80K - $78K – With all these confluences, this is a strong area for a potential long setup
Additional Support Zone: FWB:88K - $86K – Another important region to watch for a bounce
Resistance Levels & Confluences
Psychological Resistance at 100K – A major battle zone between bulls and bears
Daily 21 EMA/MA (~$99.5K - 101K) – A key resistance level that could cap any upward movement
233 SMA/EMA on the 4H Timeframe – Now acting as resistance, adding pressure to the downside
Potential Trade Setups
Long Setup #1: A potential entry from FWB:88K - $86K
Long Setup #2: $80K - $78K support zone with confirmation could present a high-probability trade
Final Thoughts
Bitcoin is facing strong resistance at 100K, with multiple technical indicators suggesting a possible pullback. While the bigger trend remains bullish, February might bring a correction, providing great long opportunities around the FWB:88K - $86K and $80K - $78K region. Keep an eye on key support zones and look for confirmation signals before jumping into trades.
New Indicator Release
The 4H, Daily, and Weekly support zones seen on the charts are from my new indicator, which I released for free a few days ago. Feel free to check it out and incorporate it into your analysis.

#SHELLUSDT – Bullish Scenario, Expecting a Breakout📈 LONG BYBIT:SHELLUSDT.P from $0.7000
🛡 Stop Loss: $0.6671
⏱ 1H Timeframe
⚡ Trade Plan:
✅ The BYBIT:SHELLUSDT.P price is showing strong momentum after breaking out of a consolidation zone.
✅ The asset has broken above $0.6957 and is holding above this level, signaling a potential continuation of the uptrend.
✅ Increasing volume confirms buyer activity.
🎯 TP Targets:
💎 TP 1: $0.7350
🔥 TP 2: $0.7700
📢 Holding above $0.7000 would confirm further bullish movement.
📢 POC at $0.4671 is far below the current price, indicating a trend shift.
📢 Increasing volume supports the bullish case.
📢 Securing partial profits at TP1 ($0.7350) is a smart risk-management strategy.
🚀 BYBIT:SHELLUSDT.P remains in an uptrend – monitoring for continuation and securing profits at TP levels!

Bitcoin (BTC/USDT) DAILY MAKE IT OR BREAK IT?With volatility increasing, the next move could set the tone for the coming weeks. Will BTC break out and push higher, or face rejection and retrace? Watch closely! 👀
What’s your bias? Bullish or bearish? Let me know in the comments!

Up or DownAs we can see in the chart, on December 24th, Bitcoin's price reached its climax, moving cleanly without further structures to follow. Since then, the price has formed micro-structures and is now attempting to create a much larger one that would allow it to advance—a megaphone pattern (D).
If this megaphone were completed with an upward move today, it could catapult the price above $149K. With each passing day, the potential price target increases. However, to form the full megaphone, a base had to be established, which is what we are seeing now. On December 24th, a structure was formed that facilitates a return to the $107K level and also helps determine the price range where the megaphone's base (C) could be finalized, between $86K and $77.6K.
Today, a bull flag (B) has formed within a falling wedge (A), and the price movements align with this pattern, which aims to return to the apex before continuing the upward move. However, even if the price surges due to the bull flag breakout, I believe it might retrace again to continue building the base of the megaphone, which is quite broad.

ETHUSD BULLISH BATHarmonic Pattern Trading Strategy:
1. Combine patterns with 2-3 confirmations (e.g., MA, BB, RSI, Stoch) for increased accuracy.
2. Implement proper risk management.
3. Limit exposure to 3% of capital per trade.
4. Exercise caution: Not every Harmonic Pattern presents a good trading opportunity.
5. Conduct thorough diligence and analysis before trading.
Disciplined approach = Enhanced edge.

Ready to Skyrocket? Story/USDT at Key Level!The chart shows a strong uptrend, respecting an ascending trendline with three confirmed touches (1, 2, and 3). The price is currently testing a minor resistance zone, which has previously acted as a rejection point.
At this moment, the price is near the trendline for a potential fourth retest (marked as "4?"). If the trendline holds, it could act as a springboard for another upward move, potentially breaking the minor resistance and continuing the bullish trend.

USD/CHF Poised for a Bullish Reversal at Key SupportThe USD/CHF pair is currently trading near a significant support level around 0.8950, with bullish signals emerging. The harmonic Bat pattern suggests a potential reversal, aligning with historical price reactions at similar levels. Additionally, the presence of green buy markers and RSI indicators approaching oversold conditions indicate possible upward momentum.
If price sustains above the 0.8950 region, a bullish move towards 0.9000 and beyond could unfold, with further resistance around 0.9120. Confirmation of reversal signs, such as bullish candlestick formations and RSI divergence, will strengthen the case for a recovery.

#LDOUSDT: Triangle Breakout – Next Move?Market Overview:
#LDOUSDT has been in a strong uptrend and recently formed a triangle pattern on the 1-hour timeframe. This pattern typically signals trend continuation, and we just witnessed a breakout!
Key Observations:
🔹 Triangle breakout confirmed – bullish signal!
🔹 Resistance Level: Watch for a clean break for further confirmation.
🔹 Potential Targets (TPs): Higher highs expected if momentum holds.
Strategy:
🔹 If price retests the breakout zone and holds, we could see a strong bullish continuation.
🔹 Invalidation: If price falls back into the pattern, we may see a fakeout scenario.
What’s your take? Will #LDOUSDT pump higher or is this a bull trap? Share your thoughts below!
Follow for more chart updates, trade ideas, and market insights!

COQUSDT: The Market Squeeze—Reversal or Breakdown?COQUSDT at a Turning Point: Is the Bottom in?
COQUSDT is sitting at a critical juncture, hovering near $0.007427, a level that’s still 56% above its all-time low but nearly 89% off its peak. After weeks of sideways action, buy volumes have surged at key points, hinting at possible accumulation. But with RSI (14) at 35.6, are we witnessing the final stages of oversold conditions, or is there more downside ahead?
The 200-day MA looms at $0.010096, far above the current price, showing just how deeply this asset has been discounted. Momentum indicators suggest that COQUSDT is battling heavy resistance at $0.008245, a level that could determine the next leg of movement. The question is: Are bulls strong enough to flip this level into support, or will bears force a retest of the lower range?
With a mix of increased buy-side activity and lingering bearish pressure, the market is at a crucial decision point. Will we see a breakout to test the 100-day MA at $0.009132, or is another sell-off lurking around the corner? Buckle up—this could be the moment traders have been waiting for.
Roadmap: COQUSDT’s Recent Patterns – Are We Seeing a Reversal?
The market never lies—price action is the ultimate storyteller. Over the past few sessions, COQUSDT has been flashing some intriguing signals. Let's break down the key patterns that played out, separating the noise from the real moves.
February 21, 20:00 UTC – Buy Volumes Surge
A major Buy Volumes pattern kicked in as COQUSDT opened at $0.008589 and closed higher at $0.008975, testing resistance near $0.009193. The setup suggested an upward continuation, but was it enough?
February 21, 21:00 UTC – Confirmation of Strength
Bulls doubled down with another Increased Buy Volumes pattern, pushing the close up to $0.009475, hitting a session high of $0.009639. This confirmed the previous signal—buyers were stepping in aggressively.
February 22, 08:00 UTC – VSA Buy Pattern 4 Appears
The formation of a VSA Manipulation Buy Pattern 4th hinted at accumulation. The price action showed a minor retrace before stabilizing at $0.009158. However, the real test was ahead: Would buyers maintain control?
February 23, 13:00 UTC – A Battle at Resistance
A powerful VSA Manipulation Buy Pattern 3rd formed, keeping the buy-side momentum alive. The asset climbed further, closing at $0.009186—almost a direct follow-through from the prior pattern.
February 23, 16:00 UTC – Bears Strike Back
A major shift came as a Sell Volumes Max pattern emerged. The price reversed hard, closing down at $0.008515, marking the first sign of bearish dominance since the rally began.
February 24, 15:00 UTC – Sell Pressure Increases
Following the sell-off, the next candle confirmed more downside pressure with an Increased Sell Volumes pattern. The close at $0.007824 meant the bulls had officially lost their grip—momentum had shifted.
February 24, 16:00 UTC – Buyers Attempt a Comeback
Just when things looked bleak, a Buy Volumes Max pattern emerged. The asset rebounded slightly, closing at $0.007895, attempting to reclaim lost ground.
The takeaway? The buy-side momentum played out correctly up until February 23, proving that the earlier bullish patterns were accurate indicators of the rally. However, the sell signals on February 23-24 completely flipped the script, showing how fast sentiment can shift.
What’s Next? If buy volumes continue to build, we could see another attempt at breaking resistance around $0.008245. But if the sellers maintain control, expect further downside pressure. Stay sharp—this market is moving fast.
Technical & Price Action Analysis: Key Levels to Watch
Levels don’t lie—price respects structure, and smart money knows where liquidity is stacked. Here’s the real deal on support and resistance for COQUSDT. If a level doesn’t hold, expect it to flip into a new battlefield for bulls and bears.
Support Levels:
$0.005691 – First line of defense. If buyers don’t step in, we could see a deeper dive.
$0.00551 – The last standard support before things get ugly. A break below could open up a liquidity grab.
Resistance Levels:
$0.008245 – Immediate ceiling. Needs a strong push to flip bullish.
$0.009099 – A key decision point. Rejection here and sellers will pile in.
$0.010465 – A major pivot area. Break and hold above? We’re talking trend shift.
$0.011432 – Bulls need to own this level for sustained momentum.
$0.012347 – The breakout zone. If we see clean closes above, the game changes.
Powerful Support Levels:
$0.01302 – The fortress. If COQUSDT ever gets back above this, it’s game on for bulls.
Remember: If these supports fail, they become resistance. That’s how price action works—liquidity zones shift, and traders reposition. Watch the reactions, manage risk, and don’t get caught on the wrong side of the play.
Trading Strategies Using Fibonacci Rays
Understanding price action means reacting to movement, not predicting levels. My proprietary Fibonacci Rays method helps identify dynamic zones where price interacts before making its next big move. Each ray serves as a pivot, defining whether price rejects or continues.
These rays are already drawn on your chart, intersecting with VSA patterns and Moving Averages, giving you a structured roadmap for trades. Let’s break down the possible scenarios:
Optimistic Scenario: Breakout & Trend Continuation
If COQUSDT interacts with a key ray and confirms bullish movement, we ride the trend from one ray to the next, securing targets along the way.
Long Entry: Above $0.008245 (First Resistance)
Target 1: $0.009099
Target 2: $0.010465
Target 3: $0.011432 (Major trend shift)
Invalidation: Below $0.008000 (Rejection from ray)
Aggressive Long: If price reclaims MA50 ($0.008452)
Target 1: $0.009132 (MA100)
Target 2: $0.010096 (MA200)
Invalidation: Close below MA50 with volume spike
Pessimistic Scenario: Rejection & Trend Weakness
If price interacts with a ray but fails to confirm strength, we look for short opportunities targeting the next dynamic level.
Short Entry: Below $0.008245 (Failed breakout)
Target 1: $0.007427 (Current support)
Target 2: $0.005691 (Deeper correction zone)
Invalidation: Close above $0.008500 with strong momentum
Breakdown Short: If price loses MA50 and MA100 together
Target 1: $0.00551 (Final major support)
Invalidation: Price reclaims MA100 & MA50 with buy volume
💡 Key Takeaway: Positions should be taken only after price interacts with a ray and confirms movement. No blind entries—wait for market structure to guide you. Every ray crossover is a checkpoint, where price moves from one level to the next, giving traders a clear trade flow.
What’s Next? Let’s Talk Strategy!
Trading is all about understanding key reaction zones—that’s why I lay everything out before price makes its move. If you found this breakdown useful, make sure to Boost this idea and save it—check back later and see how price respects the levels. That’s how you sharpen your edge in the market.
Got questions? Drop them in the comments! I always check and reply when I can. Let’s discuss setups, levels, or anything that needs clarification.
My Fibonacci Rays indicator does all the heavy lifting—mapping levels and rays automatically. It’s Private, but if you’re interested in using it, shoot me a DM.
Want a breakdown for your favorite asset? I can analyze any chart—some ideas I post for free, while others we can discuss privately. If you have something specific in mind, let’s talk!
And remember—these rays work on ANY asset. If you want me to chart a specific one, hit Boost and drop a comment—I’ll get to it when I can.
If you’re not following me yet, now’s the time. Stay ahead of the market with my latest updates right here on TradingView. 🚀

(BTC/USD) 4-hour analysis on the Bitstamp exchange,(BTC/USD) 4-hour analysis on the Bitstamp exchange, incorporating various technical indicators and projections:
• Support & Demand Zones:
• A red zone around 93,278 - 95,202, indicating strong support.
• A yellow zone around 98,610, suggesting intermediate resistance.
• A blue zone at 105,705, marking a major resistance level.
• Black Dots: Represent key swing highs, acting as resistance levels.
• Blue Dots: Represent swing lows, indicating potential support.
Price Projection & Analysis:
• The chart suggests a bullish structure, with price expected to bounce from the support zone (95,293 - 95,322) and move upwards.
• If the price breaks the 98,610 resistance, further upside towards 102,057 and potentially 105,705 is expected.
• If the support at 95,202 fails, the price may decline towards 93,278 - 92,000.

potential trend reversal / buy on chfjpyTREND REVERSAL
double bottom
ChfJPY has been falling for a while now; its currently at a major support on Hourly and daily timeframe and it might be a chance for a reversal

DOGE ANALYSIS📊 #DOGE Analysis : Update
✅There was a formation of Falling Wedge Pattern on daily chart.
We could expect bullish move if #DOGE breaks the pattern and also breaks the major resistance zone.
👀Current Price: $0.2436
🚀 Target Price: $0.3400
⚡️What to do ?
👀Keep an eye on #DOGE price action and volume. We can trade according to the chart and make some profits⚡️⚡️
#DOGE #Cryptocurrency #TechnicalAnalysis #DYOR

Peanut the Squirrel (PNUT/USDT) - Bullish Setup 1HPNUT is showing strong bullish signals on the 1H chart. Several technical factors suggest a potential upward move:

iExec RLC (RLC/USDT) - Key Levels To Watch 1HRLC is showing strong bullish momentum, currently trading around $1.34, with a potential breakout on the horizon.
A breakout above resistance with strong volume could lead to an explosive move!
Keep an eye on price action and confirmation signals.

BNX is not for shorting!!!YET..Hi everyone,
BNX made a massive pump of almost 35%..
The coin is still on a uptrend!
Open a short position right now would be harmfull for your portofolio..
Of course is depends of what percentage you are after..
Trade safe!

BNX Soars to New Heights: A Strong Uptrend Signals Promising FutHi everyone!
BNX is on uptrend and is the perfect moment to buy with price target 1.23.
Shorting this coin would be a massive mistake as smarts money plan is to sweep the shorts!!
Chart looks bearish but don't fall in to their trap!
If you open a long position make sure you are covered for at least 25% drop. Avoid the high leverage! Remember profit is greater that loss.
We are not day traders. just profitable traders!
Our job is to identify the trend.
Trade safe

EUR/USD forex trading chart showing a bullish market analysis.This is a EUR/USD forex trading chart showing a bullish market analysis with projected upward movement.
Key Points:
• Support Levels: 1.04130 - 1.04294 (potential strong buy zone).
• Resistance Levels: 1.05908, 1.07833, and 1.08000 (key targets for buyers).
• Expected Movement:
• Price may stay around 1.045 - 1.059 before pushing towards 1.078.
• A bullish channel is forming, indicating an uptrend continuation.
This analysis suggests long (buy) trade opportunities, especially around 1.045, targeting 1.078 - 1.080 as the next resistance zone.

The SECRET to BULLISH CHART PATTERNS | EducationBullish chart patterns play out towards the upside... atleast most of the time.
In some cases, a bullish pattern forms - seemingly strong- but ends up going the complete opposite direction. There is a way to navigate this very frustrating outcome - by waiting for confirmation.
Through waiting a little longer, you will surely reduce the profits - but this greatly reduces the risk of playing a "failed" pattern.
Keep a close eye on this bullish chart pattern forming on SUI:
__________________________

Sklz to 10.80-13.49$Coiling up for a reversal to end the week in the green setting up for a two week bull run towards ER? Sklz has been steadily increasing over the last year.
Last target of 7.34 HIT 7.84 high previous idea.
