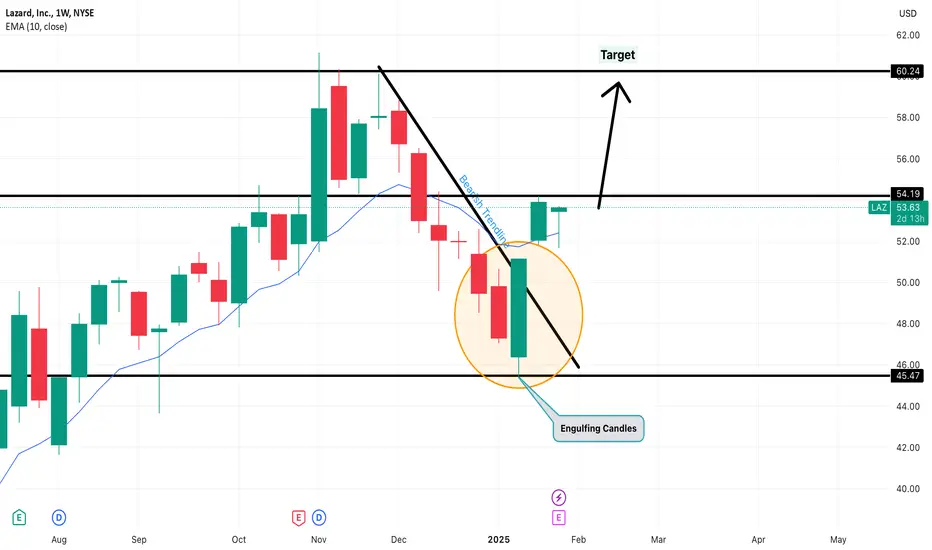
LAZ is bullish to 60The stock has showcased bullish engulfing pattern and ready to reach the target of 60.
It has also breached the bearish trendline and ready to move up with the stop below WEMA 10.
Bullishpattern
NVDA Long After Nearly 20% DeclineNASDAQ:NVDA got hit hard by the huge sell-off today and because of the DeepSeek release. The Chinese GPT alternative claims to be better or at least as good as GPT using way less and way older NVDA GPUs. If true, this could create a lot of stress on the CapEx of big US tech companies because the managers will ask their employees why they needed to buy all of those expensive GPUs if they are not necessary at all. That would lead to shrinking sales at NVDA. So far, so bad.
But, we should not forget that misinformation is always a thing when talking about Chinese companies and claims. I also don't think that the result of such a claim would be that tech companies lower their CapEx and start doing less. Instead they will use this to understand how DeepSeek works and how they can be better than their Chinese counterpart using way more powerful GPUs. So, this huge sell-off could trigger a bounce from this confluence support. We perfectly hit the upward trend and a support level at $118. So, be brave and test the water.
Target Zones
$131
$140
Support Zones
$118

XCN 21-Minute Chart: The 39-Bar Channel & 151-Bar Cycle
RSI trends, and sniper entries on XCN. Mathematics in motion. 🧵👇
1️⃣ The 39-Bar Repeating Pattern: A Natural Channel?
🔹 We have now twice confirmed the 39-bar distance between key pivot points.
🔹 This repeating structure creates a channel-like movement, meaning price is respecting mathematical rhythm rather than random fluctuations.
📏 Possible Implications:
• If price respects the 39-bar rhythm, we could anticipate future reactions at similar intervals.
• If it breaks the channel, a new phase begins.
👉 Watching how the next 39-bar reaction unfolds could define the next major move.
2️⃣ The 151-Bar Cycle: Structural Foundation
🔸 The 151-bar length aligns with previous reaction points.
🔸 This isn’t random—it suggests a deeper Fibonacci-based rhythm in the price action.
🔸 This means that larger trends could be forming within this timeframe, influencing both short-term entries and long-term positioning.
💡 If this 151-bar cycle holds, it could act as the primary macro structure, with 39-bar reactions acting as the substructure.
3️⃣ RSI Trends: Above 50 & Holding
✅ RSI is currently at 51.24, signaling:
• Momentum shift toward bullish territory.
• Confirmation of strength if it holds above 50.
• Next Fibonacci RSI level (61.8) could act as a resistance check.
📊 What to watch:
• RSI retesting 50 → If it holds, bullish continuation likely.
• RSI break above 61.8 → Stronger breakout confirmation.
4️⃣ What’s Next?
📈 Bullish Case:
• Price continues following the 39-bar channel structure toward the next Fibonacci resistance.
• RSI holds above 50, confirming momentum.
🔻 Bearish Case:
• Price breaks below the channel, rejecting the cycle structure.
• RSI loses 50, leading to a retest of lower Fibonacci levels.
🎯 Key focus: Will the 39-bar rhythm hold, or are we shifting into a new structural phase?
Final Thoughts: Precision in Market Cycles
This setup is not random—it’s about repeatable bar cycles, Fibonacci alignment, and momentum trends.
🔍 The math doesn’t lie—let’s see how this unfolds.
👉 Do you think the 39-bar structure will hold, or are we entering a new phase? Let’s discuss! 🗣️👇
-

It is time to buy on XAUHi everyone
you can open a position on XAU like this
Gold has gone through two major declines and now it's time to return to higher price levels.

NEIRO/USDT: A Hidden Gem Ready for a Massive 300% Breakout!📉 Current Position: NEIRO/USDT is finding strong support near the discount level, signaling a potential reversal. The price is consolidating after a prolonged downtrend, indicating possible smart money accumulation.
📊 Technical Setup:
✅ Support Zone: NEIRO is holding a key support level, preventing further downside. A bounce from here could ignite a powerful bullish reversal.
✅ Fair Value Gap (FVG) Re-Test: The first major target lies in the FVG resistance zone around $0.0010. A clean breakout above this level will confirm the bullish shift.
✅ Break of Resistance: If NEIRO decisively clears the FVG resistance, it unlocks an explosive move towards $0.0025 and eventually $0.0030, representing a 300% gain from current levels.
🔥 Investor Opportunity:
High Reward Potential: Breaking above resistance could lead to massive price appreciation, rewarding early investors.
Smart Money Accumulation: Price action suggests large players might already be positioning before the breakout.
Bullish Confluence: Multiple indicators support an upcoming surge, making this a prime investment opportunity.
💡 Final Thoughts: NEIRO/USDT is setting up for a monumental breakout. A push above $0.0010 could send it soaring toward $0.0030, delivering a 300%+ gain. This might be the perfect time to position ahead of the rally before the market catches on! 🚀📈

EURUSD Analysis: Bull IncomingHello everyone, starting this sunday with a EURUSD Long Analysis:
As we can see, we have recently entered a bullish trend and I believe we are really close to a great entry.
As seen on the chart, the bottom trendline and what was this months highest resistance (now hopefully a support) are really close to be reached. and if the EURUSD keeps following the same trend as it has for now, we should have a solid trade.
I expect price to reach 1.05559 where my TP will also be set.
I have set the SL at 1.03969 which leaves room for the trade to breathe in case of high volatility during Mondays NY Session, which leaves us with a 3.02 Risk/Reward.
Happy trading! Let me know your thoughts on this.

Bitcoin's Bullish Breakout: Targeting $126,500!
Introduction: Bitcoin (BTC) has recently experienced a significant price surge, reaching new heights. For those new to cryptocurrency trading, understanding this movement is crucial. In this post, we'll break down the current BTC price action and discuss potential trading strategies.
Current BTC Price: As of now, Bitcoin is trading at $101,254.00 USD.
Key Levels to Watch:
Support Level: $94,500 USD
Resistance Level: $105,000 USD
Market Sentiment: The market is currently bullish, with increased trading volume and positive news surrounding Bitcoin's adoption.
Potential Price Target: Based on the "Cup and Handle" pattern, a technical analysis chart pattern, the projected price target for Bitcoin is $126,500 USD.
Trading Strategy for Beginners:
1. Entry Point: Consider entering a long position if the price retraces to the $94,500 support level.
2. Stop-Loss: Set a stop-loss just below the $92,000 level to manage risk.
3. Take-Profit: Aim for a take-profit at the $126,500 target.
Important Note: Cryptocurrency markets are highly volatile. It's essential to conduct thorough research and only invest funds you can afford to lose.
Conclusion: Bitcoin's recent price action presents potential trading opportunities. By understanding key levels and technical indicators, beginners can navigate the market more effectively. Always remember to trade responsibly and stay informed.
Let's Discuss! What are your thoughts on Bitcoin's current price action? Do you agree with the projected target of $126,500? Share your insights and let's engage in a constructive discussion!
Disclaimer: This analysis is for informational purposes only and does not constitute financial advice. Always conduct your own research before making any investment decisions.
By inviting readers to share their thoughts and engage in a discussion, you can foster a more interactive environment and encourage traders to participate in the comments section.

i dont know guys!I don’t know, guys, but I think this stock is getting interesting. Just last Friday, the first fractal of the drop formed, and now we’ll see the continuation. All this activity is happening within a megaphone pattern, which makes me think NVDA’s price will surpass its all-time high. The optimization of LLM models doesn’t affect anything negatively—it only helps them become more popular and drives more chip sales.
We’re on the brink of launching the Stargate project, and let’s not overlook the fact that both the hardware and software used for AI are evolving. Nothing is set in stone, which is why sales will continue to be monumental. A clear example is that if these models become optimized enough, we could see the massive use of new, more compact chips for household and personal appliances, robots, etc. So don’t be afraid—join the revolution!

SOL Trade Setups: Key Levels to Watch for Big Moves!Solana has been on an impressive run, hitting a new all-time high (ATH) at $295. The previous ATH from 2021 at $260, along with the recent swing high of $264.63 (December 2024), are now acting as key resistance levels. Bulls are struggling to break above the $260 range and we’re seeing some bearish control as SOL trades below the weekly open, never a great sign for upward momentum.
Short Trade Setup
It’s looking like SOL could be in an ABC pattern, working on wave C. Here’s a potential short trade setup:
Entry: Around $260 if price revisits that zone.
Stop Loss: Above $270.
Take Profit: $220, where strong support lies.
R:R Ratio: About 3:1.
If you’re already short, congrats! If not, $260 could be your next chance to jump in.
Support Zone and Long Setup
There’s plenty of support stacking up between $220 and $217, making it a great zone to consider for a long position:
Point of Control (POC): At $218.50, from the November-January range
Fib Levels:
The 0.786 trend-based Fib extension is at $220.23
The 0.618 retracement (low of $169 to high of $295) is at $217.27
EMAs: The 200 and 233 EMAs on the 4H chart line up nicely with the $217 level
Channel Support: The median line from $264 to $169 also lands around $217
Long Setup Plan
Entry: Ladder longs between $220 and $217
Stop Loss: Below $217, maybe around $214
Take Profit 1: $239 for a mid-range bounce
Take Profit 2: Move your SL to entry and let the rest ride for bigger gains
Patience is Key
Whether you’re waiting for $260 to short or $220 to long, the setups are there, now it’s about watching the levels and being patient. Both trades offer solid risk-to-reward ratios, so no need to rush in.
Stay ready and let’s see how this plays out!

Ether long If ether continues to bleed she will stop at around 2800$ region where npoc level is located .
There is a higher chance ether goes up from here .
But in case the bearish saga continues thats where we should load our ammo.

XRP is holding its own in the equilibrium zone.XRP has been holding its own in the wedge pattern that it is currently trading in. Although it has the potential to form a bearish divergence on the weekly RSI, it appears that XRP is getting ready for another leg to the upside.
Good luck, and always use a stop loss!

The COMP is very interestingThe comp is at a great point to climb again, check this currency in the 2 hour time frame and don't miss out. Don't forget to like and subscribe

I can't get enough of this chart #TonThis position is very suitable for a great move. Be sure to check it and get on the perfect wave to buy tons of coins. Please support and subscribe

It is recommended to buy Avax :)Avax is very suitable for buying, everything is provided for you in a very simple and excellent chart. don't miss out

SOLANA BullishVolume up , good pattern , strong fundament. I think we will see some gains ! Like if you agree

"Ronin (RON) Gearing Up for a Massive Reversal – $10 in Sight?" The chart of Ronin (RON/USD) shows key technical levels and indicators suggesting a potential reversal from the current order block zone. Here's a structured analysis:
1. Current Market Structure & Order Block Potential
Price: $1.619 (as per the chart)
Support Zone: Around $1.50–$1.60, marked by a blue order block, indicating a potential demand area.
Resistance Levels:
$2.00 (200 EMA resistance)
$2.50 (previous liquidity zone)
$3.50 & $4.50 (major resistance levels)
Above $4.50, the price could experience strong upside momentum towards $8 or even $10.
2. Moving Averages (EMA)
50 EMA (yellow) at $1.833: Currently acting as resistance.
200 EMA (pink) at $2.005: A crucial breakout level for confirming a bullish reversal.
3. RSI (Relative Strength Index)
Current RSI: ~39.78 (neutral to slightly bearish).
Oversold Region (~30 RSI) is close, suggesting a potential bounce.
Confirmation: RSI crossing above 50 will signal strength in momentum.
4. Key Triggers for Bullish Reversal
✅ Rebound from the current order block (~$1.50–$1.60)
✅ Break and hold above 50 EMA ($1.83) and 200 EMA ($2.00)
✅ Volume increase to confirm buying interest
✅ RSI pushing above 50-60 range
5. Potential Targets & Pathway
1️⃣ Short-term target: $2.00 (EMA 200 resistance)
2️⃣ Mid-term: $2.50 and $3.50 (historical liquidity zones)
3️⃣ Long-term: $4.50 (breakout level, unlocking $8–$10 potential)
Final Thoughts
If the order block holds, we could see a bullish reversal leading to higher highs.
A break below $1.50 may invalidate this setup, leading to a bearish continuation.
Volume confirmation and market sentiment will play a key role.

inj midterm buy"🌟 Welcome to Golden Candle! 🌟
We're a team of 📈 passionate traders 📉 who love sharing our 🔍 technical analysis insights 🔎 with the TradingView community. 🌎
Our goal is to provide 💡 valuable perspectives 💡 on market trends and patterns, but 🚫 please note that our analyses are not intended as buy or sell recommendations. 🚫
Instead, they reflect our own 💭 personal attitudes and thoughts. 💭
Follow along and 📚 learn 📚 from our analyses! 📊💡"

WTI Bullish Wedge FlagUSoil It got nice Bullish Wedge Flag Better to Long than Short
I don't know what you wanna do also I don't care
but that what am gonna do
be carful from Wicks it may touch 73 price
Trade Safe

ON Semi is fundamentally undervalued and ready for a reversalTechnical View
NASDAQ:ON ON bounce off from a bigger support area from 2022 at around $53 building an ascending triangle. We have a gap above our current price (which can function as a magnet for the stock price). A smaller resistance at $60 might be our first target and the bigger resistance at $77 could be our final target resulting in 36% ROI. The trade would be invalidated below $50. Since this is a bigger swing trade, I would not put my SL to close to the current stock price. If you’re interested why this is a mid- to long-term swing trade read the fundamental information below.
Support Zones
$50-53
Target Zones
$60
$77
Fundamental View
ON Semiconductor concluded the third quarter of 2024 with revenue amounting to $1,762 million, reflecting a 2% increase from the second quarter but a -19.2% year-over-year decline. Nevertheless, the revenue for the quarter exceeded the consensus estimate by 0.70%. The most significant revenue losses were observed in the industrial end-market, with figures reaching $439.90 million compared to the average estimate of $464.97 million, marking a -28.6% decrease.
The gross margin experienced a 2% improvement, now constituting 45.4% of total revenue. Looking ahead, the acquisition of GlobalFoundries’ New York plant is anticipated to enhance the company's chip production capabilities. This facility is expected to maintain consistent production costs while simultaneously increasing production efficiency, in anticipation of a future rise in demand.
The stock has decreased by 11.26% on a year-to-date basis, with a reported trailing twelve months (TTM) earnings per share (EPS) of $4.03. Management has reported having over $1 billion in free cash flow and plans, according to Barron’s, to utilize half of each quarter’s cash flow to repurchase shares under onsemi’s Share Repurchase Program. The reduction in investments will contribute to increasing free cash flow margins, thereby reinforcing OnSemi’s objective of returning 50% of free cash flow to investors. This, combined with a projected slight improvement in sales growth and profitability, is expected to elevate EPS to $7.11 by 2027.
Currently, the company's valuation appears reasonable, trading at a forward price-to-earnings (P/E) ratio of 13.49, which is lower than 90% of the time over the past five years and significantly beneath the S&P 500 P/E ratio as well as the industry median P/E of 25.4. Based on analysts' projections for EPS and maintaining a steady P/E ratio, the company is anticipated to reach a price of $95.91 within the next two years. While this scenario may seem overly optimistic, it is evident that the market is currently undervaluing the stock, especially when compared to its main competitors, such as Texas Instruments and Analog Devices.
Since EV is a superior trend I don’t think Trumps political decision will have an impact. In addition, “Vice President” Musk has a, let’s say, not so little interest in selling more EVs.

JAN. 23, 2025 - BTC (4 HR) ROOF PATTERN ANALYSISJan. 25, 2025 - We're back at it this time on the 4HR time frame. We have a roof pattern playing out and we're going to analyze the possible price action.

SKLZ keeping BULLISH trend into march !?ER coming in march, companies making money off there product now. Bullish trend broke out of the falling wedge.
Trend seems to be sticking in bullish direction.

WTI could see another push to $80Upward trend with a bullish wedge break. Support is at around $75 and target is at around $80. If we see prices well below $75 this trade is invalidated. But do not put your SL to close below the support.

BTC BullishBINANCE:BTCUSD
Hello! Yesterday in my analysis, I mentioned that by holding the 99,000 to 100,000 dollar range, we could move toward 110,000 dollars. That’s almost exactly what happened, and I think today is the day we head toward 109,000 dollars.
Have good trades today
