LOKA USDT Daily TF LOAK USDT Trade Idea.
Historical Trends:
The price has seen substantial volatility since early 2024, with a major peak above $0.350 in mid-year followed by a prolonged bearish phase.
The price has consolidated near the $0.165 to $0.176 support zone (M-W-Sup: likely Monthly or Weekly Support).
Support & Resistance Zones
Support:
Major support appears around the $0.165 to $0.176 zone, which is being retested. This level is holding well and represents a potential accumulation zone.
Resistance:
Immediate resistance lies around $0.250, with a potential move towards the $0.340 zone, as indicated by the blue projection.
Projected Path (Bullish Scenario)
The projection suggests a breakout from the consolidation around $0.201. The price could move upwards in a zigzag pattern, with the next major target being around $0.340. This implies bullish momentum for the upcoming months.
RSI Double Bottom
Upon closer inspection of the RSI:
The RSI made a low around 32.00 in early September, indicating oversold conditions.
It then bounced and made another low, slightly higher, around 47.01, forming the double bottom pattern.
This formation is often a precursor to a bullish trend reversal. As the RSI moves upward, it could signal stronger buying momentum in the near future.
The double bottom RSI pattern confirms the likelihood of upward price movement, which aligns with the chart's bullish projection.
Overall Confirmation
Price Action: The bounce from the M-W support zone around $0.165 is holding, and combined with the RSI double bottom, this strengthens the probability of a bullish breakout.
Key Levels to Watch:
If the RSI continues to climb and breaks above 60, this would further confirm a stronger bullish trend.
The projected price levels of $0.250 and $0.340 remain valid targets based on this setup.
Bullishpattern

CLIK Holdings IPO: A Rollercoaster Start With Bullish CLIK Holdings (NASDAQ: CLIK) went public on October 9, 2024, pricing its IPO at $4.80 per share . However, it experienced significant early volatility, opening lower and trading between $1.35 and $4.39 in the following sessions. As of October 11, CLIK was trading around $1.74, reflecting a notable dip from the IPO price.
Despite this initial volatility, CLIK’s early trading patterns suggest the potential for a bullish turnaround. The stock has found support at the lower end of its range, around $1.35, and is showing signs of stabilization as it approaches critical resistance levels.
Moreover, CLIK’s strong positioning as a human resources solutions provider in Hong Kong, coupled with its diversified business model across professional, nursing, and logistics services, positions it for growth. Investors should watch for a potential breakout above the $2.00 level.

Strong buy on BitcoinThe price has seen the main break even and made a beautiful pin bar. It works as a strong buy signal. The stop loss is behind the shadow. The last target is the all-time high. As Bitcoin moves, every other coin moves in the same direction, too, so you can have long positions on other assets according to your personal strategy and entry point.

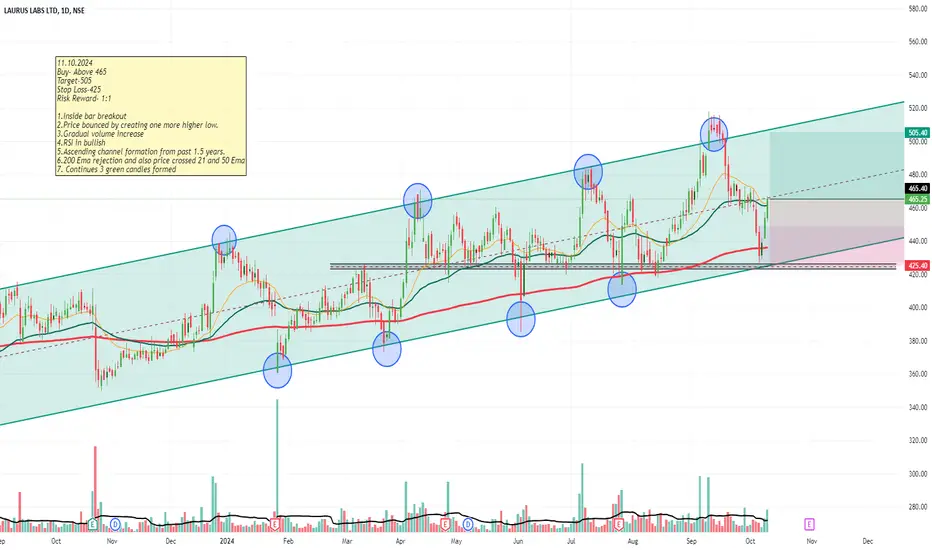
LaurusLab-Swing to Short term Bullish- Channel may continue!!
11.10.2024
Buy- Above 465
Target-505
Stop Loss-425
Risk Reward- 1:1
1.Inside bar breakout
2.Price bounced by creating one more higher low.
3.Gradual volume increase
4.RSI in bullish
5.Ascending channel formation from past 1.5 years.
6.200 Ema rejection and also price crossed 21 and 50 Ema
7. Continues 3 green candles formed NSE:LAURUSLABS
Divis Labs Set to Soar: Breakout After Month-Long Consolidation.After nearly a month of consolidation, Divis Labs is showing signs of a breakout. With robust fundamentals and a positive market outlook, it’s gearing up for a substantial upward movement (6K on the cards) in the coming weeks. Keep an eye on key support levels and upcoming earnings reports for further validation. Setting up for potential 1:2 RR trade.
Disclaimer: All ideas are my personal views and not financial advise. I do not have any Telegram channel nor do I sell any courses.

BTC Primed for Explosive Wave 3 Rally: All-Time Highs in Sight?BTC looks to have completed its ABC correction for Wave 2 in the short-term impulse wave. The correction landed perfectly on the 0.618 Fibonacci retracement level, a textbook setup for an ABC pattern. With this, BTC is now entering Wave 3, which historically offers the strongest price movements.
In the immediate term, BTC is poised to break through Waves 1 and 2 of 3 quickly. But the real fireworks will likely come when we hit Wave 3 of 3, which could push BTC up to as high as $68k—a target that’s been on the cards for some time. If we manage to break through the upper trendline during Waves 4 and 5 of the higher degree trend, BTC could be set for new all-time highs within the next few weeks.
With all eyes on this setup, it feels like November 5th could be a pivotal moment for BTC. Let’s see how the market unfolds, but it’s looking very bullish!

XAUUSDXAUUSD
A shallow drop of few more dollar and the gold is going up.
Currently the gold is near to complete its 4th wave , which corrective wave.
2590 is a good buying level.
Best of luck

BHARTI AIRTEL - Bullish SetupEnter only when 15minute candle closes above the Entry Zone Price - 1687.70
Targets are : 1745.25, 1802.8
Stoploss only when 15minute candle closes below the price - 1630.15
Note: This is not any financial advice, this is for education purpose only.

TAOUSDT Breakout SoonHere's my idea about TAOUSDT Breakout
Make sure to Take spot Trade or Use low Levrage

APT Bullish Breakout Here is my idea about APTUSDT Bullish breakout
Entry - 9.4-9.5
SL - 8.47 Around
Target - 10.6$, 11.3$, 12.6$
Use Low Levrage & Make sure to Have a Tight SL

NVIDIA Is Trying To Breakout Of A Triangle; Room For $150Hello Traders, and welcome to our new update!
This time I will take a look at Nvidia. It’s in a very nice recovery and looking strong, especially after retesting the $90 area and filling the gap from August, which occurred after earnings were released in May. This retracement was quite similar to the pullback we saw back in April, when the market retraced to the gap from February’s, following Q4 2023 earnings release.
Currently, Nvidia is coming out from an Elliott wave bullish triangle. This is significant because such triangles typically represent sideways price action between two contracting trendlines, where many traders tend to lose interest as the range drags on. However, as the price contracts, this is actually when we should expect a breakout, espeically when we see five subwaves labeled A-B-C-D-E within the triangle, it’s a strong signal that the breakout can be coming.
The confirmation for the breakout comes when the wave (D) swing high is broken, which was around $127. But now,the price is even pushing above $131.40, wave (B) high. if it closes above that level, I believe there’s a good chance the market will rally to new highs, potentially reaching the $150 area.
If you find these insights helpful, please like this idea or drop a comment below.
Gregor

SWING IDEA - DISHTVNSE:DISHTV appears to be forming a Flag Pattern on its weekly chart, indicating potential upside momentum. Despite Monday's market downturn, the pattern has demonstrated resilience, maintaining support levels.
If the pattern holds, we can anticipate a continuation of the upward trend, targeting Swing High levels. This bullish outlook is further reinforced by the company's recent partnership with SEI ROBOTICS to launch the innovative 'DISH TV SMART+ BOX', integrating TV and OTT capabilities across devices.
Key takeaways:
- Flag Pattern formation on weekly chart
- Strong support levels despite market volatility
- Potential upside momentum towards Swing High levels
- Positive news catalyst: Partnership with SEI ROBOTICS for SMART+ BOX launch
Recommendation:
Investors and traders should monitor DISHTV's price action closely, as a breakout above the Flag Pattern's Support levels could trigger a significant move. We maintain a bullish stance, anticipating a potential revisit of Swing High levels in the near term.
Disclaimer: This analysis is for informational purposes only and should not be considered as investment advice. Please conduct thorough research and consult with a financial advisor before making any investment decisions.

Next stop 100k for BTCLooks like Bitcoin is forming a bull flag, so the next expected scenario can be a new ATH.

PEPE Prepares for Parabolic Growth: Bullish Momentum Building PEPE’s price action is following a classic Elliott Wave structure, with Wave 1 now complete, followed by an ABC correction, which also appears to have finished. This signals that we’re now entering Wave 3 of a larger degree trend (marked yellow), with Waves 1 and 2 behind us.
Zooming in, the Roman numeral wave count (white) shows the completion of Wave 1 of 3 of the higher degree trend, with i (green) forming the current wave. Once i completes, we can expect a brief ABC correction, followed by parabolic growth in Wave 3.
It’s exciting to see a meme coin like PEPE following such a strong bullish trajectory. The overall outlook is highly promising, and this setup could lead to significant upside potential!

Bullish BAT Supported by Volumewe have a bullish formation of BAT pattern on NYSE:NU which is supported by relative volume.
✅ Target 1 : $14.25
✅ Target 2 : $15.07
⛔ Stop Loss: $13.5
Have a good weekend! 🫡✌️

BTC Gearing Up for a Breakthrough: Election Day Could Align BTC is showing clear signs of nearing a breakout. The upper trendline (marked in yellow) is the key area to watch, and it’s only a matter of time before it gets broken. After completing a significant reset at the bottom of an XYZ or ABC pattern, BTC has now entered an impulse wave, suggesting we’ve moved past Wave 4 correction.
What’s intriguing is the timing: the top of Wave 3 of 5 seems to coincide with Election Day in the USA, hinting that a major Wave 5 of 5 flameout could follow toward the end of January. With some early signs of bullish momentum and the formation of a strong impulse wave, this long-awaited breakout is becoming more and more probable.

NVDA price bounced exactly at the green zone, around 115.25. WOWThe price bounced exactly at the green zone, around 115.25. WOW, do you remember my analysis of Nvidia from last week? I can't even believe it myself; it was incredibly accurate!
Every time I apply price behavior with price action, I always remember the words of my mentor, Al Brooks. He told me: "Just remember, Mike, price action is ALWAYS RIGHT."
I believe that it's the trader who makes mistakes, not the price action, because it will always be on the correct side.
That’s why I always recommend drawing trend lines, channels, and minimizing the use of indicators that might make you see something different. This way, you'll be more accurate in your decision when executing an order.
Going back to Nvidia...
There’s something about the last candle that has me a bit uneasy. This can be very misleading because the price HASN’T BROKEN THE CHANNEL YET! The advantage we have here is that the last candle shows a buying pressure wick, but it hasn’t fully broken out of the channel or shown volume yet. However, I still believe that Nvidia will likely break out at any moment because it bounced off my green zone, as we said in the previous analysis (well before), and it didn’t even reach the #4 sequence, which would have been at the channel’s support.
Now, we just need to wait for a breakout confirmation. But what will happen after it breaks out?
We’re looking for an N3 pattern.
An N3 pattern involves three movements:
#1 Breakout and New High
#2 Pullback and Rebound
#3 New Extreme
That simple.
Will it happen? No one knows for sure. The next step is the breakout, and after that, we let the price do what it needs to do so we can position ourselves for the next move.
Stay very alert this week!
Best regards, and thank you for supporting my analysis.

SWING IDEA - DEEPAKFERTPrice Action is making Lower Low Pattern, while MACD Cross is making Higher Low Pattern.
MACD is showing good momentum upward.
The stock should be ready for its next leg up, at least until the next Support/Resistance zone.
Worst case, a retest to the nearest Support zone @ 480 levels.
Any weekly closing under this level can take the stock to new lows.
Trade with the Trend.

SWING IDEA - VIPULORGBSE:VIPULORG is about to form a MACD Cross on the weekly charts. If the market favor this move and if it completes its crossover, the stock should easily be able to go all the way at least until its next Support/Resistance Zone.
Fundamentally speaking, the company has also started building its new Factory in Maharashtra. This could further add as a factor to get this moving in the upward direction.

SPY is looking Very Sexy ! There is 1 more step to go ! N3 Confirmed!! The price is doing exactly what we had predicted (see previous analysis).
Indeed, the price bounced in the zone we had predicted last week, creating an "N3" pattern. Now, we are waiting for the final phase of the N3 pattern, which is to reach new highs or new extreme.
What do we need to see?
This phase is of great importance because, if completed, we would be at new historical highs again.
The Key is the Last Candle: If you can observe the last candle on the chart, you'll see it has a very long lower wick. I call this a buying pressure candle; however, we need confirmation with the next candle, which should have a large bullish body in order to reach the new extremes we've been seeking.
So, we can conclude that by putting all the points together when analyzing this chart, we have a bullish outlook for the rest of next week. However, it’s important to remember that we need solid confirmation with a bullish candle to confirm we will have a green week!
Best regards and success in your trades.
Thanks for supporting my analysis.

BNB Poised for Wave 5 Surge: A Golden Setup or Last Call to ExitBNB has made a decisive move, breaking its trendline and completing Wave 4 in a classic Elliott Wave triangle. For those new to Elliott Wave Theory, Wave 5 represents the final push in the current trend, typically leading to impressive gains. Currently, Wave 2 of 5 is nearing completion, and this sets the stage for Wave 3 of 5, often the most powerful wave in terms of price action.
However, here’s the critical point: if BNB’s long-term support is decisively broken, that’s the clear signal to exit. Stay informed on both the opportunity and the risk!

SOL Price Action and Potential Cup & Handle SetupIt’s becoming increasingly clear that SOL, much like BTC, is forming a cup and handle pattern. Once the trendline is decisively broken, this pattern should lead to higher highs, with the target being roughly the same distance as the height of the cup from bottom to top. If a breakout occurs, SOL’s target could be significantly impressive.
However, unlike BTC, SOL (and similarly XRP) often doesn’t follow the typical market movements and can act independently. While I’m not a huge fan of SOL due to its more isolated nature and weaker focus on macro trends, this is an undeniably strong technical setup.
If SOL does break through the trendline, I expect it to initially pierce above, only to retest and sit on that line. If the upward trend continues from there, the cup and handle will be fully in play.

APT ANALYSIS🚀#APT Analysis :
🔮As we can see in the chart of #APT that there is a formation of "Falling Wedge Pattern". Some time ago the same structure was made and it performed well and this time also the same is happening with a perfect breakout
🔰Current Price: $8.69
🎯 Target Price: $13.15
⚡️What to do ?
👀Keep an eye on #APT price action. We can trade according to the chart and make some profits⚡️⚡️
#APT #Cryptocurrency #TechnicalAnalysis #DYOR
