DOGE | BULLISH Pattern | +100%DOGE is seemingly ready for more upside as we start to see a pattern resembling an inverse head and shoulders pattern:
✅Usually, the Inverse H&S plays out something like this:
📢But the pattern is not quite confirmed just yet. We'd need to see a close ABOVE the current resistance zone to validate the pattern:
If we can see that, it's likely that there can be BIG gains on DOGE. It will especially help if ETH makes more increases, showing that the general alt market is heading in the right direction.
____________________
BINANCE:DOGEUSDT
Bullishpattern

IRB INFRA: Cup & Consolidation Breakout🔍 Chart Analysis
The stock formed a textbook cup pattern, indicating accumulation after a long downtrend and also given 200 EMA breakout.
After forming the rounded base, it entered a tight consolidation range (highlighted in blue).
Today, the stock broke out of this range with strong bullish momentum and rising volume.
Immediate support lies at ₹49.25, the base of the consolidation box.
Next major hurdle: Strong resistance at ₹60.52, which aligns with a previous swing top.
📈 Why This Setup Looks Promising
Cup and handle patterns often precede major upward moves, especially when breakouts happen with volume.
Breakout from consolidation confirms bullish interest near ₹53 zone.
The stock has already corrected about 47% from its all-time high, offering a potential value opportunity if trend reversal sustains.
🎯 Levels to Watch
Support: ₹49.25
Resistance: ₹60.52
Breakout Confirmation Zone: ₹53.00–₹54.00
⚠️ Disclaimer
This is not investment advice. Please do your own research or consult your financial advisor before taking any position. The market is subject to risk and uncertainty.

XAUUSD Is XAUUSD getting ready for new ATHs? Gold has formed a clear bullish flag pattern and retested it clearly. One Thing I am looking for the retest of 50 DEMA . If the Price holds above the 50 DEMA, there are much chances that gold may target the new ATHs very soon.
What you guys think about it?

Pudgy Penguins PENGU Gearing Up for a +100% Move! 🐧 BINANCE:PENGUUSDT has completed its 5-wave advance from the April low (wave 1) and corrected with a 3-wave Zigzag structure in wave (2), reaching the buying area at equal legs $0.009 - $0.008.
🚀 Now, it's setting up for wave (3) higher, with an initial target at $0.022.
🌊 Are you positioned to catch the next wave higher?

Exploring Bullish Targets for Hyperliquid HYPE🚀 BINANCEUS:HYPEUSD has surged into a new ATH and the most bullish scenario suggests a nest structure forming.
🎯 This setup could lead to an extension beyond the 1.618 Fib level at $66, opening the door for +$100 range in the coming months.
Are you positioned for this breakout? What’s your personal target for this cycle?

LTCUSD💡 LTC/USDT – 4H Chart Setup
Bullish Divergence spotted on the 4H timeframe.
📌 Trade Plan
Entry (Buy Stop): 91.08 (Break of Lower High)
Stop Loss (SL): 81.95
Take Profit 1 (TP1): 98.89
Take Profit 2 (TP2): 106.86
📈 Risk Management
Open 2 positions
Once TP1 is hit, trail SL to Entry (EP) to secure risk-free run toward TP2
🧠 Reasoning:
Bullish divergence indicates potential reversal. Entry planned above the LH to confirm momentum shift.

GOOG | The Year of Quantum | LONGAlphabet, Inc. is a holding company, which engages in software, health care, transportation, and other technologies. It operates through the following segments: Google Services, Google Cloud, and Other Bets. The Google Services segment includes products and services, such as ads, Android, Chrome, devices, Google Maps, Google Play, Search, and YouTube. The Google Cloud segment refers to infrastructure and platform services, collaboration tools, and other services for enterprise customers. The Other Bets segment relates to the sale of healthcare-related services and internet services. The company was founded by Lawrence E. Page and Sergey Mikhaylovich Brin on October 2, 2015 and is headquartered in Mountain View, CA.

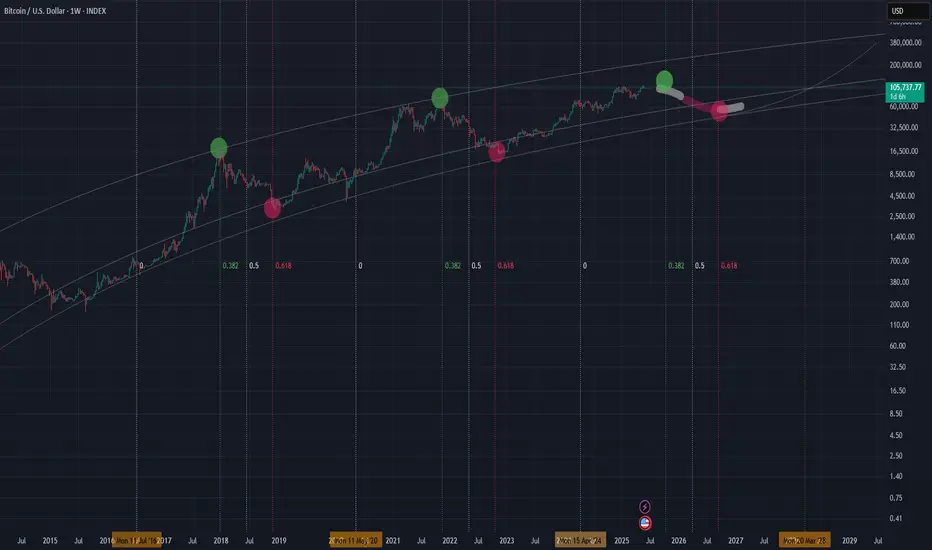
Last 133 days of the bull market!This idea gives more details about the pint in the cycle we are at right now. When measuring the duration between halving and tops we usually see the best in ~500 days after the halving. Following my previous idea about topping in October you can find the same pattern translating in 546 days after last halving. If this proves right , we are about 133 days before top. At this point we should see fireworks till October. In blue is price action in those 133 in 2017 and in yellow 2021, according to the btc nature of diminishing returns we should see peaks bellow those years.Cheers

Trend Base Fib Time suggesting getting out before October 2025!I have been warning you that time is running and a few months left before things start cooling off. This tool is trend base fib time , measured from one halving till the next one. I assumed halving in 2028 at some point in march so this result in a target of October to be the month matching with the 0.382 when peaks use to be found. The 0.618 would be the one for catching the bottoms around Sep 2026. Secure some gains and buy back at next bear market lows close to 40k. Cheers
RSI suggesting a bear market comingThis is BTC and it's RSI. Bellow you can see LMACD applied on the RSI indicator to see the trend more clearly. We might be on the stage that we can see higher prices like in 2021, but the bear trend is already printed. Sell some now and buy back at 40k next year. Cheers

Crypto bull market might be ending pretty soonI am warning you that we might seeing the last days of the bull market. SO FAR histogram is printing the first red candle(we need to verify once June ends). Look what happened with btc once LMACD crossed above 0. Winter is coming.

Bullish Divergence
Closed at 26.89 (05-06-2025)
27.50 - 28 is an Immediate Important
Resistance that needs to cross & sustain
for further upside.
There is a Bullish Divergence which may
help this time to break the resistance.
But better approach would be to wait
for the Resistance to cross & then take entry.
If it does, 32 - 33 is easily reachable.
On the flip side, it should not break 23.50
otherwise there would be more selling pressure.

EUR/USD Long📍 Entry (Buy Limit):
1.1085
This is just above the 1.1000 psychological level but below previous minor structure at 1.1100.
Captures a shallow retest without risking being front-run by liquidity sweeps.
🛑 Stop Loss (SL):
1.0910
Below consolidation zone and wicks around 1.10
Provides enough space beneath the major breakout level while staying tight for R:R
🎯 Take Profit Targets:
TP1: 1.1500 (Previous weekly resistance, already tested but not broken)
TP2: 1.2000 (Next clean monthly structure level)
TP3 (macro): 1.2400 (Upper range of long-term channel, highly reactive zone)
⚖️ Risk/Reward:
Risk: ~175 pips
Reward:
• TP1: ~415 pips
• TP2: ~915 pips
• TP3: ~1,315 pips
R:R = 2.4 to 1, 5.2 to 1, 7.5 to 1

XAUUSD🟡 XAUUSD Bullish Trade Plan – 4H Timeframe
📊 Market Structure: Higher Highs & Higher Lows (HH-HL) following Dow Theory
📐 Trendline Breakout confirmed by strong bullish candle
🕓 Timeframe: 4H
🟢 Entry Price (EP): 3379.052
🔴 Stop Loss (SL): 3269
🎯 Take Profit 1 (TP1): 3486.163 – 🟰 Risk:Reward 1:1
🥇 Take Profit 2 (TP2): 3607 – 🟰 Risk:Reward 1:2
📌 Open Two Trades:
🔸 Trade 1: Target TP1 to secure quick 1:1 profits
🔸 Trade 2: Target TP2 for extended 1:2 gains
🔄 Once TP1 is hit, shift SL of Trade 2 to Entry 🔁
📈 Continue trailing SL upward if momentum persists beyond TP2
⚡ Clean structure, trend alignment, and solid risk control – strong long setup! 🚀

Acorn's Smart Money S&P SignalJune 3, 2025 - After another successful S&P signal in May, we have another Bullish signal for the first part of June. If correct, the bullish S&P indicator suggests the S&P will close above 5861.43 on June 19.

Nice Setup15.30 - 15.50 important to sustain for further upside
Important Resistance is around 18 - 18.70

ETH/USDT – Breakout Brewing?Ethereum is currently consolidating within a bullish ascending triangle on the 4H chart. The price is coiling just below the key resistance, so a breakout could ignite the next leg up.
RSI hovering near 50 shows room for momentum buildup.
Setup Analysis:
Structure: Bullish ascending triangle
Momentum: Healthy consolidation after strong rally
RSI: Mid-range, potential to climb
Key Levels:
Resistance: $2,849
Support: $2,430 | $2,243
Breakout Target: ~$3,200 and possibly $3,420 if momentum sustains
Entry (Breakout Play):
Above $2,850 on strong volume
Target Zones:
$3,200, $3,420
Longer-term: $4,050
Stop-loss:
Below $2,430 (pattern invalidated)
Watch closely — breakout confirmation could present a solid bullish opportunity.
This is not financial advice, please do your research before investing, as we are not responsible for any of your losses or profits.
Please like, share, and comment on this idea if you liked it.
#Ethereum #ETH #CryptoTrading #TechnicalAnalysis #Altcoins #Breakout #ETHUSDT #BullishSetup

DOTUSDAlligator Strategy Buy Call
Risk Rewar TP 1 1:1 and T2 1:3
Open Two trades one for TP1 other for TP2.
For TP 2 make sure to move your SL to Entry point once price crosses TP1. So that you can ride Tp2 with zero loss.

Another Possible Setup of Cup & Handle
Closed at 120538.01 (03-06-2025)
Another Possible Setup of Cup &
Handle is appearing on Top.
But still Resistance od 120660 - 120700
is there.
If crossed, 123000 is on the cards.
On the flip side, slight bearish divergence is
there on shorter tf, so dip can be a buying
opportunity.
Hoping for a Good Move Upside! Inshaa ALLAH!

Very Good Monthly Closing.
Closed at 323.58 (30-05-2025)
Very Good Monthly Closing.
Seems like Crossing the Resistance of 329-330
this time.
Potential to touch 390 -400 initially & then
500+ if 395 is Sustained.
However, should not break 305 - 307.

FETAI SURGING TO 2$ canadian by summer. Perfectly bouncing in the support resistance bull climb dating back to when the coin first came about BUY NOW

Hello Symmetrical triangleThe appearance of this symmetrical triangle marks the end of the decline in this cycle, in which the price is stabilizing in order to continue its upward movement. 109 is the next level.

Gold breakout? My opinionGold in short time frame was in bearish trend which it broke out of, however price action is still bearish. Generally trendlines are powerful enough to change price section. Turning points are marked on the chart, I will look for trades in these areas.
