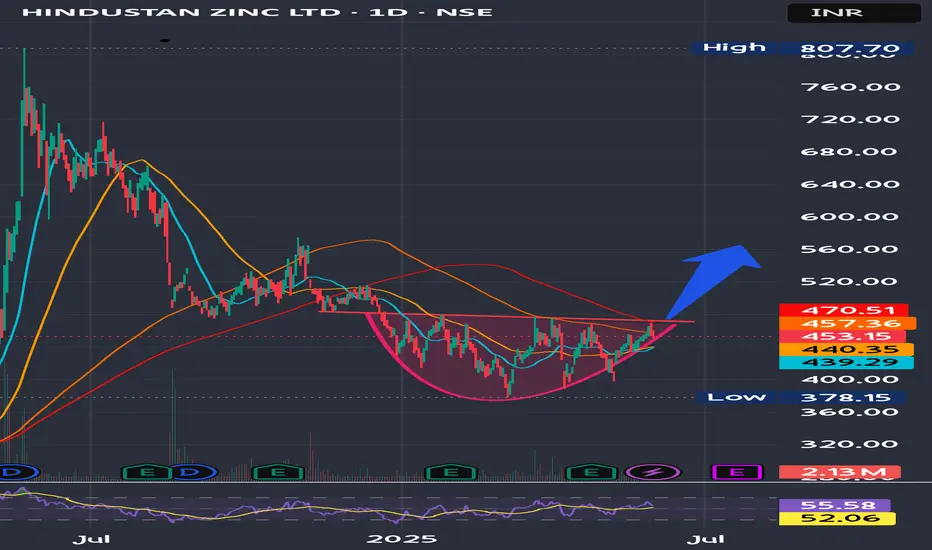
Hindustan Zinc Ltd at near breakout Hindustan Zinc Ltd. (Hindzinc) is one of the world's largest integrated producers of zinc, lead, and silver.
It is near a crucial resistance level and making higher lows indicating a breakout upwards soon.
Trading Levels-
Tgt Price-564
SL-448.5
Bullishpattern
Bullish Flag Pattern on Bigger tf + Bullish Divergence
Closed at 60.50 (02-06-2025)
Bullish Flag Pattern on Bigger tf + Bullish Divergence
is there.
54.50 - 62.50 is an Important Support
Zone. If this level is Sustained, we may
witness further upside towards 70-71.
A very Important Resistance Level is around 90-92
which if Crossed with Good Volumes, may expose
new highs.
On the flip side, breaking 51 may bring more selling
pressure.

Cup and Handle Breakout in THOMAS COOK (INDIA) LTDTHOMAS COOK (INDIA) LTD is showing a classic Cup and Handle breakout pattern on the daily chart.
🔍 Chart Highlight
Breakout from the Cup's rim around ₹169.93 level.
Strong bullish candle with +7.61% gain, backed by higher volume.
Price sustained above the 200 EMA (₹163.85).
Next potential resistance: ₹197.29, a previous swing high.
Levels to Watch:
Support Zone: ₹163.85 – ₹169.93 (200 EMA + breakout retest zone)
Resistance Zone: ₹197.29 (next swing high)
If the price retests and holds above ₹169.93, it could offer a good risk-reward opportunity with ₹197+ as the near-term target. Keep an eye on volume and any pullback toward the breakout zone.
⚠️ Disclaimer:
This idea is for educational purposes only and not financial advice. Please do your own research or consult your financial advisor before making any trading decisions. Markets carry risk — trade wisely!

PLTR still bullish - Cup n Handle patternPLTR in Cup and handle pattern, broke out.
The price closed on Friday is $131.78 (05.30.2025).
Desired entry price $127.88.
Target $147.58/ 164.99/ 183.41.
Stop loss $119.41.
IMO.

AAVE ANALYSIS🔮 #AAVE Analysis 💰💰
📊 #AAVE is making perfect and huge rounding bottom pattern in daily time frame, indicating a potential bullish move. If #AAVE retests little bit and breakout the pattern with high volume then we will get a bullish move📈
🔖 Current Price: $248
⏳ Target Price: $348
⁉️ What to do?
- We have marked crucial levels in the chart . We can trade according to the chart and make some profits. 🚀💸
#AAVE #Cryptocurrency #Pump #DYOR

NVDA: Ascending triangle break, bull flag on S/R retestHey traders! I'm back and once again, I've spent almost the whole evening (lol) trying to figure out the odd, strange price action we've seen from NASDAQ:NVDA over the past few weeks, and especially today!
As we all know (I assume), Nvidia failed to disappoint on earnings once again, and we saw a HUGE gap up overnight, as far as up to the $143 mark. However, we soon began to see a dip. That's fair, as traders will likely sell and take profit.
However, the dip became a larger dip, and Nvidia finished the day basically at 3.2%. But it seems that the pullback may been pretty healthy.
Because as you can see from the chart, Nvidia has been forming an ascending triangle ever since the 14th May. That was after the sweet run it had prior to that. It has tested the £136-137 area as a major resistance line ever since until finally, a strong earnings report sent Nvidia above the line.
After the gap up, throughout the day, the stock went into a controlled, composed downward channel which what we like to call, a bull flag. This is taking into consideration market hours, not extended hours. This bull flag is bullish in its own way, but it is also a sign of a retest of the $136-137 resistance zone. This is officially a support zone now.
A successful retest from this support zone will cause a bounce, especially from the support trendline, and likely send the stock towards $140+, possibly extending its reach to $150 if broader market strength (Nasdaq) continues.
On the contrary, a dip below the support line and a crash below the red support trendline, would likely send the stock lower to $133 as next support.
As long as Nvidia maintains $136-137, the bulls are in control.
Note: Not financial advice. Please do your DD.

DB patternhi traders,
Here is an opportunity to grab 500 to 600 pts in Nifty.
A DB pattern in daily timeframe has formed, if the neckline breaks buy nifty.
Neckline level : 25116.25
Target : 25759.95
SL : 24462.40

EUR USD Trade Setup 1 hour timeframe EUR USD has formed a demand level around price 1.12600 and the market is slowly approaching this level, we need to wait for price to tap on the demand zone before making any trading decisions.

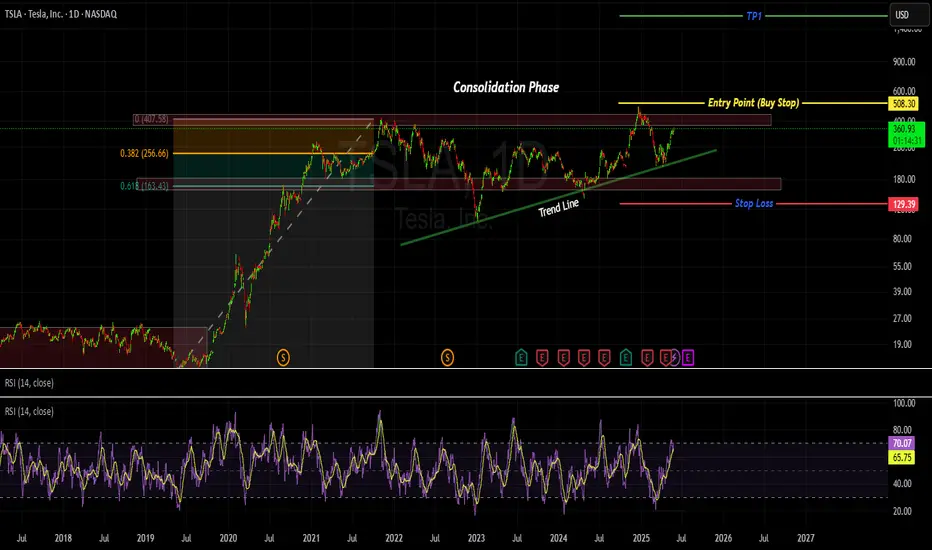
TESLA - POSTIONS ACCMULATING OR MARKET CONFUSION !!!!Hi, Tesla is making series of HH and HL. Bullish trend line can also be seen. however, it is in consolidation phase since long. currently the market is trading near the strong resistance level of 409. if the market break this support level and even breaks the previous HH which is 482 then we can expect market to take a bull ride.
Trade entry plan is to set BUY STOP order type at the mentioned Entry Point. once the trade is executed we can Set Stop Loss slightly below the previous HL /support level.
TP1 and TP2 are placed with 1:1 and 1:2 Reward to Risk ration
TSLA: Break-out above bull flag, possible cup and handle?So, a few days ago, I posted about a bull flag forming on the daily chart for Tesla. This flag pattern was a period of consolidation following an incredibly whooping rally from the $270 mark to around $350 (around a 30% or so gain).
Today, we have a new break-out from this consolidation period, and as of writing right now, Tesla is up 7%. It has now breached the $350 resistance level.
If you look more closely, the chart pattern resembles something close to a cup and handle pattern. You have the cup base going from the 20th of Feb 2025 all the way to the 14th of May 2025. Our bull flag which lasted between the 14th of May until the 23rd of May (last Friday), could as well be a handle for the cup base.
A break-out from not only the bull flag but the cup and handle could signal a massive move towards $400, however $375 and $390 could be points of resistance, and it would be wise to watch for a cooldown in the short-term.
Upcoming this week, it might worth mentioning that NASDAQ:NVDA earnings could have a strong impact on tech and affect Tesla - even if Tesla isn't much exposed to AI as the semiconductors.
To conclude, target is $390-$400 however as we all know, nothing is guaranteed :)
Note: Not financial advice. My analysis is not advice, rather just an idea. Please do your DD as well.

GBPCHFThe tool watches for a strong upward move (called the flagpole).
Then it looks for a small pullback or sideways move (called the flag).

HH HL intact.FLYNG Closed at 50.80 (25-05-2025)
HH HL intact.
No Bearish Divergence yet on bigger tf.
54- 56 is the resistance for now.
If this level is crossed with Good Volumes,
we may witness further New Highs around 60+
On the flip side, 49 - 49.50 & then 47 - 47.50
may act as Good Support Levels.
However, breaking 45 will bring more Selling Pressure
towards 42 - 44

EUR USD Entry Setup EUR USD has formed a bullish break and retest and has also retraced back to the 50-618 FIB retracement level.
The trend is bullish so we will continue to look for buying opportunities

MDLZ - Bullish Flag patternBullish Flag pattern
The Bull Flag pattern forecasts in the near future. Currently, it's just early planning with small profits and a reminder to set a stop loss if the pattern cannot breakout upwards.
Both the M50 and MACD indicators suggest the potential for price increase.
The volume is still low so it cannot break out yet.
The price now (Closed on 05.23.2025): $66.14
Price target: $70.11/ $74.64/ $84.60.
Stop loss: $63.43
IMO, amateur trader.

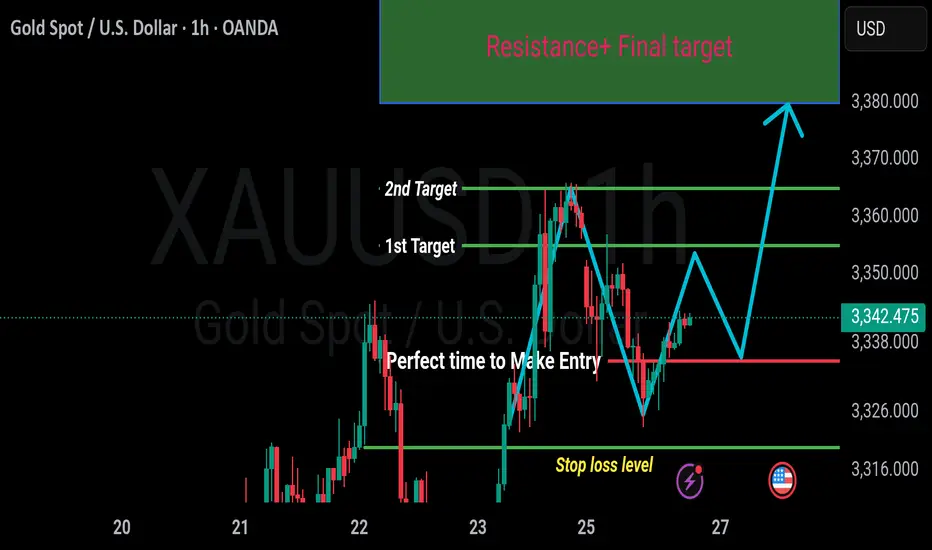
Gold (XAU/USD) Technical Analysis – Short-Term OutlookCurrent Price Range: 3340 – 3350 USD
Trend Bias: Strong Bullish
Time Frame Focus: Intraday to Short-Term (H1/H4)
---
Price Structure & Trend
Gold is currently consolidating within a narrow range of 3340 to 3350, forming a bullish continuation pattern (likely a flag or a pennant). The current consolidation is occurring after a strong bullish impulse, which signals a potential for trend continuation to the upside.
This behavior is consistent with accumulation before breakout, often seen in trending markets. The presence of higher highs and higher lows on the H1 and H4 charts supports the bullish bias.
---
Key Levels
Zone Level Significance
Support 3335 Pullback zone / Potential entry area
Minor Support 3320 Stop loss zone / Break of structure risk
Resistance 1 3365 Initial profit target / minor resistance
Resistance 2 3375 Midway resistance / partial exit level
Major Resistance 3380–3400 Final target zone / Strong supply area
---
Entry & Setup
Entry Zone: 3335–3355 (ideal is a retest of 3335 with confirmation candle)
Entry Type: Long (Buy) on support retest + bullish candle confirmation (pin bar, engulfing, etc.)
Stop Loss: Below 3320 (tight risk, below structure support)
Take Profits:
TP1: 3365
TP2: 3375
TP3: 3400 (final target)
Risk:Reward Ratio (Approximate):
From entry at 3335: R:R = 1:2.5 to 1:3.5 depending on target
From entry at 3350: R:R = 1:1.5 to 1:2.5
---
Technical Indicators
RSI: Likely in the 55–65 zone on H1/H4, indicating strength but not yet overbought.
MACD: Histogram positive, signal line above zero, supporting bullish momentum.
Volume: Look for rising volume on bullish candles and low volume on pullbacks.
---
Chart Patterns & Observations
Bullish Flag / Pennant: Suggests a continuation of the prior bullish move.
No bearish divergence observed (if indicators used).
Trendline support: Can draw ascending trendline connecting recent swing lows.
---
Conclusion & Strategy
Gold remains in a bullish phase with clear consolidation before potential breakout. Best opportunity is a buy on dip, ideally on a clean retest of 3335–3340 support zone with proper confirmation.
If gold breaks above 3355–3360 with momentum, aggressive traders may consider a breakout entry with reduced risk and tighter stops below 3340.
Avoid entries below 3320 as this would invalidate the bullish structure and may indicate a shift in trend.
ETHUSD📊 1H Analysis – ETHUSD
Strategy: 🐊 Alligator Strategy
Trend: 📈 Strong Uptrend
📝 Trade Plan
🎯 Entry Point (EP): 2577
🛡️ Stop Loss (SL): 2514.76
💰 Take Profit 1 (TP1): 2645.46
🚀 Take Profit 2 (TP2): 2706.17
🔄 Execution:
Open two trades at the Entry Point (2577)
When TP1 hits, move SL to EP for the remaining trade
Let the second trade ride to TP2 or more

ETHUSD📊 1D Analysis – ETHUSD
Strategy: 🐊 Alligator Strategy
Trend: 📈 Strong Uptrend
📝 Trade Plan
🎯 Entry Point (EP): 2577
🛡️ Stop Loss (SL): 2514.76
💰 Take Profit 1 (TP1): 2645.46
🚀 Take Profit 2 (TP2): 2706.17
Open two trades When TP1 hits move your SL to Entry point for and ride TP2.

Play on LevelsGGL - Closed at 15.67 (23-05-2025)
Ideal Support levels:
S1 around 15.07 - 15.15
S2 around 13.86 - 14
S3 around 12.80 - 13
Upside targets can be around 17-18
if these supports are respected.

Tesla (TSLA): Daily uptrend support and potential bull flagHey guys/gals,
Today, I am showing you the daily chart of Tesla ( NASDAQ:TSLA ), which provides an idea of where this stock may be heading next.
As you can see, the support trendline from the 21st April low is still well intact. Currently, Tesla is holding this line very well and over the past few days, it's clear that it has also been in consolidation mode. Taking a deeper look, the consolidation period seems to be forming a potential bull flag pattern. Minus the upper wick which could be a price anomaly due to a fake-out, a real actual breakout from the bull flag in combination with a bounce from the support trendline could help Tesla reach $365 as the next resistance point.
On the contrary, and it does depend strongly on what the broader market does next (as Tesla is a high beta stock), its flag pattern may not play out and a break below the support line could send the stock all the way to first support at £325.
This wholly depends on the wider market. On my other posts, I've made it clear that S&P 500 AMEX:SPY is also forming a flag pattern, with many other indices following suit.
Note: Not financial advice.

GBPCHF BULLISH TRADE IDEAThis chart shows the British Pound / Swiss Franc (GBP/CHF) on a 2-hour Heikin Ashi timeframe, and it highlights a potential bullish breakout scenario. Here's a breakdown:
🔍 Key Observations:
Descending Channel:
Price was trading within a downward-sloping parallel channel, defined by two blue trendlines.
This pattern often signals a bullish continuation when it forms as a correction in an uptrend.
Breakout Confirmation:
Price has just broken above the upper boundary of the descending channel — a strong bullish signal.
This suggests that selling pressure is weakening and buyers are taking control.
Bullish Projection:
The blue projection arrow outlines a potential bullish continuation pattern (possible retest of breakout and rally).
This could lead to higher highs, targeting areas above 1.1200 and potentially 1.1250+.
Heikin Ashi Candles:
Recent candles are large and green, indicating strong upward momentum and trend clarity.
📈 Bullish Bias Justification:
Break of Structure: Clean breakout from the descending channel.
Momentum Shift: Strong bullish Heikin Ashi candles with minimal lower wicks.
Trend Continuation Pattern: The entire structure resembles a bull flag, a classic continuation signal.
✅ Possible Trading Implications:
Entry Opportunity: Traders may look to enter on a retest of the breakout zone (around 1.1130–1.1150).
Targets: Near-term: 1.1200 | Mid-term: 1.1250+
Stop Loss Zone: Below 1.1100 (inside the channel), to invalidate the breakout.
⚠️ Watch for:
False Breakouts: Confirm the breakout with continued bullish candles or volume (if available).
CHF Strength: Any sudden CHF strength (safe-haven flows) could invalidate bullish expectations.

+460% potential profit with TVS MotorThis is my pick for buy&hold in 2025 in NSE India. A part of Nifty Auto Index which will drive its growth and lead the sector.
Strong chart from all angles. This is published as demo of what is available on my social media. You can find more through links in my profile.

GALAUSDT📢 Crypto Signal – GALAUSDT 1-Hour TF
🖨️ Let the Chart Print Smart Money
Bullish divergence formed earlier, and price is now prepping a breakout. 📈 Buy Stop at 0.02078 catches the move with momentum confirmation.
🎯 Trade Setup
🛑 SL: 0.01904
🎯 TP1 (1:1): 0.02254
🎯 TP2 (1:2): 0.02426
📊 Bull Score: 2 vs 0
(✅ Bullish Divergence, ✅ Breakout Setup)
💰 Clear setup. Clean risk. Smart profits. 🟢📊🚀

CESC Ltd – Short-Term Breakout Idea|Target: ₹171.00 CMP: ₹165.70
Recommended Buy Range: ₹164.50 – ₹165.00
Target: ₹171.00 🎯
Stop Loss: ₹161.50 🛡️
Timeframe: 15 min & 1H
Risk-Reward: ~1.4:1
Type: Momentum Breakout / Swing Trade
🔍 Technical Analysis:
✅ EMA Cross (9/13) bullish crossover
✅ Price trading above EMA-26
✅ RSI at 65 – bullish, not overbought
✅ BB %B around 1.0 – strong upper band breakout
✅ Volume spike supports the move
Watch for a strong close above ₹167 to confirm momentum toward ₹171.
For Education Purposes Only
