Bullish
Closed at 34.03 (21-05-2025)
Hidden Bullish Divergence on bigger tf.
Bullish Divergence on shorter tf.
Immediate resistance is around 34 - 34.10
Crossing & Sustaining this level may exposes
upside towards 47 - 48
However, mid way, 40-41 & 44-45 are important
resistances that should not be ignored.
On the flip side, 30 - 32 are important Support levels.
and 29.80 Must not Break on Monthly Basis.
Bullishpattern

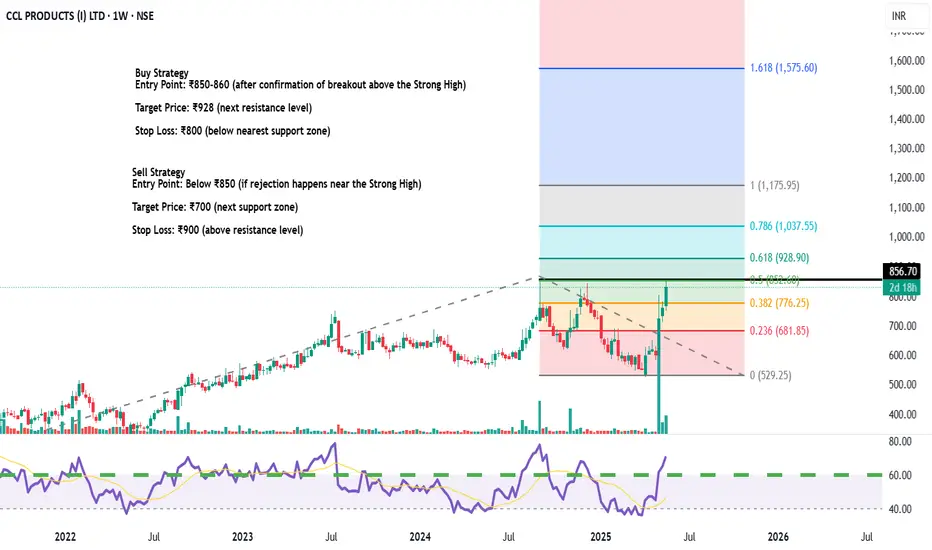
Massive Move Incoming? CCL PRODUCTS LTD Price Prediction!Trade Recommendation
Buy Strategy
Entry Point: ₹850-860 (after confirmation of breakout above the Strong High)
Target Price: ₹928 (next resistance level)
Stop Loss: ₹800 (below nearest support zone)
Sell Strategy
Entry Point: Below ₹850 (if rejection happens near the Strong High)
Target Price: ₹700 (next support zone)
Stop Loss: ₹900 (above resistance level)
Technical Observations
Resistance Zones: ₹900
Support Zones: ₹700
RSI: Check for overbought or oversold levels to confirm entry
XAU/USD (Gold) – Long Opportunity from Ascending Triangle 🟡 XAU/USD (Gold) – Long Opportunity from Ascending Triangle Breakout
Gold is showing a strong bullish structure with a well-formed ascending triangle on the chart, often a signal of continuation in an uptrend.
🔸 Key Technicals:
Rising trendline of higher lows indicates strong buyer interest.
Horizontal resistance at $3,255 has been tested multiple times.
Volume and structure suggest a potential breakout above resistance.
🔸 Trade Idea:
Entry: Upon breakout and retest of the $3,255 zone.
Stop-Loss: Below recent support and trendline (~$3,223).
Take Profit 1: $3,322 – Move SL to breakeven once hit.
Take Profit 2: $3,388 – Based on the height of the triangle projected upward.
This setup offers a clean 4% move with solid risk-to-reward. Ideal for swing traders watching Gold’s reaction to macroeconomic events.
📌 Always wait for breakout confirmation and manage risk wisely.
Let’s see if the bulls have what it takes to push through! 🚀

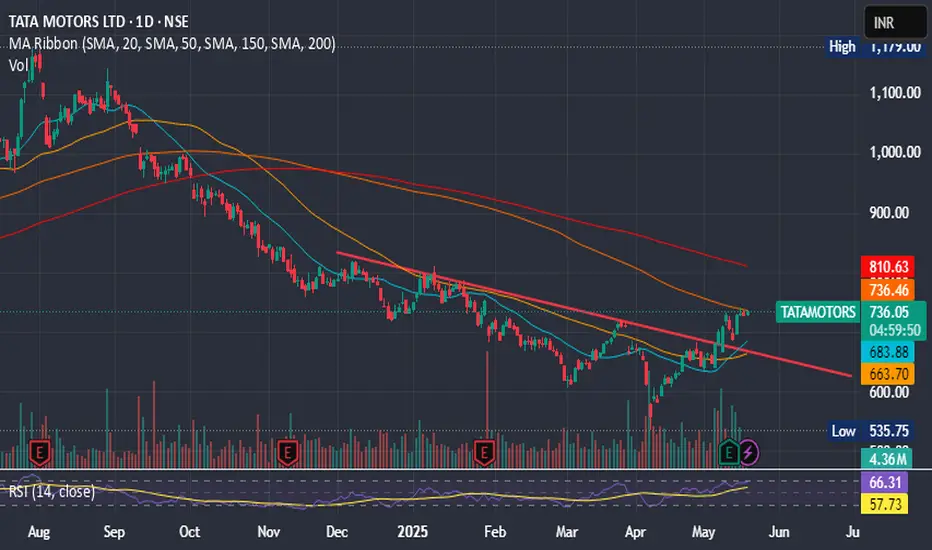
TATA MOTORS IGNITING MOMENTUM - Pivot Points: The classic pivot point is 731.45, with resistance levels at 733.4, 736.3, and 738.25, and support levels at 728.55, 726.6, and 723.7
Tata Motors' short-term trend appears bullish, with analysts predicting an upside target of ₹770–780 in the coming weeks. The stock has shown strong resilience near its support level of ₹715 and is trading above key short-term moving averages, signaling strength.
Key Levels:
- Support: 715–720
- Resistance: 735–740
- Target: 770–780 OR MORE TOWARDS 823
XAU/USD 4H Chart Analysis – Wave 5 Setup in PlayHey traders! Just wanted to share this clean Elliott Wave setup I’m tracking on Gold (XAU/USD).
We’ve just completed what looks like a textbook Wave (4) correction, finding support right at the lower boundary of this long-term ascending channel. Price also respected the 38.2% Fibonacci retracement perfectly, lining up around the $3,090 level. That level is acting as a key demand zone right now.
🌀 According to the wave count:
Wave (3) topped out near $3,500
Wave (4) retraced sharply into the channel base
We are now potentially at the launch point for Wave (5) — the final impulse leg
💹 Wave (5) Projection:
Targeting the upper channel boundary, which aligns closely with $3,740–$3,750
This area also completes the measured move and matches key structural confluence
📈 Technical Confluence Supporting the Bullish Bias:
RSI bounced cleanly from oversold territory
Bullish EMA crossover (20/50) is happening right near the bounce zone
We’re also seeing a break of the corrective trend line, suggesting momentum is shifting back in favor of the bulls
📍 Key Levels to Watch:
$3,149: minor pullback area / possible retest
$3,283: Fib 23.6% resistance — needs to be cleared for confirmation
$3,500: Major resistance & previous high — breakout zone
$3,747: Wave 5 target
⚠️ Invalidation Zone:
If price breaks below $3,090, and especially $3,041, I’ll be reassessing the wave count. That would suggest a deeper Wave 4 or a breakdown in bullish structure.
📌 Conclusion:
I’m watching this setup closely. Gold looks poised for a strong upside leg if current levels hold. The structure is clean, momentum is turning, and we’ve got multiple confirmations in place. I’ll be scaling in with proper risk management and looking to ride this potential Wave 5 to new highs.
Drop your thoughts below — are you long on Gold? Let’s talk setups 👇
@WrightWayInvestments
@WrightWayInvestments
@WrightWayInvestments

XAUUSD – Bullish Flag Breakout & Black curve Line | Target Gold (XAUUSD) is currently shaping a textbook bullish flag pattern on the daily chart, signaling a potential continuation of the strong uptrend that started late last year. This setup, when combined with the custom-drawn Black Mind Curve, provides a structured and disciplined approach for identifying entry, retest, stop loss, and profit targets. Let’s break it down in detail:
🔍 1. Flagpole: The Impulse Move
The rally from around $2,550 in December 2024 to nearly $3,330 in April 2025 formed a steep and aggressive uptrend, which now serves as the flagpole of our pattern.
This impulsive wave represents strong buying momentum and is the backbone of the entire bullish flag structure. It shows institutional interest and heavy volume participation in gold, likely driven by macroeconomic factors such as inflation hedging, USD weakness, or geopolitical uncertainty.
🔷 2. Bullish Flag: The Consolidation Zone
Following the peak, gold entered a consolidation phase, forming two parallel descending trendlines, indicating healthy profit-taking and temporary market indecision. This is not a reversal but rather a pause in the trend, often seen before the next leg higher.
This down-sloping consolidation resembles a flag pattern—a reliable bullish continuation formation where the price temporarily contracts before a breakout.
The flag pattern is still valid as long as price remains inside or breaks above the upper boundary with momentum.
📈 3. Breakout Signal and Retesting Level
As of now, price is testing the upper boundary of the flag. A bullish breakout is anticipated once price closes above the $3,300–$3,350 resistance zone.
Following the breakout, a pullback to retest this same level is expected, forming a new support zone—a classic "breakout–retest–rally" setup.
💡 Retest Zone:
$3,300 to $3,350
This is your key zone to watch for confirmation. A bounce here could offer the best risk-reward entry.
🛡️ 4. Stop Loss Placement: Protecting Your Capital
To manage risk effectively, the stop loss should be placed below the lower boundary of the flag, and ideally just under the psychological round number at $2,970.
This protects your trade from a false breakout or sudden trend reversal while keeping the risk/reward ratio favorable.
🎯 5. Target Projection: Measured Move Strategy
We use the height of the flagpole (approximately $750) and project it upward from the breakout point to estimate the target price.
📌 Target Level:
$4,318 (approx.)
This aligns with technical confluence and psychological resistance above the $4,300 level.
If momentum remains strong and the macro environment continues to support gold prices, this level is a very realistic short-to-medium-term target.
🧠 6. The Black Mind Curve: A Unique Trend Framework
The chart features a custom “Black Mind Curve”, a smooth parabolic line following the overall trend structure. This curve acts as a visual guide for trend strength, suggesting that gold is respecting a higher time frame uptrend trajectory.
It helps reinforce that the bullish structure is still intact—even during short-term pullbacks—by mapping the psychological rhythm of market participants.
This curve is especially useful for swing traders who need to maintain conviction during consolidations.
🧠 Trading Psychology (Mind Framework):
"Charts show the facts; your mind interprets the truth."
Here’s the psychological approach for this trade:
Recognize the Setup: Bullish flag is forming—observe, don’t rush.
Wait for Confirmation: Let price break out and retest—avoid FOMO.
Act on Logic: Enter with defined stop and target—keep emotions out.
Stay Disciplined: Don’t move stop loss irrationally—trust your setup.
Let the Market Work: Once the trade is active, manage it calmly.
🔁 Summary of Trade Plan:
✅ Entry: On confirmed breakout and successful retest of $3,300–$3,350
✅ Stop Loss: Below $2,970
✅ Target: $4,318
✅ Pattern Type: Bullish Flag + Trend Curve Support
✅ Risk-Reward Ratio: ~1:3+ (Ideal setup)
📝 Final Thoughts:
This is a high-probability bullish continuation pattern supported by strong technical structure and psychological market behavior. The breakout is likely to attract institutional flows, especially if it aligns with fundamental tailwinds like falling interest rates or rising inflation.
Stay patient, wait for the retest confirmation, and trade with discipline. Gold is poised for a potential new leg higher—and this setup provides a structured roadmap to ride that move confidently.

USDCHF bullish There's a clear descending triangle with price testing the upper resistance. A breakout is anticipated.
You can enter from FVG (Stop loss 0.83230)or wait a breakout above the triangle, then retest.
We have two targets:
-The distance from the highest point to the support line which will be at 0.8522
-Second target will be swing deal take it on weekly IFVG which will be at 0.87132

Bullish Divergence
Bullish Divergence is appearing on bigger tf.
Crossing & Sustaining 9 may lead it towards
14 - 15.

Bullish Divergence appeared on bigger tf.Bullish Divergence appeared on bigger tf.
Sustaining 33 on monthly basis would be
a positive sign.
36 is the Breakout level.
Immediate targes can be around 43 - 45
If 32 is not sustained on Monthly basis,
we may see further selling pressure towards
25 - 27

BTC: Next Big Move is Brewing – $116K Target Locked!🚀 Hey Traders! 👋
If you’re finding value in this analysis, smash that 👍 and hit Follow for high-accuracy trade setups that actually deliver! 💹🔥
Bitcoin has been following a highly consistent rally-consolidation-breakout pattern over the last few weeks — each time breaking out with nearly +10% upside moves after forming solid accumulation zones. 📈
📊 Observational Pattern:
Let’s break it down:
Phase 1 (April 19–21)
Accumulation range: GETTEX:82K –$84K
Breakout: ~11% gain to ~$93K
Phase 2 (April 25–May 7)
Range: ~$91K–$94K
Breakout: ~10% rally to ~$103.5K
Phase 3 (Current Zone: May 9–Now)
Range: ~$101K–$104K
Price is consolidating, showing signs of continuation.
🧠 What the Chart is Telling Us:
Bitcoin is forming a bullish continuation structure (like a stepping staircase) — a pattern often seen in strong trending markets.
Each green box (marked in chart) represents a clear demand zone followed by a breakout.
If this pattern repeats, we can expect a move towards $114K–$116K.
Invalidation Level: A daily close below $101K would break the rising support and flip sentiment short-term bearish.
✅ Summary:
Target: $114K–$116K
Invalidation: Daily close < $101K
⚠️ Trade with discipline. Let the chart confirm before aping in.
We’ll keep updating as the setup evolves — pin this for reference. 🧠

OIL – Oil India Ltd | Target: ₹429.00🟢 Trade Details:
LTP: ₹417.30
Recommended Buy Range: ₹415.50 – ₹416.00
🎯 Target: ₹429.00
🛑 Stop Loss: ₹408.70
🔍 Technical Snapshot:
✅ Strong bullish candle with volume confirmation
✅ EMA crossover supports the uptrend (9 EMA > 13 EMA)
✅ RSI at 62.22 shows healthy momentum
✅ Breakout above previous range box visible on Daily & 1H TF
📊 BB %B at 0.82 – still room before overbought levels
💼 Strategy:
Suitable for short-term MTF holding (2–5 days)
Risk-Reward ~1:1.5
Trail SL to cost once ₹424+ is breached
Use smaller timeframes (15m / 1H) to confirm entry with volume
For Education Purposes Only

GME bullish with Golden crossGME bullish right now with:
- Golden cross in Day frame chart.
- Dragongly doji today maybe bullish if the volume higher tomorrow.
- MACD bullish .
- Pre Golden cross in Week frame chart too.
Today (05/15/2025) price closed: $28.63.
Entry now, R/R: 3.34.
Price target: $34.40.
Stop-loss: $26.90.
IMO.

AUD/USD 4H | Wave 2 Pullback in MotionAUD/USD is currently completing a corrective Wave (2) within a larger impulsive structure. After the peak of Wave (1) at 0.65145, price has been in a healthy retracement phase, now nearing key fib confluence zones.
🟣 EMA Confluence:
Price is reacting near the 100 & 200 EMA (0.6373–0.6394), which has acted as dynamic support throughout this structure.
We are currently holding above the 0.382 level, with the golden zone (0.618–0.705) sitting just below.
🔄 Bullish Continuation Scenario:
If the pair holds above 0.6285 and we see bullish confirmation candles, we may begin the next leg higher — Wave (3) — targeting 0.66250–0.66766 as initial projection zones.
📊 RSI:
The RSI is hovering just below the 50 level, showing temporary bearish pressure, but has room to recover if structure holds.
🧠 Plan:
📍 Watching 0.6285–0.6214 for final support
📍 Wave (3) target zone: 0.66500+
📍 Invalidation: Clean break and close below 0.6015
🔔 Wave (2) entries are where the patient traders shine. Eyes on structure, and let price do the heavy lifting.
@WrightWayInvestments
@WrightWayInvestments
@WrightWayInvestments

Bullish Divergence on DTF.
Bullish Divergence on DTF.
Important Resistance is around 52.50
However, sustaining this level will
expose 55 - 60 zone.

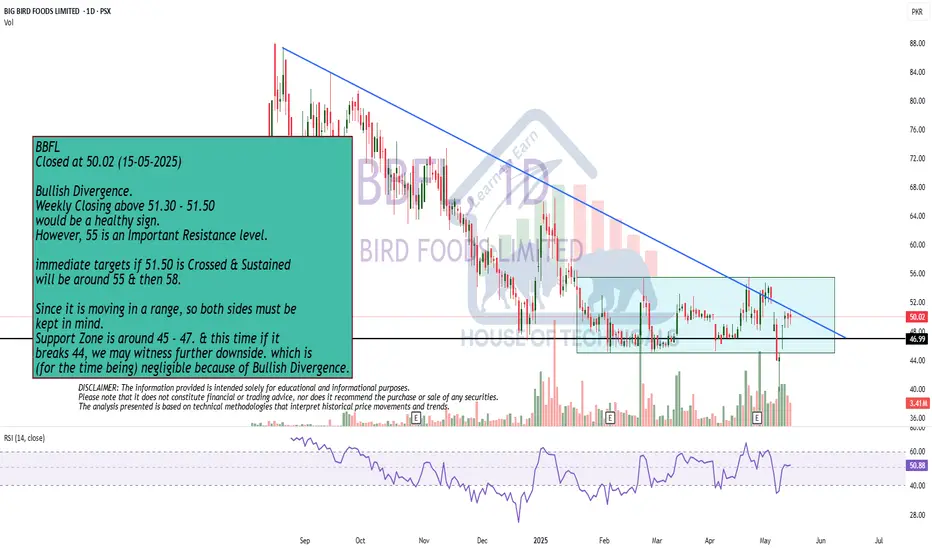
Bullish Divergence.
Bullish Divergence.
Weekly Closing above 51.30 - 51.50
would be a healthy sign.
However, 55 is an Important Resistance level.
immediate targets if 51.50 is Crossed & Sustained
will be around 55 & then 58.
Since it is moving in a range, so both sides must be
kept in mind.
Support Zone is around 45 - 47. & this time if it
breaks 44, we may witness further downside. which is
(for the time being) negligible because of Bullish Divergence.
Inverse H&SBeautiful Inverse H&S pattern in place.
Sustaining 42 may lead it towards 48 & then 50 - 54.
39 - 40 can be an immediate Support.
However, breaking 36 may bring more Selling pressure.

XAUUSDGOLD is been pushed down very hard and now is trading at very crucial level, horizontal and at trendline support.
William percentage range is at over sold level which is also suggesting a relief rally in gold.

Its about the big picture. BUY SKLZImo this sklz stock is an easy buy and hold buy more and hold.
Volume profile on weekly at 11.53 is similar to the volume at 156$ a share
Volume of the passed is all this is missing. Avg down people who have been stuck like me no more 3.80$ buys.

Crossed over 6.05 SKLZSklz will be over 10$ next year mark my words!!!
Daily booming primed for a breakout of the oldest bearish trends dating back to the reverse split… been holding and buying for years got stuck in and now we are bullish with a good avg price waiting for half sell off north off 11.53$ riding the rest.
16.7m shares i own 3.1k

Weekly Range bound | 4H swingFellow trader,
Eicher motors has broken the range bound market in weekly timeframe, and now the market is re-testing.
Aggressive entry : Whoever enter the market immediately after the breakout
Conservative entry : Whoever enter after the market re-test.
The weekly range bound breakout target is 5684 & the SL for the same is 4548
Now in the re-test, there is a clear formation of a swing in 4H/1D timeframe, after a inverted H&S pattern breakout in 1H timeframe consider to enter the trade based on this swing.
Considering the pattern of Weekly or 4H time frame trade can be taken, the SL and Targets are in the chart.
The Risk : Reward ratio for the swing is 1:4.47
Sensibull : sbull.co

ABCD still intact..Couple of Green candles above 20
would trigger more positivity.
Upside targets are intact 27-28 &
then 30+
Should not break 17 now.

$PLTR - Bullish Cup and Handle Pattern on the Weekly ChartNYSE:PLTR Hello everyone! I've been analyzing the weekly chart and noticed a bullish cup and handle pattern that I think is worth sharing with you. This pattern suggests a potential price target of $130 for next year if it follows through as expected. I find this pattern quite interesting and will keep a close eye on it for potential trading opportunities.

2nd Consecutive Cap after my call.
2nd Consecutive Cap after my call.
Now 162 - 163 is the Resistance.
Crossing it will lead it towards 170 & then 189-190
