Bullish Momentum
Closing above Trendline around 133 - 134
would keep it Bullish.
Upside targets can be around 150-160.
However, breaking 131 will bring more
selling pressure towards 113 - 115.
Bullishpattern

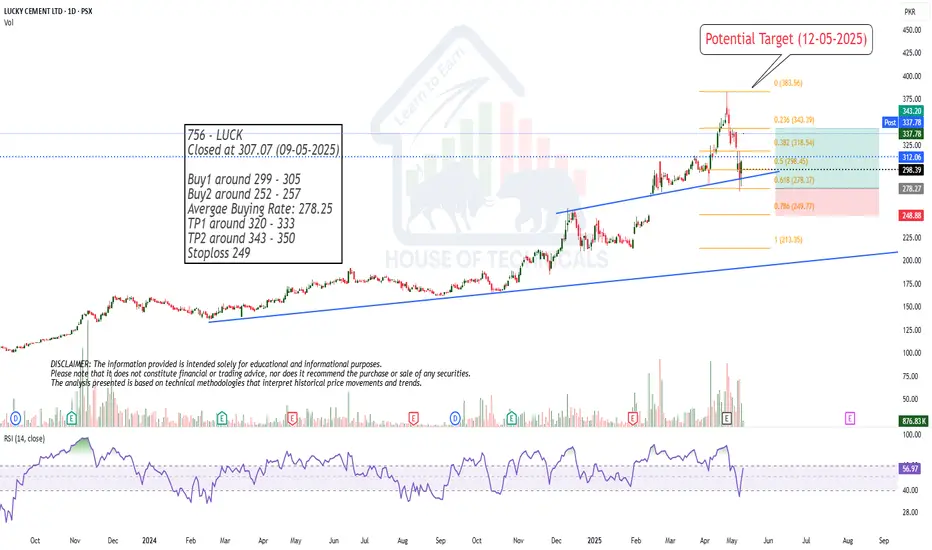
Still Potential to Move Up.It still has the Potential to Move Further Up.
It was Capped today with Huge Volumes.
Potential Target is around 380+
Still Positive
Immediate Resistance is around 149 - 150.
Sustaining this level will move it towards
170.

WCT Breakout Confirmed – Ready for Lift-Off?🚀 WCT Breakout Alert – 80% Potential Incoming?! 👀🔥
Hey Traders! If you're all about high-conviction plays and real alpha, smash that 👍 and tap Follow for more setups that actually deliver! 💹💯
WCT has finally broken out of its long-standing symmetrical triangle on the 4H timeframe 🔥. After weeks of consolidation, we’re seeing a fresh move building up, hinting at strong momentum ahead.
🔎 Chart Insights:
✅ Breakout above resistance zone ✔️
📈 Retest happening around the breakout zone ✔️
📊 Previous pump: 81% surge! Will history repeat?
Trade Idea:
Entry: Current Market Price (CMP) and add more in dip
Targets: $0.44/$0.48 / $0.56 / $0.68 🎯
Stop Loss: $0.35 🚨
Lev: Use low leverage (Max 5x)
The chart looks clean with solid structure—keep an eye as this can build up for a big move 💥.
💬 What’s your take? Drop your analysis or ride along with this setup!

Is ETH - Next 3,000?ETHUSDT – Market Insight & Price Structure
Ethereum has been shaping a falling wedge pattern over the past 2 to 3 months—a structure that typically suggests a bullish reversal. Recently, price action confirmed a breakout above the key resistance zone between $2034 and $2040, along with a clean break of the upper trendline of the wedge. These movements point to a strong bullish signal, suggesting potential continuation to the upside.
Currently, Ethereum is approaching a significant resistance level around $2860. If price reaches this zone, we’ll be watching closely for confirmed reversal signals to consider a potential short/sell setup.
On the other hand, the primary bullish trend trade remains valid near the $2160–$2150 support range. A long position will only be considered upon confirmation, such as a bullish engulfing candlestick pattern, market structure shift (MSS), or other trusted technical signals.
Disclaimer: This is not financial advice. Always do your own research (DYOR).

Breakout Confirmed: XRP on the Move Toward $4+🚀 XRP Breakout Alert – 70% Potential Incoming?! 👀🔥
Hey Traders! If you're all about high-conviction plays and real alpha, smash that 👍 and tap Follow for more setups that actually deliver! 💹💯
📈 XRP/USDT – Breakout Alert! 🚀
XRP is breaking out from a long-term falling wedge pattern on the 12H timeframe, signaling the potential for a strong bullish move ahead!
🔹 Entry: CMP $2.39 – Add more up to $2.32
🔹 Targets:
• TP1: $2.85
• TP2: $3.32
• TP3: $3.78
• TP4: $4.13
🔻 Stop-Loss: $2.09
⚙️ Leverage: Up to 5x (Trade responsibly)
This structure mirrors the previous 70%+ pump from the same wedge formation. History might just be ready to repeat. 👀
Let’s ride this breakout with tight risk management! 💥

#SEIUSDT remains in bullish continuation mode📉 LONG BYBIT:SEIUSDT.P from $0.2747
🛡 Stop loss: $0.2640
🕒 Timeframe: 4H
✅ Market Overview:
➡️ Falling Wedge pattern has played out — confirmed breakout to the upside.
➡️ A strong Inverse Head and Shoulders pattern is visible — neckline broken with momentum.
➡️ Volume increases on upward impulse — bullish confirmation.
➡️ Current price is consolidating slightly — likely preparing for the next leg up.
➡️ POC at $0.1697 is far below — market structure flipped bullish.
➡️ Clear upward projection toward the $0.2810–$0.2910 range.
🎯 TP Targets:
💎 TP 1: $0.2810
💎 TP 2: $0.2870
💎 TP 3: $0.2910
📢 Holding above $0.2740 confirms bullish structure.
📢 Watch for minor resistance near TP1, then potential continuation to TP2 and TP3.
📢 Secure partial profits at TP1, and let the rest ride toward higher targets.
📢 It’s advisable to partially take profits near the specified resistance levels.
📢 A retest of the breakout zone (around $0.22) is possible — this can be used for adding to the position.
🚀 BYBIT:SEIUSDT.P remains in bullish continuation mode — targets still active!

PIXEL Breakout Alert: Ready for the Next Leg Up?🚀 PIXEL Breakout Alert – 100% Potential Incoming?! 👀🔥
Hey Traders! If you're all about high-conviction plays and real alpha, smash that 👍 and tap Follow for more setups that actually deliver! 💹💯
PIXEL has broken out from a bull flag on the 4H timeframe after consolidating for weeks. This clean breakout signals a potential trend reversal with strong upside momentum building. 💥
Trade Setup:
👉 Entry: $0.0380–$0.0400 (post-breakout zone)
🎯 Targets:
$0.0455
$0.0520
$0.0630
$0.0770
🛡 Stop-loss: $0.0360 (below channel re-entry)
Why I Like It:
Clear breakout of the falling channel
Strong volume surge confirms momentum
Previous 100% move shows solid potential
If BTC stays stable, this one looks set for a strong run! 🚀 Keep it on your radar.

AXL/USDT – Falling Wedge Breakout! Time to Ride the Wave!!🚀 AXL Breakout Alert – 100% Potential Incoming?! 👀🔥
Hey Traders! If you're all about high-conviction plays and real alpha, smash that 👍 and tap Follow for more setups that actually deliver! 💹💯
AXL has broken out of its long-term falling wedge pattern on the daily timeframe—this is a strong reversal signal and could set the stage for a big move ahead! 🔥
🟢 Entry Zone:
CMP (Current Market Price)
Add more up to: $0.38
🎯 Targets:
🎯 TP1: $0.515
🎯 TP2: $0.634
🎯 TP3: $0.751
🎯 TP4: $1.007+
🛡️ Stop Loss: $0.325 (below wedge support)
💡 Insight:
This breakout is aligning with the overall bullish momentum we're seeing in the altcoin market. Watch for a healthy retest of the breakout zone to confirm strength. 🚀
📊 Risk Management Tip: Start taking partial profits at each target and trail your SL to lock in gains.
Let’s ride this breakout smartly! 🔥

SONIC | (Previously Fantom) | HUGE BULLISH PatternFTM has now officially been replaced on most exchange and is now trading as Sonic.
At first we saw an initial drop, typical "sell the news" actions, but now there is a bullish pattern forming in the 4h timeframe.
SONIC is bullish because:
✅ Upwards trendline trading
✅ Higher Lows
✅ Bullish chart pattern: W-Bottom
_______________
BYBIT:SONICUSDT

TWT ANALYSIS🚀#TWT Analysis :
🔮As we can see in the chart of #TWT that there is a formation of "Falling Wedge Pattern". Some time ago the same structure was made and it performed well and this time also the same is happening with a perfect breakout
🔰Current Price: $0.8464
🎯 Target Price: $1.0865
⚡️What to do ?
👀Keep an eye on #TWT price action. We can trade according to the chart and make some profits⚡️⚡️
#TWT #Cryptocurrency #TechnicalAnalysis #DYOR

Bitcoin bullish rsi can lead to 133kbitcoin can lead to 133k without any stop as bullish convergence and diversion has been identified with RSI above 50 there is no stopping.
MA & EMA BOTH ARE SHOWING GOLDEN CROSS OVER .
Probable higher high ,lower low pattern can form for more push to 200k

CELH - Golden cross bullishWith Day frame chart, we have Golden cross and MACD bullish.
The price today (05.06.25) closed at $35.52 (up 4.81% with ER fell !!!).
The price after hours: $35.39.
If entry right now. R/R: 2.91.
Price target: $42.52.
Stop loss: $32.94.
IMO, amateur trader.

Still a Good Buy but with proper Stoploss.Still a Good Buy but with proper
Stoploss.
Immediate Resistance is around 134 - 135
Crossing it may take the price towards
140 - 144 initially. & then the Double Bottom
will play and may hit 160+

Morning Star formationMorning Star formation
Weekly Closing above 125 would be positive.
However, 143 - 144 is the resistance zone.
Crossing it with Good Volumes will move the
price towards 155 - 160.


Short-Term Trade Setup: NZDCAD Eyes 0.82898–0.83110 TargetsGood day Traders,
Trust you are well.
Below is my analysis of NZDCAD.
Overview:
NZDCAD is retracing from the recent high at 0.83050, currently trading around 0.82628. Price action is approaching a key support zone between 0.82470 – 0.82285, an area that previously triggered bullish reactions. Momentum indicators are showing bearish pressure, with red histogram bars visible on the chart.
Idea:
Although bearish momentum is present, the histogram shows a slight decrease in selling pressure, hinting at a potential slowdown in the current downtrend. If the pair holds above the 0.82287 level, it could signal a potential reversal or bounce. This would open room for bullish targets at: 0.82898, 0.83039 and 0.83110.
However, a confirmed break below 0.82287 could expose the next support around 0.82100.
Conclusion:
The pair is at a critical support zone, with decreasing momentum suggesting that sellers may be losing strength. A bounce from current levels could provide a short-term buying opportunity, while a break below 0.82287 would invalidate the bullish outlook.
Cheers and happy trading!

COW ANALYSIS🚀#COW Analysis : Pattern Formation
🔮As we can see in the chart of #COW that there is a formation Inverse Head And Shoulder Pattern and it's a bullish pattern. If the candle breaks and sustain above the neckline then a bullish move could be confirmed✅
🔰Current Price: $0.2790
⚡️What to do ?
👀Keep an eye on #COW price action. We can trade according to the chart and make some profits⚡️⚡️
#COW #Cryptocurrency #TechnicalAnalysis #DYOR

WHY WILL IT GO HIGH?Reasons indicating strong potential:
- Large and active community on social media
- High scammer activity
- Trap for inexperienced users: selling on DEX at 3x lower price than on CEX due to low DEX liquidity
Let me know if you'd like it even more formal or formatted for a report.

Bitcoin (BITX) getting ready for a parabolic move? Here is a chart of probably my favorite swing trade for the year.
I am keeping it simple with this chart though. I am a firm believer in simple when it comes to trading. I think the previous descension and breakout is playing out very similarly to the current one. Both had a double top rejecting from their respective trendlines following the initial breaks of structure. BITX is currently making its second tap of the the trendline. If it plays out like the previous structure did that would suggest w could see one more low in store.
I don't believe this to be the case but if it is this run could be postponed until the end summer/beginning of fall. I think it is more important to point out the relative strength in Bitcoin as of late, the weakness in the US dollar, as well as global liquidity having broke out months ago.
I think the most likely scenario is a pullback from this point which will be followed by a higher low printing. I will say I also expect this pullback to be steeper than the one from the previous descension. Bitcoin and Indices are a lot more overextended than they were last time around and the structure in indices is a lot weaker than before.
All this being said I am expecting a breakout to occur over the next several weeks just based off probabilities. It all depends on if BTC and indices and hold their respective demand/support levels. Bitcoin needs to hold 85k in order for a summer breakout to occur. For the S&P equivalent level this could be somewhere around 5200-5300.
If these assets are not able to hold these levels my confidence will shift pretty dramatically. I would still expect a major rally to take place around the Q4 timeframe but I would be expecting a lot less upside. Price would likely have to chop around for a while before deciding if it wants to continue to the upside. I am basing this off market structure/Dow theory. It is important to take all possibilities into account and ultimately let the charts do the talking.

Sklz bull pendant!?5.60 by weds could be Monday if proper momentum
Let's go paradise and skillz holdinglong been here since 2020 and I. Not FKN leaving sklz to moon weekly chart Goals 156usd per share
Where my longs at! Not financial advice

AGL - Bowl chart with a Golden cross- AGL is in a long-term uptrend.
- AGL made a golden cross on 04.08.2025 (MA50 & MA200).
- The price chart is forming a bowl of patterns.
- Price now (05.01.2025): $3.93.
- Price target: $7.62.
If the bowl pattern fails, cut loss when the intraday price is below $3.66.
IMO, amateur trader.

CONFUSION SETS IN.....Hello! You are looking at a 6 hour chart, here.
Starting out, we can see the 100 day moving average starting to ascend above the 14 day moving average, which indicates bearish momentum is building!
On the other hand, we can also see what appears to be a bullish pennant forming, which indicates bullish momentum to the upside.
As a disclaimer, I have not taken into account volume or any oscillators, but it appears this pair will be bullish for the short term, but bearish in the long term.
Depending on whether you are a long term or short term trader, I personally like what I am seeing from this 6 hour chart! Let me know if this was helpful for you! I love to read comments. Thank you for reading. Trade wisely.
