6month log chart on xrpusd suggests crazy potential targetsThe bull pennant we are in shown here on the 6month time frame seems to have a symmetrical triangle for its flag. The breakout target for just the symmetrical triangle is in the $33 range. Factor in the pole of the flag and the potential target skyrockets to 1.2k. Definitely not financial advice and certainly no guarantee it will hit either target as it’s still up in the air if log chart targets reach their full target as reliably as linear chart patterns do. Even if it does hit these targets you can see the apex of the pennant in its current trendline trajectories doesn’t occur until 2026. The only way I see price remaining inside this triangle for that long is indeed if the SEC ripple case is extended through appeal and taken to the Supreme Court. Hopefully not but it isnt impossible. If this were to occur I would simply keep dollar cost average accumulating until it was to break out from the triangle which would give me more opportunity to take some profit at the first target but then also hold onto some of the asset in case it does indeed reach the full bullflag breakout somehow all the way up at 1.2k. Simply posting this hear so I can see how well price action chooses to follow this pattern over the next year or few. Once again *not financial advice*
Bullish Pennant

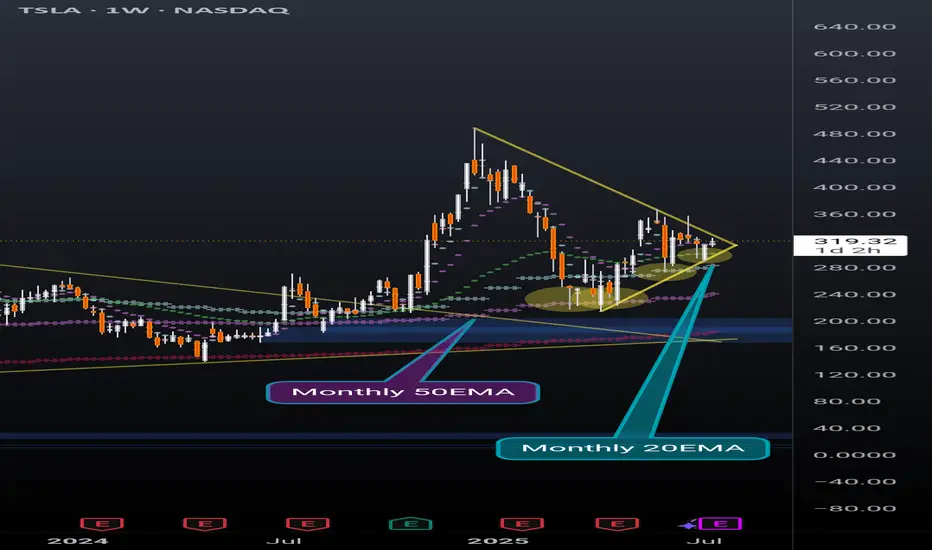
TSLA weekly coiling into something powerfulNever doubt the power of TSLA. Recently broke out of a huge pennant, and now nearing the end of another pennant while simultaneously holding support above the daily 20EMA(overlayed on this weekly chart).
Also recently found support off of the monthly 20EMA (overlayed on this weekly chart) and took 2 direct hits on the monthly 50EMA (overlayed on this weekly chart) before that and rallied up. It will take a lot to crush this setup but anything can happen. Possibly a longer pennant formation.
I'm just a cat not a financial advisor.
Bitcoin (BTC/USD) 4H CHART - BULLISH PENNANT PATTERN 📊 Bitcoin (BTC/USD) 4-Hour Chart – Bullish Pennant Formation
Bitcoin (BTC) forming a bullish pennant pattern on the 4-hour timeframe.
A bullish pennant often appears after a strong upward move, followed by a period of consolidation, and usually signals a continuation to the upside.
🔍 Key Highlights:
Pattern: Bullish Pennant – a continuation pattern that forms after a strong rally (flagpole), followed by a tightening price range.
Resistance Trendline: The upper black line showing lower highs — where price has repeatedly faced selling pressure.
Support Trendline: The lower black line showing higher lows — where buyers have been stepping in.
Breakout Zone: Price is nearing the apex of the pennant. A breakout above the resistance line would likely confirm the bullish move.
Target Projection: If the breakout is successful, the target is around $123,960, based on the height of the flagpole.
Breakout and Retest: The chart also shows a possible retest of the trendline after breakout, which is common and can offer a second entry point for traders.
Volume Watch: A valid breakout usually comes with increased volume. Monitoring this can help confirm the move.
📉 Downside Possibility:
If the price fails to break out and falls below the support trendline, it could invalidate the pattern and lead to a bearish move — possibly retesting the $110,000 area.
---
The market is at a decision point. If BTC breaks above the resistance and retests successfully, it could push toward $123K. However, traders should watch for both breakout confirmation and false moves.

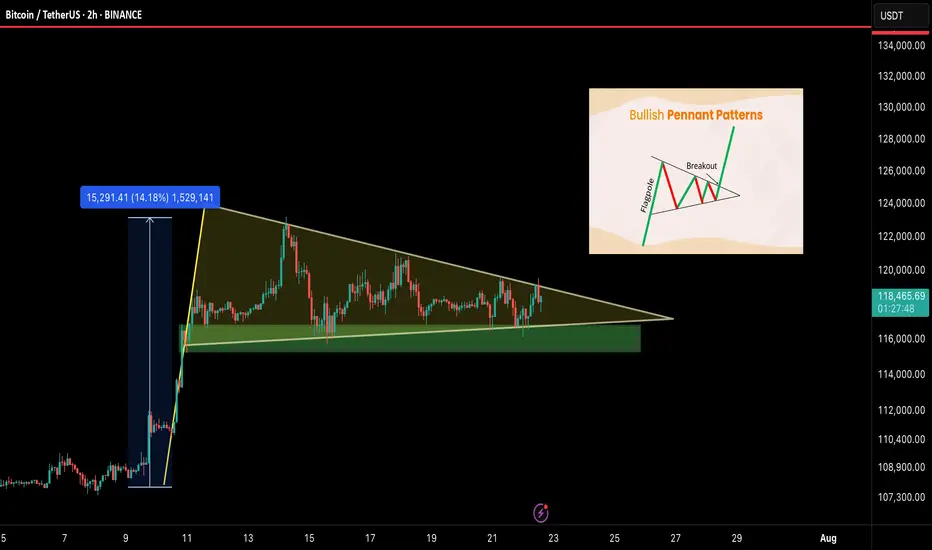
BTC/USDT – Bullish Pennant Setting Up for the Next Leg!Bitcoin is currently forming a bullish pennant — a classic continuation pattern — right after a strong 14% impulse move. This type of structure often leads to a breakout followed by another powerful rally. And it’s coiling up nicely.
🧠 Technical Breakdown:
🟢 Bullish pennant formation in progress
🔽 Support zone: $115.5K – $116.5K
📏 Flagpole projection targets $135K+ on breakout
⚠️ Currently consolidating with lower volatility — breakout could be near
🔍 What to Watch For:
Clean breakout above pennant = breakout confirmation
Daily close below $115K = invalidation zone
Volume spike will likely signal the next move
📢 Final Take:
BTC is showing healthy consolidation after a strong move, and this pennant could launch us toward $135K and beyond. Keep your eyes on the breakout and manage risk wisely.
💬 Share your thoughts below & smash that ❤️ if you’re watching this move!
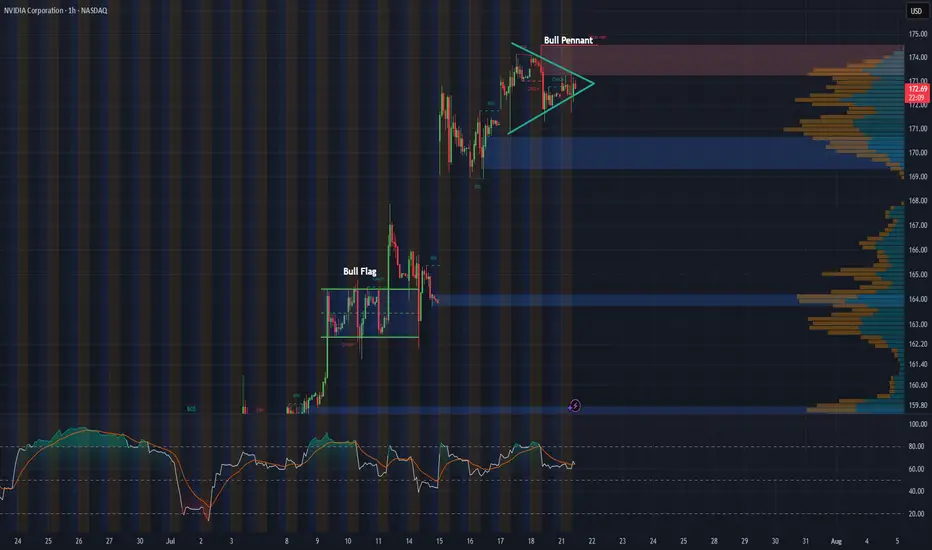
NVDA 1-Hour Chart UpdateHey everyone, just wanted to share a quick update on NVDA’s 1-hour chart. Following last week’s bull flag breakout, the stock appears to be consolidating into what looks like a solid bull pennant formation.
With major tech earnings on the horizon and the recent approval to sell H20 chips to China, this pattern could be setting the stage for another breakout. Will NVDA continue its impressive rally, or is this just a breather before the next move?
Is it finally time for a rally?Looking at NVIDIA (NVDA) on the weekly chart over the past two years, a significant gap up becomes apparent around April, which persisted for much of the year. Considering the recent news and the stock's pullbacks lately, this may be the moment for NVDA to resume its upward grind. The coming weeks will reveal its direction.
Additionally, it's worth noting the formation of a massive bull pennant on the weekly chart. If history repeats itself and this pattern holds, the next 2 to 6 weeks could prove to be a thrilling period for NVDA.

Be careful with RIPPLE !!!The pennant pattern has been broken, and the price follows an AB=CD pattern, targeting a rise above the 5 dollar.
Best regards CobraVanguard.💚

Hbar breaking upwar from fallingwedge/pennantAlso in a smaller double bottom setup here. *not financial advice*

Sperax: Bullish pennant.Sperax is consolidating in a bullish pennant pattern after a strong recovery rally off the March lows. Price action has tightened between ascending support and descending resistance, forming a textbook continuation setup. Volume has decreased during this compression, which is often a precursor to explosive movement.
Fundamental Catalysts (Despite GENIUS Act Stalling):
Retail DeFi Narrative is Still Alive – While the GENIUS Act failed in the Senate, the momentum for regulatory clarity in the DeFi space continues. Future bills or executive actions could unlock capital flows to protocols like Sperax.
Deflationary Pressure —Over 13% of the total SPA supply has been burned, with more tokens locked and lost. The actual circulating supply is meaningfully lower than the total supply shown on aggregators.
SIP-70 has been passed , shifting SPA emissions from an automatic release model to a DAO-controlled emission schedule. This marks a significant milestone towards sustainable tokenomics and the preservation of long-term value.
Long-Term Accumulation – Wallet data and order books suggest that whales and long-term holders quietly accumulate during this sideways range.
Sperax remains a low-cap token with outsized potential in the next altseason if it secures even one meaningful partnership or fiat on-ramp.

SUI on its way to the teal pennants breakout targetSui has joined the bullishness here as it has brown up from the pennant and well on its way to the target. *not financial advice*

Teva: The flag’s ready — someone just needs to hit “launch”Teva Pharmaceutical (TEVA) is setting up for a potential continuation move after a clean impulse. On the daily chart, we have a textbook bull pennant — and not just any sloppy one. Price has broken above the 200-day moving average, and all key EMAs (50/100/200) now sit below price, confirming a solid bullish structure.
Volume behavior fits the script: declining inside the pennant, signaling pressure is building. More importantly, the Volume Profile reveals a low-volume void above current levels — meaning there’s little resistance until we hit the $22+ zone. In other words, once this breaks, it could run fast.
RSI is comfortably in bullish territory without being overheated, and the flagpole projection gives us clean upside targets:
– Entry: breakout above pennant resistance
– Target: $22.80 — full flagpole height
– Support: $17.60 — confluence of 0.5 Fib + volume base
TEVA isn’t asking for confirmation anymore — it’s showing it. All systems are technically armed. Now we just wait for the market to press the button.

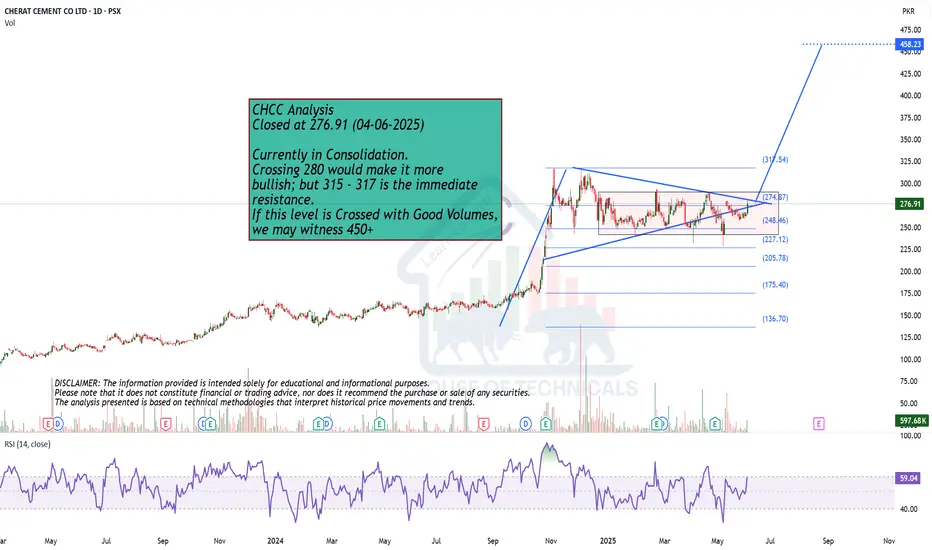
Currently in Consolidation.
Closed at 276.91 (04-06-2025)
Currently in Consolidation.
Crossing 280 would make it more
bullish; but 315 - 317 is the immediate
resistance.
If this level is Crossed with Good Volumes,
we may witness 450+
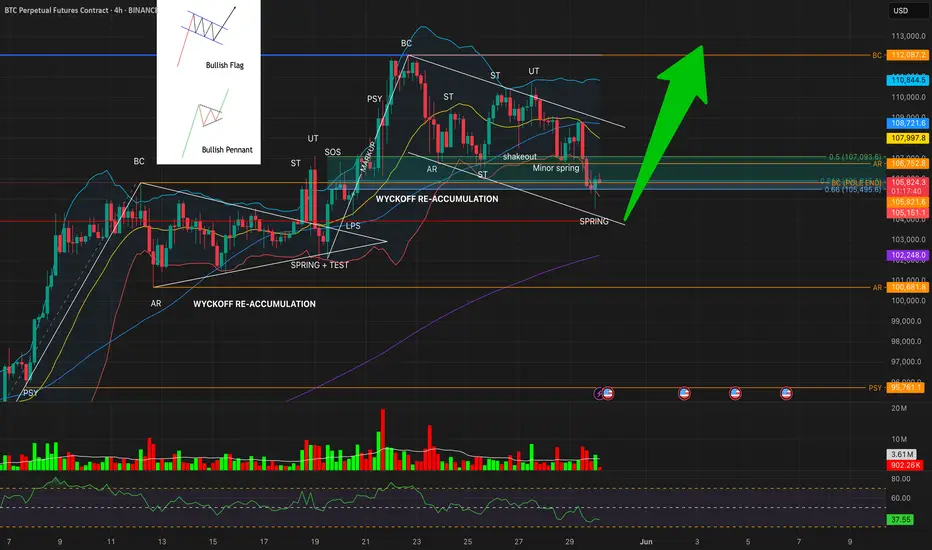
Bitcoin 4H Outlook: Dual Wyckoff Reaccumulation in Play⚙️ Technical Thesis:
We're currently witnessing the unfolding of two back-to-back Wyckoff reaccumulation structures on the 4H timeframe:
📦 Reaccumulation #1 (Left)
Structure: PSY → BC → AR → ST → Spring + Test → LPS → SOS
Bullish pennant formed after Spring, leading to a strong breakout
BC of this phase (105,821) now acts as a major upper resistance
📦 Reaccumulation #2 (Right)
Structure: BC → ST → UT → Shakeout → Minor Spring → SPRING (current)
Current price has tagged Spring at the convergence of:
Lower Bollinger Band ($105,174)
61.8% Fibonacci retracement ($105,915)
🧪 Market Internals
RSI: 38.31 → deeply oversold, aligned with a Spring phase
Volume: Fading on last leg down, hinting exhaustion
BBs:
Upper: $110,828
Basis: $108,006 (confluent with 55 SMA)
Lower: $105,174
200 SMA: $102,248 (macro support)
Pattern context: Another bullish flag is forming within the second structure
🎯 Trade Expectations (Pending Spring Test as Confirmation)
If this Spring holds:
🔄 LPS → Look for bullish reaction with increased volume
TP1: AR retest around $106,752
TP2: 55 SMA + BB Midline confluence at ~$108,000
TP3: Range target or previous BC level near $112,000–$113,000
A decisive break below $105,000 with RSI < 35 and rising volume would invalidate the Spring and shift focus to breakdown risk.
🔍 Wyckoff View
This is a classic Spring setup from a Wyckoff reaccumulation structure. Two sequential structures are visible, and the first structure’s BC now serves as the foundational support for the second. This kind of layered support builds conviction — but needs validation via LPS and SOS phases.
Yes the major trendline was broken, but we are now consolidation and reaccumulation for the next leg up, unless the pattern is invalidated.
🕹 No short setups active unless structural failure confirmed.
💬 Share your view: do you see this as a Spring or potential failure?
#BTCUSDT #Wyckoff #Reaccumulation #CryptoTrading #BitcoinAnalysis #TechnicalAnalysis #Spring #LPS
PNUTUSDT – Breakout Brewing from Bullish Pennant!PNUT Bullish pennant Formation – 200%+ Potential Incoming?! 👀🔥
Hey Traders! If you're all about high-conviction plays and real alpha, smash that 👍 and tap Follow for more setups that actually deliver!
PNUT is consolidating inside a bull pennant after a massive 200%+ rally earlier this month. Currently, it's sitting near the lower support zone, forming higher lows—a sign of growing pressure for an upside move.
🔍 Setup Highlights:
Bull Pennant forming
Strong bounce zone (green box)
Potential breakout path marked in projection
📌 Trade Idea:
Entry: $0.31–$0.28 support zone
Targets: $0.39 / $0.46 / $0.55 / $0.72
SL: Below $0.27
Leverage: 5x–10x (only for experienced traders)
Keep a close eye—once PNUT clears the triangle resistance, things could move fast.
What are your thoughts?

Bitcoin (BTC/USD) Bullish Breakout – Targeting $116K Using MMCBitcoin has printed one of the most powerful continuation setups in technical analysis — a Bullish Pennant — and it's playing out beautifully, backed by Mirror Market Concepts (MMC). Let's break down the structure, the reasoning behind this move, and how smart money could be driving this price action.
📈 1. Market Context – The Impulsive Rally That Set the Stage
The first thing to notice is the strong bullish move that occurred before the pennant started forming. This rally is important because a Bullish Pennant is a continuation pattern, and without a strong preceding trend, the pattern loses its credibility.
This initial move acts as the “pole” of the pennant — a clean, impulsive leg upward, driven by demand and momentum.
Such moves are often the result of strong buying from institutions, retail FOMO, or positive macroeconomic catalysts.
🧠 Psychology Insight: The rally injects confidence into the market. Buyers who missed the move now wait for a pullback, while early buyers prepare to scale in on continuation.
🔺 2. Bullish Pennant Structure – The Calm Before the Next Storm
After the bullish pole, the price enters a tight consolidation phase, forming a symmetrical triangle:
Lower highs and higher lows compress price into a pennant shape.
Volume usually declines during this phase, showing that the market is resting, not reversing.
The market is essentially "charging up" for the next big move.
💡 Why This Matters: The Pennant shows temporary equilibrium between buyers and sellers. A breakout typically signals which side wins — and in this case, buyers have taken control.
🪞 3. Mirror Market Concepts (MMC) – The Secret Weapon
This chart also showcases the power of MMC (Mirror Market Concepts), a strategy based on the idea that the market tends to reflect its previous behavior, structure, and reactions.
Here’s how MMC applies:
The price broke out of the pennant, then came back to retest the breakout area, just like it did during the previous breakout from the consolidation zone.
The Mini SR – Interchange zone acted as resistance before, and now it’s acting as support — a classic Support/Resistance flip (SR flip).
The retest behavior mirrors the earlier breakout structure, offering a confirmation that the market is following a familiar rhythm.
📊 Trading Logic: When a market behaves similarly at two different points in time, it’s often a signal of institutional activity — "smart money" repeating proven entry points and exits.
🔁 4. Retesting – The Entry Opportunity for Smart Traders
After the breakout from the pennant, price didn’t just shoot up — it pulled back to retest the broken structure. This is a high-conviction setup in technical trading:
✅ Retest confirms the breakout was valid (not a fakeout).
✅ It provides a safe entry point for traders who missed the initial impulse.
✅ Volume and bullish candle structure post-retest indicate buyer interest.
📌 The Mini SR – Interchange zone, around $106,631.69, acted as the perfect launchpad for the next bullish leg.
🎯 5. Trade Setup – High R:R Swing Opportunity
Let’s look at the exact setup this chart offers:
Entry: After the breakout and retest near $107K–$108K
Stop Loss (SL): Below the support zone at $106,631.69
Target (TP): At $116,105.65 — derived by projecting the height of the pole from the breakout zone
This gives an excellent reward-to-risk ratio, a key principle in sustainable trading.
🧠 6. Psychological Fuel – Why This Move Has Legs
Traders who missed the earlier rally are now watching closely for entries.
Retail traders are seeing confirmation.
Institutions may already be in from lower levels and are now defending support zones.
Sentiment is bullish post-retest, increasing volume and momentum.
It’s a self-fulfilling prophecy: as more traders recognize the pattern and the confluence, the trade becomes even more likely to play out.
🗓️ 7. What to Watch Next – Smart Risk Management
Even though the pattern looks strong, smart traders always remain cautious:
✅ Move SL to breakeven once price moves halfway toward the target.
🔄 Consider taking partial profits near interim resistance zones (like $112K).
📆 Stay alert for economic events or Bitcoin news that could cause sudden volatility.
📘 Conclusion: Bullish Setup with Proven Structure and MMC Confirmation
This BTC/USD chart is a textbook example of a Bullish Pennant breakout, with added strength from Mirror Market Concepts and a clean SR Flip retest. For swing traders and price action lovers, this setup offers a structured, strategic, and smart opportunity to ride the next wave of Bitcoin momentum.

EURUSD | Bullish Pennant Breakout – Retest Before the Target📊 EUR/USD (1H Timeframe)
The EUR/USD pair has shown a textbook example of a bullish pennant formation, which typically occurs during strong uptrends and signals a continuation of the bullish momentum. The price had an impulsive rally prior to the formation of the pennant, indicating a strong underlying bullish sentiment.
Following the rally, the market entered a period of consolidation where price action began to coil between two converging trendlines – this is the pennant structure, marked by lower highs and higher lows.
This tightening price action typically suggests that market participants are pausing to digest the previous move, often leading to another breakout in the same direction – in this case, bullish.
📐 Key Technical Elements Highlighted:
Bullish Pennant Formation:
Characterized by a sharp move up (flagpole) followed by a tight consolidation range (the pennant).
Volume generally contracts during consolidation and expands on breakout, confirming momentum.
Breakout and Retest:
Price has broken above the upper resistance line of the pennant.
Now pulling back for a retest, a healthy technical behavior often seen in strong setups.
This pullback offers a second chance for entry for traders who missed the initial breakout.
Support & Resistance Zones:
SR Interchange Zone (previous resistance turned into potential support).
Minor Resistance Zone above, now likely invalidated by breakout.
These zones are critical in evaluating potential price reaction and risk control.
Projected Target:
Based on the measured move from the pole height of the pennant added to the breakout point, the projected target stands near 1.14315, a level of prior structural interest.
🎯 Trade Plan – Technical Strategy
⚠️ This is a hypothetical scenario for educational purposes. Always manage your risk.
Entry Zone: On confirmation of a successful retest (bullish price action at trendline support)
Stop Loss: Below the pennant’s lower trendline or the SR interchange zone (1.1245 – 1.1260 region)
Target: 1.14315 (based on breakout projection)
Risk-Reward Ratio: Approx. 1:2 to 1:3 depending on entry precision
🔍 Psychological & Market Structure Notes:
A bullish pennant is a sign of accumulation after a strong rally – it tells us that buyers are resting, not gone.
The retest shows institutional behavior: smart money often allows price to come back to a breakout level before driving it higher again, to shake out weak hands and trap late sellers.
Momentum traders and breakout traders often wait for confirmation on the retest to pile in with higher confidence.
📚 Educational Takeaway:
This setup serves as a great case study in:
Continuation patterns (Bullish Pennants)
Breakout-retest behavior
Measured move target projections
Trend confirmation techniques
Market psychology and structure
If you're learning technical analysis, this is a high-probability pattern that occurs across many asset classes including forex, crypto, and stocks.

TRUMP is Back on the Move! Breakout Trade Setup Inside!!🚀 TRUMP Bull Pennant Breakout – 40% Potential Incoming?! 👀🔥
Hey Traders! If you're all about high-conviction plays and real alpha, smash that 👍 and tap Follow for more setups that actually deliver! 💹💯
TRUMP is breaking out of a symmetrical triangle in the 4H time frame — signaling the potential for a massive upside move! The last time we saw similar consolidation, it exploded with over 40% gains.
📈 Entry: Current Market Price
🎯 Target: $18.70+
🛑 Stop Loss: $12.58
Lev: Use low lev (Max 5x)
📊 Risk/Reward: High-reward setup for breakout traders
🔥 With momentum building and volume picking up, this setup could deliver strong returns if the breakout sustains.
💬 What are your thoughts on this move? Are you trading $TRUMP?

BTC Bullish Pennant Breakout – Eyeing $107K TargetBitcoin (BTC/USD) has recently demonstrated strong bullish structure following an extended consolidation phase. The current price action suggests a textbook bullish pennant breakout, which often indicates trend continuation in strong markets. This technical setup follows a period of accumulation and consolidation between March and April, with a well-defined pennant formation leading into the breakout in early May.
Technical Analysis:
Historical Context & Structure:
From mid-February to March, BTC experienced significant downward pressure, eventually finding major support in the $76,000–$78,000 zone, which is clearly outlined on the chart as a key support level.
This support zone initiated a reversal, forming the base of a new bullish leg that marked the beginning of the next trending phase.
Consolidation Phase – The Ellipse Region:
The price action within the elliptical region (mid-March to late April) reflects accumulation behavior, with multiple rejections on both upper and lower bounds, indicating balance between buyers and sellers.
This phase formed a foundational structure, setting up the stage for a breakout pattern.
Pennant Formation (Late April – Early May):
The price sharply rallied in late April, breaking out of the consolidation and moving into a tight triangular pennant pattern — a classic continuation formation.
This bullish pennant features converging trendlines, lower volume, and diminishing volatility as price consolidates — all typical characteristics.
Breakout and Retest:
The breakout from the pennant occurred on high momentum with strong bullish candles.
Post-breakout, the price approached the resistance zone (~$103,000–$105,000) and is currently attempting to establish support at this level.
This retest adds validity to the breakout and opens the door for further upside continuation.
Trade Parameters:
Entry Zone: Breakout above the pennant (~$99,000–$100,000), confirmed by momentum.
Resistance Zone: $103,000–$105,000 (currently being retested).
Target (Measured Move):
Using the height of the pennant pole (~$20,000 move from $80K to $100K), the projected target lies near $107,307, aligning with horizontal resistance.
Stop Loss:
Set at $93,344, just below the pennant’s lower boundary. This level also aligns with recent structural support and invalidation of the pattern.
Risk/Reward Ratio:
Approx. 1:2.5+, offering a favorable setup assuming trend continuation.
Additional Notes:
Volume:
Although not shown, breakouts from pennants are ideally confirmed by an increase in volume, indicating market conviction. Volume confirmation is highly recommended for trade confirmation.
Market Context:
This setup aligns with broader bullish sentiment in the crypto space and may be reinforced by macroeconomic or ETF-related developments. However, risk management remains key, especially around psychological levels and news-driven volatility.
Conclusion :
Bitcoin is currently in a strong technical position. The breakout from the bullish pennant pattern following prolonged consolidation signals continuation of the prevailing uptrend. Traders should watch for sustained price action above $103K for confirmation. A pullback or retest toward this level can present re-entry opportunities before a potential move toward $107K. Tight risk management is advised with stops below $93K.

Sklz bull pendant!?5.60 by weds could be Monday if proper momentum
Let's go paradise and skillz holdinglong been here since 2020 and I. Not FKN leaving sklz to moon weekly chart Goals 156usd per share
Where my longs at! Not financial advice

XAUUSD Technical Analysis: Bullish and Bearish ScenariosGold (XAUUSD) has exhibited a strong bullish impulse, breaking out of established channel structures. Following a sharp ascent, the price action has entered a consolidation phase near recent highs. This analysis explores potential scenarios based on technical patterns, key levels, and underlying market psychology.
Chart Analysis and Market Psychology
The chart displays a distinct uptrend characterized by ascending channels. Recently, XAUUSD experienced a significant upward thrust, breaking decisively above the shorter-term orange channel. This move reached the projected target derived from this channel's height, near the 3405 level.
Following this peak, price action has formed a tighter consolidation range. This pattern, occurring after a sharp rally and on potentially decreasing volume (as is common in such formations), resembles a bullish continuation pattern, such as a pennant or flag. From a market psychology perspective, this suggests a temporary equilibrium:
Buying Pressure: Bulls who drove the initial breakout may be pausing, absorbing profits taken by earlier entrants, or accumulating new positions in anticipation of further upside. The sharp nature of the preceding rally indicates strong underlying demand and potentially FOMO (Fear Of Missing Out) among participants.
Selling Pressure: Sellers are attempting to cap the rally, potentially taking profits or initiating short positions. However, the observation that dips below 3259 were quickly bought suggests that selling pressure has been relatively weak compared to the buying interest defending this level. This rejection indicates that market participants still perceive value at or above this zone, viewing it as a potential support level following the breakout.
The key level currently in focus appears to be around 3259. The price interaction with this level could be crucial in determining the next directional move.
Bullish Scenario
Conditions: For a bullish continuation, the price would ideally need to hold above the 3259 support level. A decisive breakout above the upper boundary of the current consolidation pattern would serve as confirmation.
Psychology: This outcome would suggest that the consolidation phase was indeed accumulative, with buyers absorbing selling pressure and preparing for the next leg higher. It would reinforce the "impatient bulls" and "weak bears" narrative.
Potential Targets:
A retest of the recent highs near 3405.
The target derived from the breakout of the medium-term turquoise channel, located near 3640.
Given the aggressive nature of the preceding rally, an overshoot towards the higher projection at 3839 might become a possibility if bullish momentum remains exceptionally strong after breaking 3640.
Bearish Scenario
Conditions: A failure to hold the 3259 level, coupled with a break below the lower boundary of the consolidation pattern, could signal a potential reversal or a deeper pullback. This might involve price re-entering the previously broken orange channel.
Psychology: This scenario would suggest that the buying pressure was insufficient to sustain the breakout, potentially indicating a "bull trap" or simply a more significant profit-taking wave overwhelming demand at current levels.
Potential Support Zones:
The upper trendline of the orange channel (acting as support after being resistance).
The primary uptrend line (lower boundary) of the orange channel.
The channel line (upper boundary) of the broader turquoise channel, which could coincide with the orange channel's lower boundary, potentially forming a confluence of support.
Concluding Remarks
XAUUSD is at a potential juncture following a strong bullish breakout. The current consolidation pattern holds the key to the next immediate move. Holding above 3259 and breaking the consolidation high could pave the way for further upside towards targets at 3640 and potentially 3839. Conversely, a failure to maintain support at 3259 might trigger a pullback towards the support levels defined by the underlying channel structures. Traders often watch volume closely during the resolution of such patterns for confirmation.
Disclaimer: This report is for informational and educational purposes only and does not constitute financial advice or a recommendation to buy or sell any asset. Trading involves risk, and decisions should be based on your own research and risk tolerance.

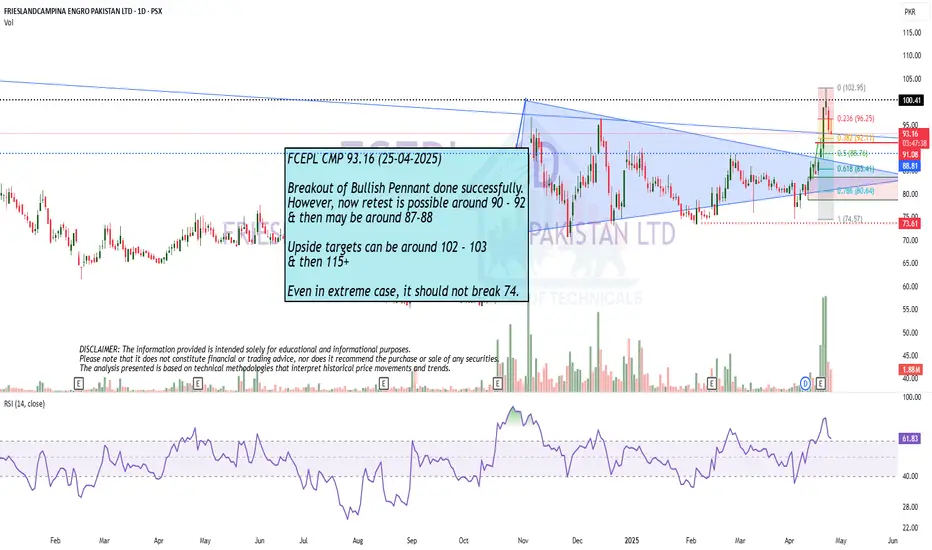
Breakout of Bullish Pennant done successfully.
Breakout of Bullish Pennant done successfully.
However, now retest is possible around 90 - 92
& then may be around 87-88
Upside targets can be around 102 - 103
& then 115+
Even in extreme case, it should not break 74.
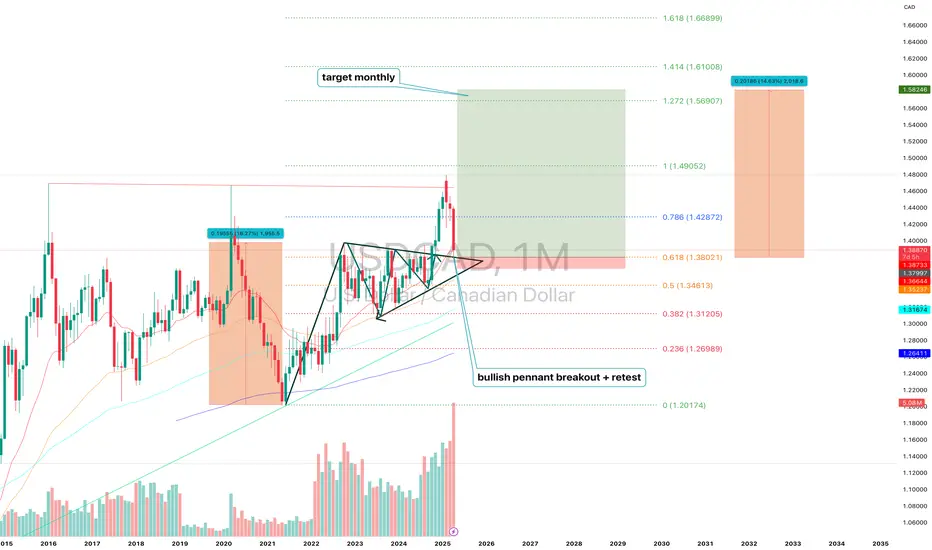
USDCAD (1M) Bullish Pennant Structure and H ProjectionUSDCAD (1M) — Technical and Fundamental Analysis: Bullish Pennant Structure and H Projection
On the monthly chart of USDCAD, a bullish pennant structure has been formed and confirmed with a breakout followed by a clean retest of the upper boundary. The price broke out of the consolidation zone with momentum and is currently holding above the key support at 1.3802. The structure remains active: the first target based on the projected move is 1.4905. If the impulse continues and the market structure remains intact, extended targets lie at 1.5690 (1.272), 1.6100 (1.414), and 1.6689 (1.618) Fibonacci expansions. Technically, the 1.3802 level (0.618 retracement) is the critical support. If this zone holds, the bullish scenario remains valid. The nearest resistance is 1.4287 (0.786), and a confirmed break above this level would likely trigger the next phase toward 1.49. Volume increased during the breakout, confirming strong buyer interest.
Fundamentally, the setup is supported by diverging monetary policies: the Bank of Canada has signaled a more dovish stance due to slowing inflation and economic softness, while the Federal Reserve remains more neutral and cautious about rate cuts. In addition, oil prices — a key factor for the Canadian dollar — are under pressure, weakening the CAD further. Broader macro uncertainty and the global demand for USD as a reserve and safe-haven asset continue to support the dollar, strengthening the USDCAD pair.
Conclusion: As long as the price holds above the 1.38 zone and confirms above 1.4287, the bullish structure remains in play with a target of 1.4905 and potential extensions to 1.5690–1.6100.
Bullish Pennant Confirms Breakout: Momentum Builds Toward 1.19The pair has formed a textbook bullish pennant on the 4-hour timeframe following a sharp impulsive move upward. Price action consolidated within a narrowing triangle, signaling accumulation before the next leg higher.
The breakout above the pennant’s resistance suggests continuation of the uptrend, with projected Fibonacci targets at:
1.1781 (1.272 extension)
1.1940 (1.414 extension)
Volume behavior confirms the pattern: declining during the consolidation phase and increasing at the breakout, supporting a strong bullish bias.
Fundamental backdrop:
-The US Dollar faces pressure as markets increasingly price in a potential Fed rate cut in the second half of 2025.
-The ECB maintains a more hawkish stance, reinforcing euro strength relative to USD.
-Eurozone economic data shows signs of inflation stabilization, while US CPI readings remain mixed.
-Capital rotation favors major currencies with resilient monetary policies and macroeconomic stability.
As long as EUR/USD holds above 1.1476, the bullish scenario remains intact. A move toward 1.1781 and 1.1940 appears likely. A breakdown below 1.1237 would invalidate the pennant and shift momentum toward support retests.
