💥CARDANO BUY SETUP - TO LONG TO $1.80We have three (3) main setup here and a very good buy confirmation on this chart to go long to $1.80.
First, we have an uptrend (trend continuation). We also have a bullish pennant breakout and price in a ranging zone testing the demand zone back to the supply zone.
The trendline breakout confirms this three (3) setups for price to go long to $1.80.
What do you think?
Share your opinion in the comment section✍️
Please support this idea with a LIKE👍 if you find it useful🥳
Follow me to receive more updates on this pair🤙
Comment any coin you need my analysis or forecast on📈📉
Happy Trading💰🥳🤗
Thank you for your support!💓
Bullish Pennant

💥DOGEUSD LIKELY MOVE - PUMP TO $0.56 OR DIP TO $0.25Based on what we can see on the chart, we have a bullish pennant chart pattern in view. We also have price tested 3 credible support trendines and 2 resistance trendines.
Right now, we need a either a rejection on the trendline or a breakout to know the next move.
If price is unable to break the support trendline downward, we ride back to $0.56. But if price breaks this trendline downward, price will dip to $0.25.
Let's wait and see what happens.
What do you think?
Share your opinion in the comment section✍️
Please support this idea with a LIKE👍 if you find it useful🥳
Follow me to receive more updates on this pair🤙
Comment any coin you need my analysis or forecast on📈📉
Happy Trading💰🥳🤗
Thank you for your support!💓

💥 BITCOIN LIKELY MOVE- TO PUMP TO $40K, $42K AND $43KWith respect to my previous post on BTCUSD, price broke it earlier than expected. We had a breakout from $37,000 yesterday and a pull back followed.
Right now, I expect a bullish movement to $40,000, $42,000 and $43,000.
What do you think?
Share your opinion in the comment section✍️
Please support this idea with a LIKE👍 if you find it useful🥳
Follow me to receive more updates on this pair🤙
Happy Trading💰🥳🤗
Trading Involves High Risk⚠️
Not Financial Advice💸
Use Proper Risk Management💹
Thank you for your support!💓

PIDILITIND - Bull Pennant breakout - Swing TradeThe above analysis is done purely on basis of Price Action & Chart Patterns.
The analysis is done on daily TF hence price may take few days to few weeks in order to reach the targets.
Trade setup is explained in image itself. Entry can be either above the breakout candle or on small pullbacks as well.
The above analysis is purely for educational purpose. Traders must do their own study before entering into any trade. Traders must trade as per their own risk taking capacity and money management.
Feel Free to comment or message me for any query or suggestion regarding this stock or Price Action Analysis.
Checkout my other ideas to understand how one can earn from stock markets with simple trade setups.

💥HISTORY TO REPEAT ITSELF, BTC TO RISE AGAIN 20th-22nd JUNEAs we can all see on this chart, this is replica of what happened early this year (January, 2021).
On 8th January, price found itself in a tight triangular zone and eventually left the zone 21 days after with a breakout and a retest which led us to $57,500.
History repeated itself again and price got into the same tight triangular zone on 19th May 2021 and it's still dwelling within the zone.
Therefore, I expect an upward breakout from the triangle and a pull back to confirm a good buy to $57,500 just as I happened on 29th January.
Therefore I expect Bitcoin to regain it's full rising strength within 20th-22nd June.
This idea is invalid if price breaks the support zone within $28,800-$30,000 downward to $26,000.
What do you think?
Share your opinion in the comment section✍️
Please support this idea with a LIKE👍 if you find it useful🥳
Follow me to receive more updates on this pair🤙
Happy Trading💰🥳🤗
Trading Involves High Risk⚠️
Not Financial Advice💸
Use Proper Risk Management💹
Thank you for your support!💓
NB: If you would like to have one-on-one interaction with me about analysis of coins or currency, DM me.

💥TWTUSD BUY OPPORTUNITY - TO PUMP TO $0.4 $0.5 & $0.6Trust wallet token is in a downtrend as seen on this chart. Also, we have a descending triangle too on the chart.
Price has tested the support trendline the third time and didn't break it. Therefore I expect a bullish movement to $0.4 first. If Price break the trendline, then $0.5 and $0.6.
What do you think?
Share your opinion in the comment section✍️
Please support this idea with a LIKE👍 if you find it useful🥳
Follow me to receive more updates on this pair🤙
Happy Trading💰🥳🤗
Trading Involves High Risk⚠️
Not Financial Advice💸
Use Proper Risk Management💹
Thank you for your support!💓


a symmetrical bull pennant inside an inv h&s on the 4hr chartnot saying it's definitely going to pan out..but something to keep an eye on all the same. I'll be waiting on a confirmed breakout or fakeout.

CADJPY Bullish pennant pattern As you can see cadjpy expected to break the bullish pennant pattern and go up to the upper ressistanse

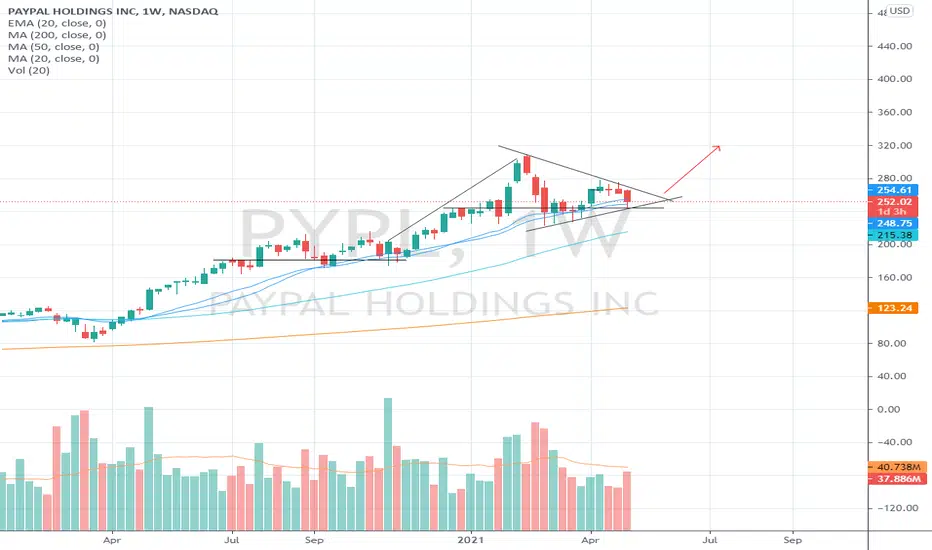
Bullish on PYPL (Long-Term)I am #bullish on $PYPL stock for the technical reasons indicated on the chart.
Digital currencies and wallets will be here to stay. #Opinion

IMPORTANT MOMENT FOR CARDANOGood evening traders, today I am going to say what I personally think of Cardano when it comes to the short term (after this crash). Cardano is recovering nicely and I think that if it holds that crucial 1.5 support line it has great potential to keep moving forward and hit that 2$ level again.
Right now it's a lot of volatility in the market and it's tricky to say something when everything is so back and forth with the prices. Most of this is also in the hands of Bitcoin, if BTC continues further down this is not possible. We are still in a good level on the FIB extension but still on the lower part on the 100% level.
I still remain bullish on ADA and I think no expert think that this is the bottom of the bull market and Cardano still has a lot of work do. If we look on the EMA's on the 24h time frame we can see that it is no longer pointing upwards and that usually means ADA is going to consolidate before a potential upside.
On the 1 hour time frame we can see a bull pennant forming and hopefully racing towards 2+ dollars. Even though that sounds great we still have to expect a downside and everything from 1,3-1$ can be an option.
Cardano is looking strong and if it holds support nicely we can see the upside once again but this time even further!
One last reminder; Don't worry about today's noise!
Enjoyed the analysis? Like! Want to see more? Follow!
Let me know what you guys think! Let me know in the comments!
REMEMBER TO ALWAYS TRADE AT YOUR OWN RISK AND I AM NO FINANCIAL ADVISOR.

Crunch Time For FET/BTC #FET $FET #FetchAIIt will soon be Crunch Time for our FET chart ! As you can see - after our big rise - we've been in this triangle for a couple months - consolidating but being supported by our higher timeframe Ichimoku clouds also (3 day and weekly . ) It seems by June 5th we will reach the apex of this triangle and at that point we must pick a direction. Now with Bitcoin's recent dump down to 30k that has caused a dump from our recent attempt to break upward out of this structure and continue up to 1550 area . So our chart is left looking a little funky ! But since there are other indicators such as Ichimoku and also the general trend upward during a Bullrun year I would still expect this triangle to break upward within a couple weeks . I'm prepared for Crypto to throw me some curveballs though ! As we've seen recently even a tweet from my guy Elon Musk can send a coin pumping - or not ! But you have got to remember - it's a Bullrun year ! This is not a normal year . Any coin coming from the bottom should start to hit it's fib retracement targets at some point . And we've yet to reach our first fib target near 3420 , which is our .236 fib . I firmly expect us to get there . And above ! Question is what structure we take to get there after this triangle plays out . I'll link my fib targets for FET in the linked chart below . Also as a side note - you may notice I was calling this a Bull pennant before and I'm now calling it a triangle ...well, you've got to be flexible in crypto because sometimes chart patterns change ! And if something is taking a longer time to form it's actually possible it's a symmetrical triangle type structure as opposed to a pennant ( since a pennant generally doesn't take as long to play out . ) So be prepared to change your view if things play out differently ! But I'm still bullish and I still expect upside here . Let's see what the next 2 weeks bring .
Sidenote - some people are calling for Bitcoin to dump to 20k but that is not guaranteed to happen so take it with a grain of salt.

Bull Pennant Confirmed FET/BTC #FET $FET #FetchAIHere we see our FET daily chart and you can see what clearly looks to be a Bull Pennant forming . It looks like FET will break upward from this pennant by the end of May . First target area would obviously be the 1550 resistance that we've already hit a couple times . The only question is can we break above that area and close above 1550 . It could take time . But when we do that we will be extremely bullish ! And almost certainly we'll see our 3200/3420 area sometime after that . I'll link my FET targets chart below that shows the targets above us . You can clearly see our April break down to 700 area and our recent break down to low 800s area have clearly formed the bottom edge of our Bull Pennant . This pattern is a Bullish pattern - it's very good for us ! Target is our 1550 resistance area where that green X is on the chart .

Bull Pennant ATH contuationA big break out of a pennant on the 15min time frame to new all time highs after a back test of a previous upper trend line which provided a big bounce on the retest. Looking strong

TATAMOTORS - Bull Pennant Breakout - Weekly - Swing TradeThe above analysis is done purely based on Price action and Popular chart analysis.
The analysis is done on weekly time frame and hence it may take price a couple of weeks to few months to reach the target.
Analysis and trade setup has been shared in the image itself.
Don't run after the price, and always trade based on your study.
Maintain proper risk management.
Also check out my other ideas to know how even a beginner can earn money from stock market with help of simple price action.
Feel free to comment or message me regarding this analysis or to know more about chart study and learning price action.

As a $BABA perma bull here is what I seeLooks to be a bull pennant forming on a monthly scale. Obviously US china relations are the real problem and the possible 'delisting'. When it comes down to it $BABA has earnings next week. It could EASILY pump into the pitchfork. Assuming its not hampered by the government This is a long term growth and expect a massive elliott wave over the course of the next year.

PYPL looks strongPYPL just delivered great earnings and estimations, including their cripto play, are good.
Looks strong fundamentally and technically
Just bounced from the strong level
I expecting breakout from the pennant
Target 300+
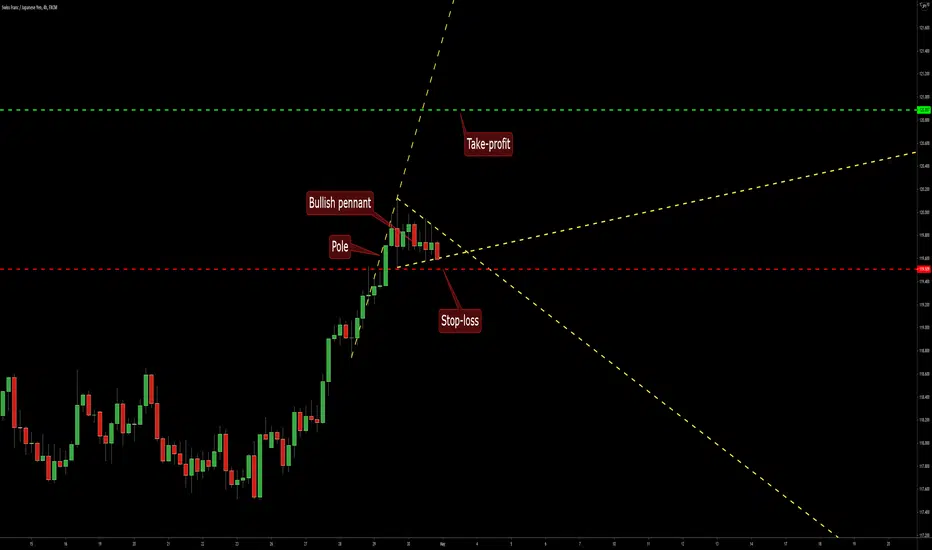
Bullish Pennant on CHF/JPY @ H4This chart shows a bullish pennant on the 4-hour chart of CHF/JPY. It offers a bullish breakout opportunity for trading. The pennant and its pole are shown with the yellow lines. My potential take-profit level is marked with the green line. My potential stop-loss level is marked with the red line. I will wait for the price to close significantly above the upper border of the pennant area to execute a buy trade here.
XRP/USDT Technical AnalysisHey guys, Top here.
This is a re-post of my idea because the last one got hidden. I believe I posted it in the spanish section by mistake.
I believe that the price action will remain in the pennant until squeezed. When squeezed I believe the price will move up to the next resistance level (1.71ish).
If not it'll fall through the support and retest the 200EMA for a bounce. Make sure to get in at 1.52-1.54.

this looks goodOK, for starting I've to say that if BTC keeps going down this pattern will be easily invalidated, current crypto situation is pretty unclear but with a bearish tendency so... set a stop loss!!!
However BNB is gradually splitting from BTC, so it tends to be less affected. Off course it's not immune from BTC dumps but I think that in the future it will take over ETH and will rival with BTC. If this happens it will be a good for cryptomarket, we need more "big" coins in order to stabilize the market and depowering BTC.
About the TA: looks like a bullish pennant is forming on BNB, use yellow dashed line as support and calibrate the stop loss accordingly. I think there isn't much to say about this pattern, it speaks for itself.
Good luck!

$RIOT Target PTs 61-65-79 and higherBullish Pennant, continuation patterns
Riot Blockchain, Inc., together with its subsidiaries, focuses on cryptocurrency mining operation in North America. The company primarily focuses on bitcoin mining. As of December 31, 2020, it operated a fleet of 7,043 miners. The company was formerly known as Bioptix, Inc. and changed its name to Riot Blockchain, Inc. in October 2017. Riot Blockchain, Inc. was incorporated in 2000 and is based in Castle Rock, Colorado.

Ready for moonshot?Looks like it's following pattern of previous wave. Is it a bullish pennant or ascending triangle??
Target: 0.62 - 0.65, but first psychological target 0.50
What are your thoughts?

perfect entry pointSo, although indicators are not very promising on this, you can see as ALPHA bounced on 0.618 and now it's heading up. The chart pattern is a bullish one during a bull market = it's matter of time before it pumps.
If daily candlestick close as a hanging man I expect price to test again 0.5 and pennant's bottom but eventually it'd go up.
If you have not much time to stare at the chart right now just buy in and wait settling a stop loss calibrated on my risk/reward scheme. Another possibility is to set a buy order between current price and support. If instead you can spend time in front of the monitor just wait and try to catch the bottom, I think it'll be a small retracement anyway, less than 5% if I had to bet.
If I had fiat I'd enter this... unfortunately I've all invested right now
