SNX Bullish Pennant BreakoutSNX cryptocurrency price made breakout of the bullish pennant good buy here
Buy : below 17$
Stop : 14.8
Target : 19 , 21 , 25
Bullish Pennant

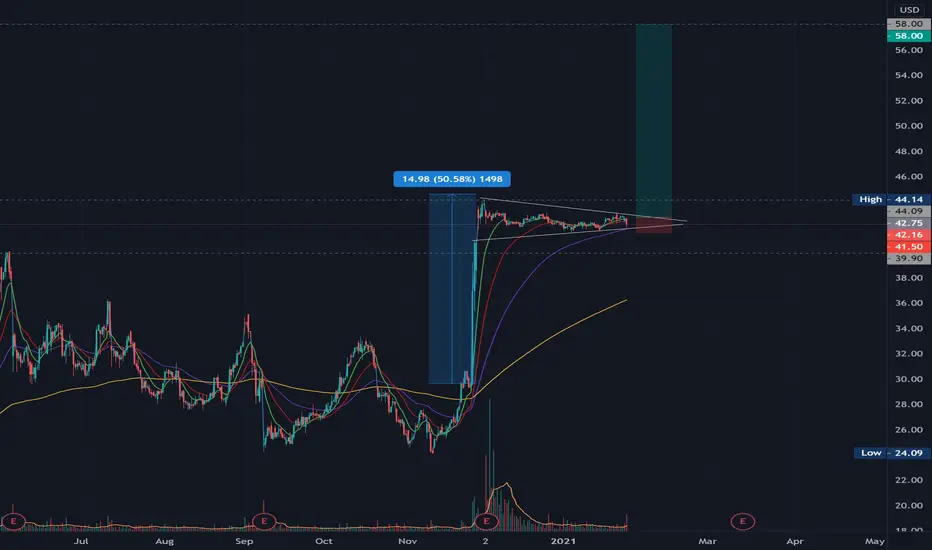
Slack Technologies, ticker WORK, is in a Bull PennantWORK is ranging. If we breakout above the pennant, my target is 58$. Probably going to go with a call debit spread instead of buying shares, 1-2 months out.

AUDUSD FORMING BULLISH PENNANT ON DAILY TIMEFRAMEWe can see price forming a bullish pennant on daily chart we might see more bullish move after breakout target have been marked. Make sure to check what's going in short time frame during the breakout to get clear picture.
please do let me know your views on this analysis

SHARDACROP - Multiple Patterns breakout - Swing TradeThe above analysis is done purely based on price action and chart patterns.
The analysis is done on daily TF hence price may take few days to few weeks in order to reach the targets
Logic as well as the trade setup is shown in image itself.
Entry can be made between the range of 285-295. SL and Targets are shown in image itself.
The above analysis is purely for educational purpose. Traders must do their own study before entering into any trade. Traders must trade as per their own risk taking capacity and money management.
Feel Free to comment for any queries regarding the above stock or price action analysis in general.
Also check out my other ideas to understand how price action works and how it can be used to make regular profits without any complex strategies.

TATAMOTORS Bullish Pennant.NSE:TATAMOTORS
Watchout it will be fire breaking upside, can go till 20-22-25 Points from CMP


$tsla - bullish pennant, pitchfork confirmation for a move updoesn't take a genius to know they were holding this down pre-earnings.
i don't use pitchforks much, but the pitchfork was confirm last week & the length of the flagpole on the pennant aligns perfectly with the top of the pitchfork line.
4 hour chart bullish indicators:
- consolidation within the bullish pennant
- hidden bullish divergence
- bounced perfectly off 50ma last week
- macd buy signal incoming
other bullish indicators:
- over 885, clear skies.. 1K+ can be easily seen
- declining volume, higher high on daily
- bullish harami candle on weekly
at the end of the the day this could all go downhill if earnings go bad.
good luck!

Bitcoin Shaking Out Weak HandsI will be watching BTC/USD this week to see if it continues the volatility contraction or if it decides to break out of the Bull pennant.
Bull Pennant – Bull Pennant Pattern
The bull pennant pattern is found within an uptrend in a stock. This pattern is named for the resemblance of a pennant on a pole. The bull pennant is a continuation pattern with narrowing price action following a strong advance. The technical buy point is when price penetrates the upper trend line of the pennant area, ideally on volume expansion.
This is what I will be watching... A break below would be a bearish sign and we might see more downside in that case.
This is not investment advice.

$MANA Gann Fan Strategy + Fibo RetracementUsing both Gann Fan and Fibo strategy, you can maximize your upside by knowing when and where to do your entry in this coin.

ChfJpy Possible Bullish Pennant Sellers this is an opportunity to ride the flag pattern down.
If trade goes according to idea chfjpy would finally break that major resistance at around 118.000 and continue going upwards.
Great swing trade idea.
Any disagreements, leave a comment below.

PLTR - Perfect bullish pennant breakoutPLTR formed a perfect bullish pennant breakout last friday price close! More upside possible, watch price action closely on previous ATH.
Not financial advice.

WanChain Bullish Pennant BreakoutWanchain price in bullish pennant
Buy : 1220 - 1230 sats
Stop : 1130 sats
Target : 1270 , 1300 , 1370 , 1500

Bull Pennant on COTY: BREAKOUT= MAJOR UPSIDEA Bull pennant has formed on COTY and looks like it will attempt a breakout soon... If breakout is confirmed I expect to see some major upside to the $12+ level... I will watch price action as it approaches bottom support line and if it reacts as I anticipate I will strongly consider buying mid-February expiration call options

Polkadot Price in Bullish PennantDot price is moving in bullish pennant breakout above 18$
Buy above 18$ with good volume breakout

NANO/USD Bull PennantBull Pennant has formed on NANO... Following a bounce off the bottom of the pennant I am anticipating a run up back to the top resistance line and another attempt at a breakout...If a breakout does occur there will be some really nice quick upside to $5+... If a breakout is rejected it will be very important to watch price action closely as a break through of the bottom support line could bring some major downside to the $1.00-$1.50 level

FSLY Attempting BreakoutWatch price action on FSLY for confirmation of breakout... If breakout is confirmed we can expect some quick upside to $130+

Bitcoin Bull Pennant? Can we see 40k and say bye bye to low 30s?Just strictly educational, can this be a dip that may be the one we need for a huge pop to the high side?
I have actively traded bitcoin in the summer in the 4-10k range and wish i kept way more from that point now got put around 10k into bitcoin around 18,6-7.
I am absolutely LONG on bitcoin, have stop loss set it 28,500 for half of what I have just incase it does want to get run down to the teens again (which I wouldn't mind, it would be a blessing.
Lets go Bitcoin!

$BBBY Bullish Pennant!Get Ready for a Break out! It is coming! Get those calls and buys in!
Strap on and hold on!

USDJPY long setupOn the weekly timeframe market has rejected weekly support with a bullish engulfing candle. On the daily market has broke above daily resistance with a bullish impulse, followed by a correction to retest the previous resistance now turned support and has rejected the new support a number of times. also forming a nice inverted head and shoulders from a daily perspective.... On the 4hr TF market is consolidating in this bullish pennant pattern (on the right shoulder) we are waiting to see if market will break above the mid support line of the pennant, then if all of our entry rules are met we will be taking a nice long. TP will be the 0.272 of the fibonacci taken on the daily retracement.

$ZEC/USDT 3h (Binance Futures) Symmetrical triangle breakoutZcash has broken out of that symmetrical triangle which looks like a bullish pennant.
Current Price= 111.00
Buy Entry= 110.21 - 107.97
Take Profit= 114.58 | 120.69 | 128.97
Stop Loss= 103.60
Risk/Reward= 1:1 | 1:2.11 | 1:3.62
Expected Profit= +10.03% | +21.26% | +36.44%
Possible Loss= -10.03%
Fib. Retracement= 0.786 | 1 | 1.272
Margin Leverage= 2x
Estimated Gain-time= 120h


Dot Price in Bullish PennantPolkadot price is moving in the Bullish pennant breakout above 18$
Price can touch 20$ easily when price make the breakout of the Pennant
