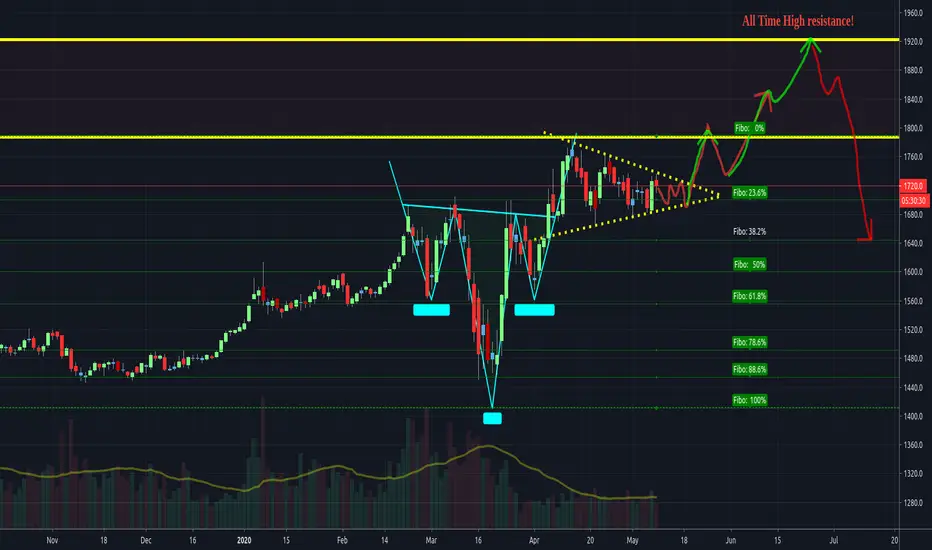
SYMETRICAL + ASCENDING = CONTINUATION ?
JUST ANOTHER SHORT TERM BULLISH IDEA...
SYMETRICAL TRIANGLE+ ASCENDING TRIANGLE = CONTINUATION PATTERN ?
WE WILL SEE... ;-)
thank you so much your comments!!
This one also coming from this idea:
Love and good luck!
Bullish Pennant

Bullish Pennant XAUUSD confirmed, 1800 coming soonI believe most of traders already anticipated this patter. So do i prior to my last analysis this might be the start of gold bullish movement to retest the 1800 level. For swing trade, i'll take long because of this pennant breakout until it reach 1800 and we'll see what will happen next.

Xau/UsdShall see if volatility picks up and to what side in the coming hours. Am overall bullish on gold as always. Let me know what you see.

$GC_F -- Bullish continuation on inverseI believe that $GC_F has one more big move up where it will test the previous ATH level. It still has alot of strength after breaking out of its inverse h&s pattern. Now its forming a bullish pennant where I believe it will breakout of the pennant to reject the current highs, retest the pennant top line or somewhere around there then breakout to previous ATH levels where it will then dump hard. Really hard/impossible to predict it 100% accurately but this is what i think will happen. thanks for reading.
initial 9400 target met with exact precision 10547 next targetThe initial target of 9400 from my last idea has been met...the next target I had in mind was for the bull pennant breakout at 10547. The breakout seems to be confirming here.

btcusd appears to be breaking up from 1hr inv head & shouldersif it confirms the initial target is 9374...which coudl be enough to trigger a breakout from the entire 1 day chart bull pennant which would then have a breakout target of 10.5k No full confirmation yet but probability is definitely favoring the breakout of at least the 1hr chart pattern

AMD Bull PennantAMD is in a bull pennant as you can see from the 1hr chart. If it breaks below the prior pivot, then this could form into a bull flag with a lower low.

Is Tinley trading in a Bullish Flag?Possibly a descending triangle as well, but with the Long Beach facility license imminent I'm strongly leaning towards a bullish outcome.
The RSI looks like it recently made a Triple Bottom.
Only time will tell.

#Bitcoin - Bull Pennant
I am currently long from 7550 as i posted in this idea,
i just noticed we are also forming a Bull Pennant on HTF, if this breaks out on the upside then targets are in 8ks

YUM Brands Update - Bullish PennantPennant Pattern - Continuation Pattern.
The brand owns: KFC, Pizza Hut, Taco Bell, The Habit Burger Grill and Wing Street worldwide.
Long Term Analysis (Go long Option 2) - It is a Bullish Market and it was a bullish Market just before the COVID-19. YUM BRANDS adjusted it assets to accommodate the new market requests. Wait the right time to go Long, perhaps once the level 83.50 is achieved, we can think to go long
Short Term Investment - Go short (Option 1) up to 83.50

YUM BRANDS (PIZZA HUT, KFC)Yum! Brands
The brand owns: KFC, Pizza Hut, Taco Bell, The Habit Burger Grill and Wing Street worldwide.
Long term analysis - Market was bullish before the Virus and it changes quickly to accommodate the virus/crisis requests, so it should keep going upward - Bullish long term
Short Term I would go Bullish - same direction of the trend, but there is an Option B where the price can jump back to 84.00
Technical Analysis pattern - it seems to be a bullish pennant/flag (rectangular) pattern (more flag less rectangular).


ETH-BTC short term bullish on 15 min chartMultiple bull flags on 15 min chart. Ichimoku still showing possible upside.
Good short term trade.

A potential fallingwedge/bullishpennant appearsHave yet to see any legitimate volume surge on the last long red candle we just closed on the 1 day chart which suggests we have not broken out of whatever consolidation pattern we have been in yet...the bounce of the current 1 day candle currently creates the opportunity for this falling wedge shown here in blue...as well as a bullish pennant with the falling wedge as the pennant...the head and shoulder breakdown is still very much a possibility here but with the current 1 day candles bounce off this trendline this falling wedge is now in play as well. So for now I remain neutral until I see a decisive break below this newly formed wedge possibility.

V scalps to 177.04Visa is an uptrend
Bullish pennant on the 15M chart
Bullish candlestick pattern on 15M chart with last candlestick closing above the 8MA.
Bullish engulfing on the 5M chart
MACD crossed UP on the 5M
For all these reasons i plan to scalp Visa on the bullish pennant BREAKOUT with volume!!
LETS SEE WHAT TMW BRINGS!
Please feel free to leave insight, it is always welcomed!

BULLS REMAIN IN CONTROL (READ DESCRIPTION)The bears had their time over the last couple days with no significant drop . Gold bounced from some strong support levels, indicating the bulls are still in control.
Price is currently in a consolidation zone between 1580-1640 and may stay within this range for some time before a breakout occurs. It will test the 1640 level next and if it breaks past, we could see a run to test 1700 again.
Outlined are two bullish pennant patterns.
Key support outlined with solid blue lines, key resistance in solid red lines.
Overall, looking like the bulls have maintained control, also due to strong underlying fundamentals.
What are your thoughts? Make sure to follow for more!

Symmetrical triangle broke upward like anticipatedmust keep an eye on the first smaller breakout target in case this may turn into a double top in that zone...fi it keeps going then the higher breakout target then becomes very probable where at that point the resistance to keep in mind will be the 1 day 50ma(not shown here on the 3hr chart)

USDCNH 3/30/20 BUYVERY SLOW MOVING PAIR Low RISK .... OVERLEVERAGED
Price is closing and entered on a big support area
Pice formed a bullish penant got out for 20 pips last week before market closed due to swap fees for holding over the weekend would like to see it push all the way up to the top of the start of the penant

3hr chart symmetrical triangle now the dominant pattern.After some peculiar price action it now seems the most valid timeframe for a symmetrical triangle here is the 3hr chart. It is always a bit of a risk looking for a pattern on a 1hr chart so having to move to the 3hr chart to find a symmetrical triangle that was still looking valid doesn't surprise me.; In general I usually stick to the 1 day and 1 week charts but went with the 1 hr chart this time around because there were so many valid touches from the candlesticks....ultimately even if this 3hr symmetrical triangle starts looking wonky, we we likely maintain the 1 day basic bullflag it isnt until the 1day chart bullflag gets invalidated that we need to worry about bearish confirmation.


perfect .618 fib bounce breakout from bullpennantPhi once again proves why it is the msot revered ratio in all of sacred geometry as the bull pennant broke out of its falling wedge flag at the precise .618 fibonacci retracement level! Phi truly is the golden ration...target is the 6878 horizontal-7k or so.

potential super long bull pennant on xrpeth?At least on the bittrex exchange we saw a ridiculously long bull wick recently on xrpeth...Afterwards we formed an equilateral triangle and both its bottom and top trendlines were drawn better by wicks than candle bodies...thus meaning we should measure the pole of the symmetrical bull pennant by the wicks as well...If this is indeed the case and we measure the pole by the wick, then that gives this bull pennant some tremendously bullish upside that could easily lead to a sustained golden cross on the xrpeth chart which no doubt if it hit that target would allow xrp to easily reclaim the number 2 spot from ethereum. I assume the wick isnt as big on other exchanges though so if thats the case this may not be a valid emtric to rmeasure the breakout target on but either way looking at the volume that came ion as we broke above the top trendline of the symmetrical triangle..it should be enough of a bullish breakout target to lead us to a potential golden cross even if we cant measure it by the poles massive bullwickm. If the golden cross is sustained I amy have to flip my eth holdings to xrp at least temporarily.

Bullish Engulfing Candle Close on the 1day Chartalways a bullish sign..we also closed with volume above the 4hr chart falling wedge and the 1 day bull flag.
