GBPCAD BULLISH & BEARISH IDEASMonthly Confluence is telling me are indeed in a Bullish Market. We have a Bullish Pennant located right at the 61.8% Retracement which institutions do on purpose right at market closure so participants can pretty much gamble their money with either going long or short. For me to enter Long i'd like to price to show me an indefinite buyer market breaking above local resistance, if price comes back down hitting the red line, that means the trade is invalidated (No good). If price does continue lower and hits the green line, its a safe understanding that price did in fact reject of the 61.8 retracement and we are in a Bearish Continuation Market.
Bullish Pennant

Tick Tock, Boom!That 200 Day MA is really playing as the floor for a descending triangle on the low... I wouldn't be surprised if a market mover come into the market in the very near term to force BTC back into a bear market..
There was clearly a bull flag that's been negated a little, and now turned into a bullish pennant formation.. We'll see I guess, but I think there's a hidden descending triangle here with the 200 Day MA as the floor, it will start to move up & become more apparent after a few more days of trading, potentially imo..
The rsi is showing higher lows & higher highs on a micro level, so don't be surprised to see a measured move similar to the massive move on Otc 25th & 26th in either direction to change the trend bearish or keep momentum bullish.
Time will tell per usual.


double bottom in play if symmetrical triangle doesn't pan outthe symmetrical triangle/ bull pennant appears to be losing some steam here but if it doesn't pan out the bulls still have another chance to continue the uptrend with a double bottom in play around 8886(as shown here in purple). A retest of this zone would make a lot of sense since there is currently a gap on the CME futures chart around that zone that needs to be filled...and if price action were to retest this zone soon enough and indeed get strong bounce support there we could trigger the double bottom while still validating both the symmetrical bull pennant and the 1 day chart bull flag (in green) at the same time. We can see a nice bullish confluence here between the breakout targets of both the double bottom & the symmetrical triangle (pennant not factored in) so hopefully that increases the probability for a bullish validation.

validating the bullpennant here would give a 1day higher high!we need to break above 12.3k to confirm a higher high and ensure the bull market continues...if this is a symmetrical bull pennant we are in the breakout target is 12449! Just enough for a higher high!

cup & handle pattern has morphed into a symmetrical triangle.Cup and handle's handle has gone on for too long now morphing from a c&h shape into a symmetrical triangle which is a better sign for the bulls because as pretty reliable continuation patterns, it's very probable that this will be breaking to the upside. The measured move from just the triangle itself would be 11k but it could also act as a bullish pennant here that would take us much higher than that....ultimately if we can reach above 12.3k and achieve a higher higher on this current upswing before the next downtrend that will ensure we do indeed stay in the bull market and be a great sign for the potential for the price to continue astronomically higher and for the deathcross to be flipped back into a goldencross. Let's hope it breaks upward.

USDJPY LONGAn Inverse Head & Shoulders has been formed on the Daily. Price has also made a bullish pennant, suggesting price to continue bullish.
We can expect price to go short to the zone before going bullish.

USDJPY DUAL PLANS TO TRADEBullish pennant breakout pushes USD/JPY to an upside.
Keep your eyes peeled for clues that the bulls still have muscle in their hustle to boost the dollar to the 108.958– 109.871 previous area of interest.
Not convinced that an upside move is in the works? You can also short USD/JPY at the earliest signs of bearish momentum using our Plan no. 2 if plan no. 1 fails.

BTCUSD breaking up from falling wedge/bull pennant target= 8.6k Awesome t see price action rebound exactly on my stochrsi horizontal trendline. the 1 day 200ma is floating somewhere around the 8.6 k level and I do anticipate it will provide resistance at least upon the initial retest .

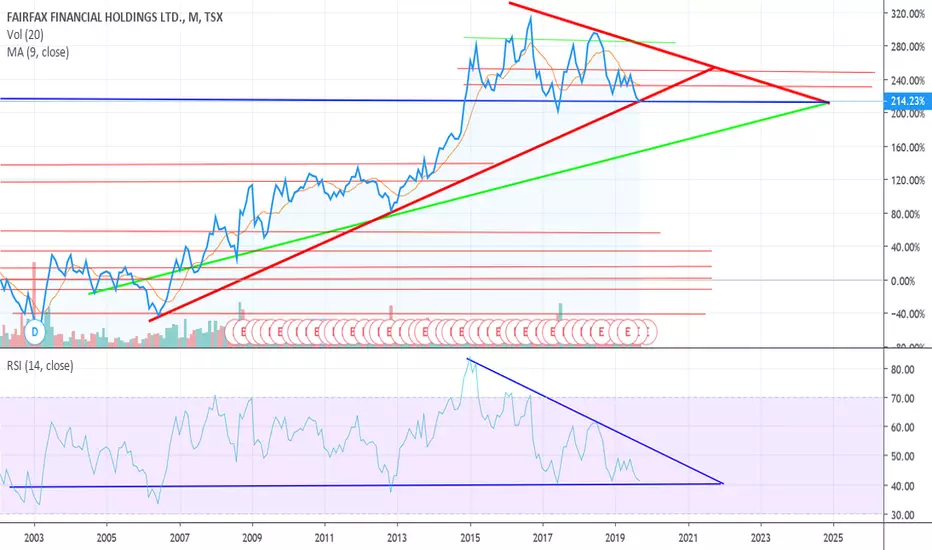
Is FFH forming a descending triangle?Maybe a symmetrical triangle / bullish pennant formation will take shape over the next months & years to come? Eom.
BTC Bullish PennantBtc appears to be forming a bullish pennant on the daily. Pennants are usually continuation patterns & very rarely produce a trend reversal. The move before the pennant formation is in an uptrend, so btc is likely to continue its move upwards if it breaks up above when we reach the apex of the triangle (we're nearly there/possibly already there).
Another key point is the volume. Volume should dry up during the formation of a pennant, which is what has been happening thus far. This adds further confirmation that this is very likely a bullish pennant. However a close below $9,300 at this point would invalidate this idea.


The 1 day bullpennant has once again become the dominant patternWe can see now after a very weak "breakout" from the 4hr chart falling wedge that it is the 1 day chart bull pennant that is still very much the dominant chart pattern at the moment. The good news about that is the breakout target should be much much higher than the falling wedge's target would have been. The bad news is the pennant is a descending triangle which has a slight chance of being a reversal pattern. We can also see the 4hr 50 and 200mas are at risk of deathcrossing in the near future if we don't see a bullish breakout from the pennant in the next few days. This is a 1 day chart but I placed the trajectory of those 2 4hr MAs on here with a dotted orange and dotted blue line so you could still see it on the 1 day chart. My bias is still leaning bullish here but because of the potential impending deathcross I'm gonna leave this idea neutral. Hopefully the pennant will break up before wednesday and we won't have t worry about a deathcross on the 4hr.

1day candle closes inside bullpennant; 4hr goldencross .Bear trapped confirmed as the 1 day candle that dipped down ad filled the 10.1k gap last night bounced all the way back up to close inside the bull pennant as I was expecting. We also hav a 4hr golden cross due to occur in the next 4-8 hours which I think will instigate a bullish breakout from this pennant.

1day symmetrical bull pennant? Or possibly an invered h&s.green horizontal still maintaining great support. the 1 day 50ma(in orange) continues to grow more and more parallel with the ascending red neckline double reinforcing boths levels of support: price action could continue to grind slowly up the red ascending line and form an symmetrical bull pennant it should ultimately pick a direction by the time it reaches the green descending top trendline of the larger 3 day symmetrical triangle though. Still a chance for it to be an inv h&s pattern here as well...2 different inv h&s are currently in play(shown here in yellow and pink). It's possible for the current pattern to be a combo of both a bull pennant and an inv h&s or 1 or the other.

BTC bull pennant... 8/27/2019Im watching a possible Bull pennant forming at this time. Lets see if it plays out... Set that stop loss if you plan on longing. A stop loss is like a back up parachute. I wouldnt skydive without one. Just like I wouldnt trade without a stop loss... But WTFDIK?

BTC - Pennant100 MA acts here again as a strong support line. Long position here with SL just below the 100 MA and the trend line.

Gold bullish pennantNow we have some more candles, GAP has been closed earlier today and now I see another sign for further up - bullish pennant, bottom lines have breen drew on 30 min time frame, so on 1h they probably doesn't look too right but on 30 min they are so if/when pennant is broken 1st tp at 1555.
Good luck!
P.s. Here is my new telegram group! t.me

BTC 10K resistance turns into support. Btc bullishTethers flowing, BTC sentiment has never been this low (Extreme fear) and thats a good thing. Always move against the herd. the herd is not bullish, the herd is not greedy, the heard fears bitcoin.
just look at the sentiment chart here: alternative.me , even in crash from 20000$ in February the sentiment was not this low. so shaky hands have been shooked. the rest are longterm investors. daily traders have shit their pants on these levels. so called experts are not reporting any trade. that's good.
just look at the google trends, the masses have not even been hyped about 2019 price move. trends.google.com
search terms are on low levels, and this is important since bitcoin is fully on web, web trends are saying a lot of information to us. they say this price move is not a hype its actually a gradual and healthy growth.


Is Bitcoin going to break this Bull Flag / Descending Triangle??It appears as though Bitcoin Is getting ready to go parabolic over the weekend & touch the top of this Descending Triangle, or potentially try to break this Bull Flag & put in a higher low.
Only problem I have, the volume etc are declining, so I'm not overly bullish.
It's hard to look for bullish patterns in a short term bear trend that potentially started roughly late June this year, egh.
Time will tell per usual.
