XRP Long Term Bullish OutlookCRYPTO:XRPUSD long term is very bullish.
I measured that we will hit the target profit $27 around early to mid 2025 based on the previous 1 year pole. You can see the formation of rally-consolidation-rally with a bullish pennant consolidation. RSI is looking good too, i'm certain it will close with a crossing but you can wait until december closing to make sure.
Also outside of technical analysis, xrp or ripple is very good fundamentally and narratively. The narrative of CBDC will be major if the world government implement this globally, i think it will be implemented in 2024 or 2025. It's best to buy XRP now.
Bullish Pennant

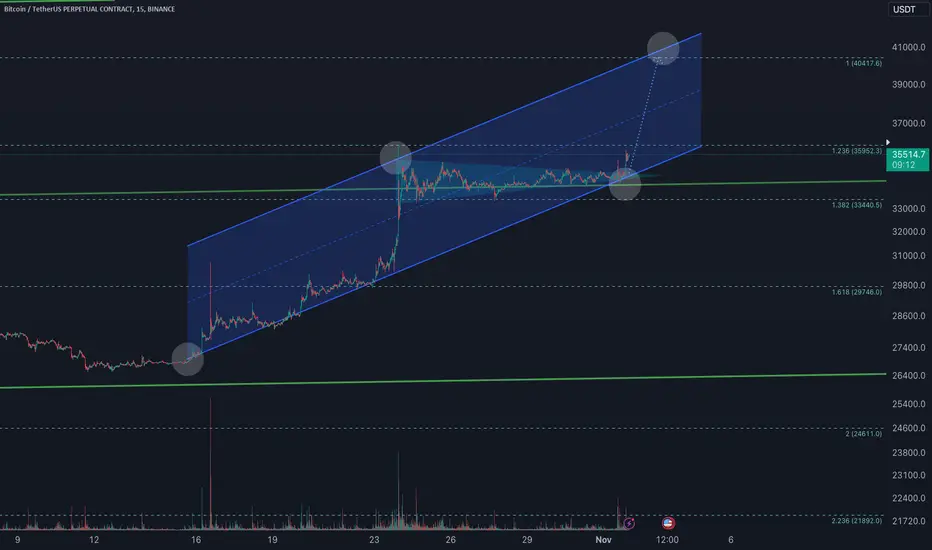
BTC broke the horizontal resistance of Ascending Triangle37k or 50k upcoming. Multiple patterns indicating a move.
I love trading BTC when volatility is aggressive...
Easy Money.

Polygon MATIC is heading for its next bull runA bullish pennant on the weekly timeframe indicates a move upward. Considering the bullish momentum we could go up all the way to $16.

⤴️⤴️GPBUSD) bullish on the market) analysis)🖼️🚀The dollar crept higher on the first trading day of the year as attention turned to economic data this week that may provide clues on the Federal Reserve's next moves, while bitcoin surged ahead of $45,000 for the first time since April 2022.
The dollar index
DXY
, which measures the U.S. currency against six rivals, fell 2% in 2023, snapping two years of gains. It was last at 101.44, up 0.059%, as investors weighed the prospect of the Fed cutting rates this year.
The dollar's ascent weighed on the Japanese yen
USDJPY
the most, with the Asian currency down 0.35% at 141.36 per dollar, having slid 7% in 2023.
Rescue teams in Japan on Tuesday struggled to reach isolated areas hit by a powerful earthquake on New Year's Day, with reports of more than 20 people dead in a disaster that toppled buildings and knocked out power to thousands of homes.
Markets are now pricing in an 86% chance of interest rate cuts from the Fed to start from March, according to CME FedWatch tool, with over 150 basis points (bps) of easing anticipated in the year.
"The question is when and how fast rate cuts will be delivered," Marc Chandler, chief market strategist at Bannockburn Global Forex, said in a note.
"Moderating price pressures and weaker growth impulses have seen the pendulum of market sentiment swing dramatically from the 'higher for longer' mantra of most of last year to pricing in aggressive easing" from central banks, Chandler said.
The focus now switches to a slew of economic data due this week, including the data on job openings and nonfarm payrolls. Minutes from the last Fed meeting in December are scheduled for release on Thursday and will provide insight into the central bankers' thinking around rate cuts this year.
"The positive sentiment from end-2023 may roll over into this week as all eyes turn to the U.S. jobs report on Friday," said Nicholas Chia, macro strategist at Standard Chartered.
At its December policy meeting, the Fed adopted an unexpectedly dovish tone and forecast 75 basis points in rate reductions for 2024.
That contrasted with other major central banks, including the European Central Bank (ECB) and Bank of England (BoE), which reiterated they will hold rates higher for longer.
Still, traders are pricing in 158 bps of cuts by the ECB this year, while the BoE is also expected to cut rates by 144 bps in 2024.
The euro
EURUSD
was down 0.13% to $1.103, inching away from the five-month peak of $1.11395 it touched last week. The single currency gained 3% last year, its first yearly gain since 2020.
Sterling
GBPUSD
was last at $1.2729, up 0.05% on the day, having clocked its strongest performance last year since 2017 with a 5% gain, although a weakening economy and election uncertainty make a repeat performance unlikely.
Elsewhere, the Australian dollar
AUDUSD
was up 0.35% at $0.68335. The New Zealand dollar
NZDUSD
was little changed at $0.63155.
The crypto world started the year with a bang, with bitcoin
BTCUSD
touching a 21-month peak of $45,532 on rising expectations that the U.S. Securities and Exchange Commission would soon approve exchange-traded spot bitcoin funds.

1INCH - Wyckoff Reaccumulation Flag w/Volume through Trendline#1INCH
The bear market trendline has just been pierced and closed above with beautiful volume.
This is exactly what we like to see during a Wyckoff Reaccumulation Flag

⬆️🎄 Gold bullish momentum) analysis ⬆️⬆️👀⬆️Hello trader’s what do you think about gold) ?
Traders are expected to reach a bullish momentum on this week’s
Gold now retest 2055 support levels
Now gold breakdown support levels
Resistance levels bak up ⬆️ 2070
Nxet Resistance levels up ⬆️ 2080
To key point
2070⬆️
2080⬆️

🚧ICXUSDT is Bullish now🚧 & many Traders don't see it 👀!!!Hi every one
➡️ICX has done a Impressive Movement recently but the odds of another bullish Movement is Pretty high because the pattern which ICX is in, Is a Bullish Pennant Pattern! Since The break out has not happened, there is no confirmation of a Bullish Movement But If It happens, we Can Expect a Bullish Movement as much as the Measured Price movement (Pennant pole) to happen!
🟡Summery:
-ICX has been Bullish Recently!
-The odds of another Bullish Movement is High!
-Bullish Pennant is Visible on The chart!
-No break out yet!
🤑Stay awesome my friends.
_ _ _ _ _ _ _ _ _ _ _ _ _ _ _ _ _ _ _ _ _ _ _ _ _ _ _ _ _ _ _ _ _
✅Thank you, and for more ideas, hit ❤️Like❤️ and 🌟Follow🌟!
⚠️Things can change...
The markets are always changing and even with all these signals, the market changes tend to be strong and fast!!

LINK-Beautiful Rising ABC Flag, Stair Stepping Up Out Of A Wedge#LINK
- Beautiful Rising ABC Flag
- Stair Stepping Up Out Of A Wedge
- Multiple Precision Touches On POI's
- Observe Reactions From POI's
- Volume In All The Right Places
= Number Go Up

Look At That Textbook Bull Pennant On The Bitcoin Daily ChartWould you just look at that beautiful, textbook bull pennant on the Bitcoin daily chart! You can't get much more textbook than that. What I am thinking based on this chart is that Bitcoin will make at least one more big rally this week up to that big supply zone between $47K-49K.
How this move happens has yet to be seen. We know that none of us have a crystal ball as much as we may think we do, and we need to take the data one candle at a time, but this is looking pretty bullish to me for the week.
Now, I fully expect Bitcoin to have a pretty major correction once we get to that supply zone. That bearish order block was formed at a pretty strong level so I fully expect for people to take profits in this area and looking for Bitcoin to make a correction, or at least some good consolidation so that we have a chance to repack our bags for the next moon shot.
We are still a few months off from the mining rewards being cut in half and anticipation is building. The ETF talk has got the markets all stirred up, so I am just taking it one day at a time.
Be safe out there in the crazy crypto markets! Nothing is set in stone and this is only my somewhat educated guess on what I see happening this week!
Trade Logically!

🚧EGLD is Bullish now🚧 & many Traders don't see it 👀!!!Hi every one
EGLD has done a Impressive Movement recently but the odds of another bullish Movement is Pretty high because the pattern which EGLD is in, Is a Bullish Pennant Pattern! Since The break out has not happened, there is no confirmation of a Bullish Movement But If It happens, we Can Expect a Bullish Movement as much as the Measured Price movement (Pennant pole) to happen! The Next target is around 93$!
🟡Summery:
-EGLD has been Bullish Recently!
-The odds of another Bullish Movement is High!
-Bullish Pennant is Visible on The chart!
-No break out yet!
-Next Target at 93$
🤑Stay awesome my friend.
_ _ _ _ _ _ _ _ _ _ _ _ _ _ _ _ _ _ _ _ _ _ _ _ _ _ _ _ _ _ _ _ _
✅Thank you, and for more ideas, hit ❤️Like❤️ and 🌟Follow🌟!

🚧XRPUSDT will Go Up Again🚧 Road Map(4-h)🗺️!!!As you can see, the price is in a Bullish flag, but it has not broken yet . 5 rising waves as well as the correction wave(ABC) have been completed and this means that we will have an increase in price SOON.
_ _ _ _ _ _ _ _ _ _ _ _ _ _ _ _ _ _ _ _ _ _ _ _ _ _ _ _ _ _ _ _ _
✅Thank you, and for more ideas, hit ❤️Like❤️ and 🌟Follow🌟!


My thoughts on BTC short termJust my thoughts on bitcoin short term, if it continues up the channel and nothing too wild occurs in the news or geopolitical landscape. I would like to hear your thoughts!
TOTAL2 is About to Explode!The crypto market is abuzz with a significant phenomenon - the shrinking of the total market capitalization, excluding Bitcoin (BTC). Contrary to what one might expect, this contraction often precedes a major pump in the world of cryptocurrencies, signifying the potential for exciting price movements. 🌌💥
Unpacking the Market Cap Contraction
Market cap contraction is a fascinating occurrence, one that hints at the complex dynamics of the cryptocurrency market. When we talk about the total market capitalization excluding Bitcoin, we're essentially looking at the collective value of all cryptocurrencies other than the big BTC.
The Compression Effect: A Precursor to a Pump
Why does contraction matter? It's because, in crypto, this phenomenon frequently acts as a precursor to a "pump," a substantial increase in prices. When the total market capitalization of altcoins starts to shrink within a defined range, it often indicates that the market is preparing for a major move.
Anticipating the Upward Surge
For crypto traders and enthusiasts, keeping an eye on this contraction is vital. It suggests that exciting price surges could be on the horizon for the world of altcoins. Such periods of compression often lead to increased trading activity, resulting in significant price movements.
Trading Strategy: Positioning for the Pump
As this exciting market cap contraction unfolds, cryptocurrency traders should consider crafting trading strategies to harness the potential pump. The market dynamics may offer numerous opportunities to capitalize on these upcoming price surges.
Conclusion: Crypto's Dynamic Landscape
Understanding the nuances of the crypto market is crucial, and the market cap contraction phenomenon is one of its fascinating aspects. As we navigate this period of compression, let's remain vigilant, prepared, and ready to embrace the opportunities that a potential pump can bring.
🚀 Crypto Insights | 💡 Trading Strategies | 💰 Market Analysis
❗See related ideas below❗
Share your thoughts and insights 💚🌐💚

Bitcoin double bottom pattern bullish price pushed up with good volumes and bulls are very strong bears lost ground at 31k..
with all the positive news coming its going to jump till 40k at least if bullishness continues.
i recommend to open long positions in a systematic manner so that u can catch any small falls..

Bullish Pennant PatternIn this guide, we unveil the secrets of Bullish Pennant pattern, exploring its psychology, identification, and trading strategies.
If you appreciate our charts, give us a quick 💜💜
Understanding the Bullish Pennant Pattern:
The bullish pennant emerges post an uptrend, forming a small symmetrical triangle (the pennant) during consolidation. This pattern signifies a battle between bulls and bears, ultimately leading to a breakout, usually upward, signifying the continuation of the uptrend.
Components of the Bullish Pennant Pattern:
An Uptrend: A prerequisite for this pattern, characterized by higher highs and higher lows.
A Pennant: A small symmetrical triangle forming after the uptrend, indicating consolidation.
A Breakout: The essential phase, marking the continuation of the uptrend, often occurring upwards.
Trading the Bullish Pennant Pattern:
Psychology Behind Bullish Pennant: A reflection of market consolidation after bullish momentum, highlighting the buyers' dominance.
Bullish Pennant vs. Bearish Pennant: Bullish pennants signal uptrend continuations, while bearish pennants suggest downtrend extensions.
Bullish Pennant vs. Bull Flag: Bull flags form after sharp rallies, while bullish pennants appear after extended uptrends, marked by converging trendlines.
Stop Loss Placement: Consider placing your stop loss at the pennant's resistance line for risk management.
Profit Target Setting: Customize your profit target, aligning with the pattern's flagpole height or a conservative approach, harmonizing with your risk management strategy.
Trade Wisely!
Follow us for expert trading tips and strategies!

XRPETH falling wedge/bull pennantWe can see that price action is reaching the apex of the white wedge/pennant and that the orange 50ma has now entered the pennant. Looking at where the stoch rsi currently is, odds are good that price can maintain support on the 50ma and that it could help lift or bounce price up out of the pennant and send it heading towards the breakout target. I have only posted the pennant breakout target here, the target for the wedge on its own will be a lower than this one, however I see that the pennant target share bullish confluence with the double bottom target so I feel that increases the odds that the breakout could result in it hitting the full pennant target instead of just the wedge target. Of course until a breakout is confirmed there’s still a chance it could go below the pennant and break downward instead although much less probable…it could also always do the classic fake like it’s breaking down when its really just pullling bad the slingshot before rocketing back upward and out of the pennant. We will likely see soon enough before September seems likely. *not financial advice*

AUDUSD Bullish Pennant BreakoutThe pair is already in an uptrend on higher time frames. We are expecting further upside which is signalled by the breakout of the bullish pennant pattern. We can also see the formation of a new high and a breakout of a key level which further supports our directional basis. Entry on retest of the key level.

BITCOIN BULLISH CONVERGENCE TRIGGEREDBitcoin can push upto 30k levels and can drop from there as bearish sell pressure exisits at 30k ranges..
if u want to take small profits u can enter if price breaks 200 ma

Mastercard Inc. leading the market on NYSE stocks todayMastercard Inc. is a leading technology company in the payments industry that provides payment processing solutions to businesses and consumers worldwide. Mastercard is one of the largest payment processors in the world by market cap and the number of payments processed.

UCO Bank Short Term Trade IdeaUCO bank has broken out of bullish pennant in Weekly/Daily Timeframe, One may consider to go long with SL at previous swing low, 26 , target 45-50. For a holding period of about 4-8 weeks.
Happy Trading, DYOR.

TESLA next bull run analysis you have to see.Telsa after long bearish trend pushing prices with higher high and higher low patterns indicating a near bull run scenario to be take place.
the convergence from point 2 to point 5 can act as bullish reversal and can push price to 1k USD or even more upside probably making tesla a multi bagger stock.
As fundamentals are strong and TA giving green signal you can invest in a SIP manner or one can start invest for long term once the raising wedge correction is finished .
best price for entries are from 200 ranges.
Thank you.

TVS motors bullish breakout analysisTVS broke out with 3 bullish candles and presently above support line
below 1300 setup is a fail...
next 4 months 1700 can be acheived
