Almost Boom Time!Over 2 years to form this bullish descending wedge! I don't know which moon we're aiming for but I don't think it's in this galaxy!
Bullish Pennant

It is the right time we fly, BUY.It is very clear that the US Tech 100 has been found consolidating for a long window as part of the cooldown, the strong support window allowed for a reversal, and currently, it is trading perfectly such that it will take major support as quoted and take a move to R1 and R2 and then soon we can also expect a short covering rally, flying into 13000, it is good that we buy at 12,500 levels with a stop loss of 50 points, the bullish momentum has been calculated using machine learning and Artificial intelligence techniques with statistics as a base.
Note: Trade at your own risk.

Tata consumer was in channel going to breakdown or breakouthello bro be ready for comment me for any stock analysis for me it free you have to just comment me name of stocks

ACS - bull pennantACS printing bull pennant under resistance level. This one moved nicely yesterday so keep an eye on it. Details on the chart
Good luck traders

NLST $3.71 TargetNLST has continued to rally since the the break out on 2/13,
The RSI spiked at 85 before retreating out of oversold territory and closing just over 70. This is very bullish.
Price closed above the 2.61 Fibonacci level on higher than average volume after testing the prior gap at $2.55
Price will likely find support at $2.55 and currently appears likely to make a bull flag/pennant pattern.
Short term target $3.71

OP is going to increase soon!OP/USDT broke out of Ascending Triangle formation on 2D Chart and printed a Bullish Pennant above its neckline
More upside if we break out of Bullish Pennant
_ _ _ _ _ _ _ _ _ _ _ _ _ _ _ _ _ _ _ _ _ _ _ _ _ _ _ _ _ _ _ _ _
🌍Thank you for seeing idea .
Have a nice day and Good luck

MATIC/USDT Buy setupthe price has broken the bearish channel after hitting the important 4-hour support area .
On the other hand, we have a bullish internal OB that we can enter into a safe buying trade after retesting it

We going to 35000 this year and 220000 in 2025, proofA bit late- but FED won't be printing money this year, they will figure out inflation is sticky and just do it next year. Gold and Bitcoin, similar assets will do well.
The chart of this year looks eerily similar to 2019.
Have a look:
Top:
2017 Dec 18 - 19700
2022 November 10 - 69000
Exactly four years.
Bottom:
2018 Dec 15 - 3650
2022 Nov 22 - 15650
Again, four years.
2019 June: 13,9k
2022 May: 35k
Again, four years.
Guess when the next top is?

XRPUSDT is inside a massive descending channelXRPUSDT has been creating a daily channel, indicating a period of consolidation and uncertainty in the market. However, after a bullish impulse, the market bounced off the 0.618 Fibonacci level, which is a common level of retracement in technical analysis.
This retracement suggests that buyers are still interested in entering the market and that there is strong support at this level. Furthermore, if the market is able to grab new liquidity from the 0.37$ area and break out of the descending channel, it would signal a potential shift in market sentiment from bearish to bullish.
If the market were to satisfy Plancton's Rules, which is a trading strategy that involves taking a long position when a market experiences a significant price increase, it could indicate that the market is gaining momentum and that there is strong bullish pressure in the market.
–––––
Follow the Shrimp 🦐
Keep in mind.
🟣 Purple structure -> Monthly structure.
🔴 Red structure -> Weekly structure.
🔵 Blue structure -> Daily structure.
🟡 Yellow structure -> 4h structure.
⚫️ Black structure -> <= 1h structure.
Follow the Shrimp 🦐

AGIX Targeting $1.00? Looks like AGIX is about to squeeze to a new ATH if this bullish pennant breaks out to the upside! 🚀
TP1 0.65
TP2 0.85
TP3 1.00

bank of badora is in consolidation zone i have mark that level in chart support and resis and be ready for this that it

SANDUSDWatching the daily chart on SANDUSD I can see that it broke out of a bullish pennant and the 1.618 level of fib.
Currently the price is retracing from the big green break out candle. It's possible that price comes back below the 1.618 fib or lower to retest the previous resistance.
2.618 of fib or $1.035 is the next major resistance level to look at. If that breaks it can reach the flagpole target of $1.24.
If it crashes. We can see price go back to $0.63-$0.53 levels.
Waiting to see if this bullish pennant plays out.

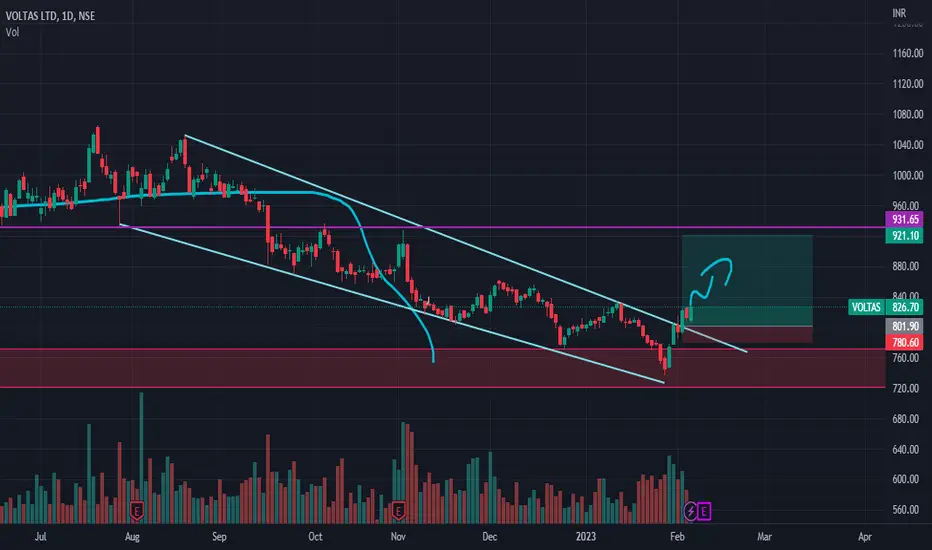
bro i have found channel breakout on voltas be ready for bullish breakout happen to be ready for comment me stock analysis
FTm bull penn playing outWe are almost to the target but i wanted to point out this textbook breakout and retest of the bull pennant

BULLISH into BEARISH ScenarioTSLA has momentum to move to 180 area. (This needs to happen before FOMC meeting)
I thought Tesla was finished here, but momentum is strong and puts are piling in, I think we may see a continued rally to 169,if we close above 167.55 on daily or weekly, Tesla could hit 180 by Tuesday, before selling off
Technical Bullish Patterns:
15min- Bullish pennant breakout - measured move to 170-175 (close below 154.5) invalidates (false break-out)
Daily: H&S Pattern measured move to 175-181 (close below )
Technical Bearishness:
1 hr - Bearish Divergence on RSI, MACD, STOCH
200 WMA: 167
currently oversold on BB bands
Bearish Catalysts:
-1/27 PCE Prices higher than expected
-1/31 employment cost index higher than expected
-1/31 Bad Tech earnings
-2/1-Fed Drops Market on Feb 1st (FOMC decision) **** I think Fed will tank the market

Awaiting confirmation of pennant chart pattern - SBI NSE:SBIN
Awaiting confirmation of pennant chart pattern on SBI's chart

Ethereum - New all-time high soon!
Ethereum is currently breaking out of the bearish descending channel after 418 days! The profits are already massive, but the good news is that we are just starting the new bull market, not ending it!
A new all-time high on ETH is closer than everyone is expecting, so I hope your bags are full of crypto. The bull market is always the most profitable session, because the risk-to-reward ratio of trades is much higher than in the bear market.
From the Elliott Wave perspective, the downtrend has been completed with a classic ABC zigzag corrective pattern. We have already begun a new impulse wave in June 2022!
This analysis is not a trade setup; there is no stop-loss, entry point, profit target, expected duration of the trade, risk-to-reward ratio, or timing. I post trade setups privately.
The trend is your friend until the end, but the trend has changed from bearish to bullish, so for swing and intraday trades, you should look mostly for longs, not shorts!
I expect this bull market to end in September 2025, so we have plenty of time! Be greedy until the whales dump again for the next bearish cycle.
This is a long-term technical analysis on the weekly / 3D chart. Pullbacks on lower timeframes are possible, so follow me for more updates!
Every bullish cycle looks different, but I look forward to this bullish price action!
Thank you, and for more ideas, hit "Like" and "Follow"!

SHR forming the most obvious bull pennant ever?Well, this is a bull pennant if I've ever seen one. However, how reliable are patterns like this when it comes to microcap tokens like SHR? Pretty much not reliable at all. In fact most of the time, patterns like this are likely painted on purpose by whales in order to create some FOMO to dump on. Still interesting to watch how this will develop from here. Looks extremely bullish in the short-term, but could just as easily be a trap.

SKL/USDT BREAKOUT! READY FOR A 30-40% PUMP!!Hello everyone, if you like the idea, do not forget to support it with a like and follow.
Welcome to this SKL/USDT trade setup.
SKL looks good here. Breaks out from the bullish pennant in 1hr time frame. Long now and add more in dip.
Target:- 30-40%
SL:- $0.0345
If you like this idea then do support it with like and follow.
Thank You!

A Cautious Trend Continuation Idea Bullish Indications
• As per DOW’s theory Price action is registering Higher Highs and Higher Lows.
• Candle Stick pattern show Inverted Hammer is followed by Bullish Engulfing candle which indicates Bulls are in control.
• Support zone is at 1.23386 which can help price bounce up to continue bullish trend.
• Linear Regression Channel with standard deviation 2 is used as trend line Support and Resistance. It is evident Price has respected
median line and moved back up.
• Support Zone confluences with Fib Level 78.6% and price has respected it.
• Formation of Bullish Pennant , which indicates continuation of current trend.
• As per Seasonal Analysis, BXY remain Bullish until closing of 2nd week of January 2023 with an increment of
2.35% from December 2022. It is
safe to say it can sustain to close bullish for January Month.
• On the other hand, as per last 10 years seasonal BXY remain slightly bearish in January month.
• Macro Analysis on 1 Day Time-Frame trend is Bullish.
• Micro analysis on 15 Minutes Time-Frame Trend remains Bullish.
• Hidden Bullish Divergence spotted on RSI oscillator.
• Average Directional Index , which measures the trend direction strength and its value is at 31.96 which indicates trend is strong.
Bearish Indications
• Price action is approaching Resistance zone at 1.24103 which can bounce back.
• DXY index analysis shows it to be testing a major support area which can provide a cushion for a bounce back which can result in trend
reversal upon confirmation.
• AB=CD Harmonic Pattern indicates a reversal in trend is possible in area of 1.24526. But we can be only sure of reversal of trend if DOW’s
theory is valid for the trend.
• 10 years Seasonal analysis of DXY show it remain Bullish in January.
• BXY index analysis shows it to be approaching a major resistance zone which can bounce back the trend.
Analysis Takeaways:
As per facts available to us and projections we can assume that it is quite possible that trend will continue to be bullish with a short-term bounce back from resistance area and again will continue as biased. However, we can’t reject the possibility of trend reversal into a bearish trend as per market sentiments so we need to be cautious and safely take what we can until that happens.
Bias : Long
Plan (Long)
Entry Long: 1.23677 (Fib Lvl 88.6%)
TP: 1.24543 (Fib Lvl 100%)
TP2 : 1.25936 (Fib Lvl 1.27%)
Stop Loss: 123.066 (Fib level of 78.6%)
Risk/Reward: 1:3.94
Manage your Risk Accordingly and Remember Stop Loss is your friend.
If this post was useful to you, do not forget to like and comment.

Bitcoin - Last chance to buy below 20k! (lifetime opportunity)
Congratulations to the bulls for this successful start of the bull market! It's really a pleasure to watch these candles.
Bitcoin may give you the last chance to buy below the 20k level, so I hope you are going to take this once-in-a-lifetime opportunity! You can buy on the spot market or leverage long on futures.
It's still possible to retest the previous breakout level of the trendline, which is around 18,300. So this will be your dream entry, and trust me when I say this!
This analysis is not a trade setup; there is no stop-loss, entry point, profit target, expected duration of the trade, risk-to-reward ratio, or timing. I post trade setups privately.
So, why do I believe bitcoin has reached its bottom? From the technical perspective, there are multiple indications, and I will tell you all the arguments.
The halving is coming, and usually bitcoin finds incredible strength before and after the halving event. This is statistical data based on historical performance.
Bitcoin is breaking out of the falling wedge, bullish reversal pattern on the weekly chart and also is breaking out of the major trendline established in November 2021 with a successfull retest. Basically, Bitcoin is above all major trendlines on the linear scale.
We have a bullish divergence on the weekly RSI, that has been confirmed recently. All altcoins show huge signs of trend reversal, not just Bitcoin.
As per my Elliott Wave analysis, the downtrend has been completed as an ABC ZigZag (5-3-5 structure). You can see my Elliott Wave count on the chart. We are starting a brand new impulse wave to the upside!
On the way up, there is a lot of resistance. Resistance 1 is almost certainly going to be reached. The next resistance is the 0.618 FIB + 0.618 FIB LOG and, of course, the unfilled GAPS, POC, and the previous all-time high.
Thank you, and for more ideas, hit "Like" and "Follow"!

BTC Bullish Pennant on 2Hr TFPresently BTC is forming a bullish pennant chart pattern on 2hours time frame. If BTC is able to break out of the pennant, it has a major resistance level to break at the yellow level. If that is broken, we can then resume the uptrend, else the price would crash down.
The major indicator to watch again this week is the #DXY which i guess may have a temporary pullback once the FX market opens on monday, this mat cause a reversal for the general market in a short time

Bitcoin - Please be greedy and FOMO in!
Bitcoin is absolutely pumping heavily right now, and there is not too much time for you to jump in, so you need to FOMO in ASAP and be greedy!
The pump is real, and if you think this is a scam pump and we are going to go soon to 14k, then ...........
The next target for Bitcoin is around 29k! In one of my next analyses, you will see why this is a very important level, so make sure you follow me!
Bitcoin is currently approaching a significant resistance level, which is the 0.618 FIB + start of the FTX dump + start of the GAP. It's possible that the bears will step in temporarily, so keep that in mind!
There is of course a possibility of a retest of the rectangle pattern, which is at 18,400. Also, it's a breakout level of the major trendline from August.
If you haven't seen my idea from January 5, where I told you bitcoin was going to exponentially pump, check out the related section down below. Everyone was bearish back in the day!
There is absolutely no bearish divergence on the higher timeframes, and the uptrend looks extremely healthy and powerful!
This analysis is not a trade setup; there is no stop-loss, entry point, profit target, expected duration of the trade, risk-to-reward ratio, or timing. I post trade setups privately. I share my trades privately.
If we take a look at the end of the downtrend, we can spot a SFP (swing failure pattern), or someone can also call it a double bottom pattern. The neckline of this pattern is currently breaking out. A trendline from August is breaking out as well.
From the Elliott Wave perspective, we are in the third wave of the third wave, which is the most impulsive phase. Also, you can see my Elliott Wave count on the chart, so check it out.
Thank you, and for more ideas, hit "Like" and "Follow"!
