XAUUSD Smart Money Technical Analysis – Bullish Potential XAUUSD Smart Money Technical Analysis – Bullish Potential from Strong Support
Gold (XAUUSD) is currently trading around $3,291.780, showing a potential bullish reversal setup from the strong support zone after a clear liquidity sweep and market structure shifts.
🔍 Key Technical Highlights:
✅ Strong Support Zone (Demand)
Price is reacting from a major demand zone (Strong Low) between $3,275 – $3,225, a level that previously triggered bullish rallies.
Multiple Breaks of Structure (BOS) and CHoCH indicate previous bullish control and a possible re-accumulation phase.
✅ CHoCH Near Support
A recent Change of Character (CHoCH) around the support area shows the first signs of smart money accumulation.
Liquidity below recent lows has been swept, triggering possible bullish intent.
✅ Bullish FVG (Fair Value Gap)
A clear Bullish FVG remains unmitigated around the mid-range, offering target confluence at $3,349.560.
Price may aim to rebalance inefficiency and fill the FVG as part of the bullish move.
✅ Resistance Zone Above
The resistance area near $3,325 – $3,350 acts as a short-term target for long positions.
Further resistance lies at the Buy-Side Liquidity & Weak High zone around $3,450 if momentum sustains.
🧠 Smart Money Concept Interpretation:
Liquidity Grab: Price dipped into strong demand to collect sell-side liquidity before potential reversal.
CHoCH + BOS Alignment: Indicates the market may now transition into a bullish phase.
FVG as Magnet: Price is drawn toward unfilled value zones—ideal for bullish target projection.
🎯 Trade Idea (Educational Purposes Only):
Bias: Bullish
Entry: Around current zone ($3,290)
Target: $3,349.560 (FVG zone)
Invalidation/SL: Below strong low (~$3,225)
Bullishreversal

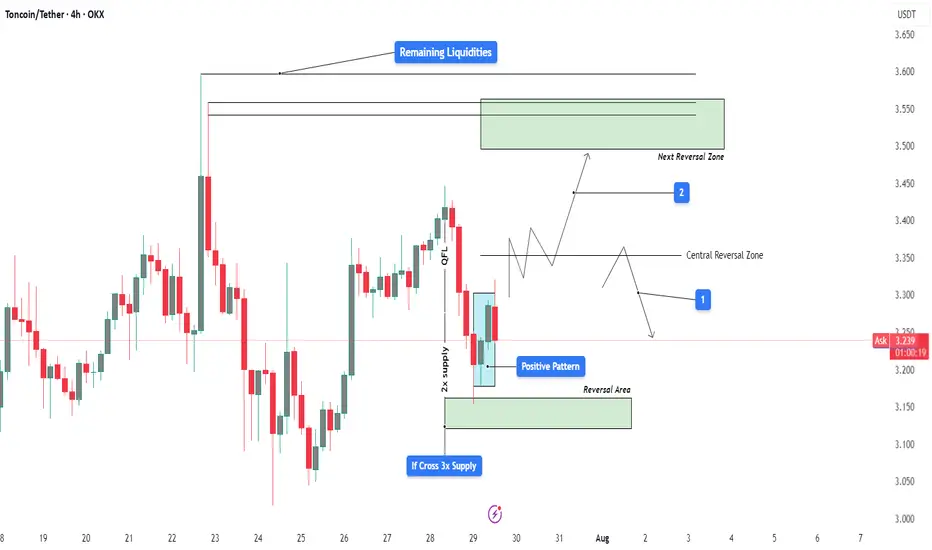
TONUSDT Bullish Reversal from Demand with QFL Base | MMC Setup📊 Technical Breakdown – 4H Chart
✅ Overview
TON/USDT is exhibiting early signs of a bullish reversal after a structured decline into a key smart money demand zone. The setup reflects multiple layers of confirmation—QFL base, multi-supply absorption, liquidity inefficiencies, and a positive reversal pattern—suggesting a high-probability opportunity for upside.
🔹 1. Impulsive Move & Liquidity Sweep
Price rallied aggressively on July 22–23, pushing toward $3.60, breaking short-term highs and triggering liquidity grabs above recent consolidation zones.
This surge absorbed significant buy-side liquidity, leaving a supply zone behind, now marked as the Next Reversal Zone.
After liquidity was collected and orders filled, the market reversed sharply, consistent with institutional profit-taking or engineered liquidation traps.
🧠 Smart Money Insight: Institutions often push price into illiquid zones (above highs) to trap retail and fill large orders. This marks the first phase of the trap.
🔻 2. QFL Base and Multi-Supply Absorption
The price structure created a Quick Flip Level (QFL) — a smart money concept where price forms a base, drops, then rallies, leaving behind an institutional demand zone.
The current pullback has revisited this exact QFL base, now reinforced by 3x supply absorption, enhancing the zone's strength.
This confluence increases the probability of a strong reaction to the upside from this level.
📌 Note: The “If Cross 3x Supply” label shows that this zone has absorbed multiple attempts to break down. It's now acting as a demand pocket.
🔄 3. Reversal Area – The Engine Room of Smart Money
The Reversal Area is carefully marked at $3.20–$3.28 — the ideal discounted price zone where large buyers tend to step in.
This zone is structurally important:
Past breakout level
Aligned with QFL base
Beneath stop levels of breakout traders
A Positive Pattern has now formed within this area—likely a bullish engulfing, morning star, or pin bar, depending on candle confirmation.
📌 Psychology: This zone acts as a trap. Retail traders often panic sell here, while smart money accumulates quietly before launching price upward again.
🧭 4. Dual Scenario Structure – Projected Paths
You’ve beautifully mapped two valid future price scenarios based on reaction to the Central Reversal Zone (~$3.35):
🔵 Scenario 1 – Healthy Pullback Before Continuation
Price climbs toward the central zone, then pulls back slightly to retest support near $3.28–$3.30 (label 1).
This allows further accumulation before price breaks higher.
This is a safer re-entry scenario for patient traders looking for a retest.
🟢 Scenario 2 – Direct Impulsive Rally to Next Reversal Zone
Price continues with bullish momentum, slicing through $3.35 and aiming for the Next Reversal Zone at $3.52–$3.60 (label 2).
This zone contains remaining liquidity, left uncollected from the previous impulse.
Price is likely to reverse or pause at this level again due to heavy supply.
📌 Key Tip: If price reaches that zone without significant resistance or exhaustion, it may signal continuation potential with minor corrections.
💼 Strategic Trade Plan (High-Probability Setup)
Entry Zone: $3.20 – $3.28 (Reversal Area)
Stop-Loss: Below $3.15 (beneath structure + QFL base invalidation)
Target 1: $3.35 (Central Reversal Zone)
Target 2: $3.52–$3.60 (Liquidity Completion & Next Reversal Zone)
🧮 Risk-Reward Estimate:
Conservative: 1:1.8
Aggressive: 1:2.5 or better if price reaches high liquidity zone.
🔄 MMC Flow Summary – What the Market Makers Are Doing:
Create a trap at the top (collect liquidity and fake the trend)
Force price down into demand (scare retail + grab stops)
Absorb sell orders in bulk at QFL/demand zone
Form bullish reversal pattern (positive structure)
Push price upward again, aiming for uncollected liquidity above
📌 This is a classic MMC cycle — engineered by large players, and now you’re aligned with their strategy.
🧠 Why This Matters
This chart isn’t just about entry and exit; it’s about understanding the underlying psychology and structure. By aligning with the smart money footprint — QFL, supply absorption, and liquidity targeting — you're maximizing edge and minimizing guesswork.
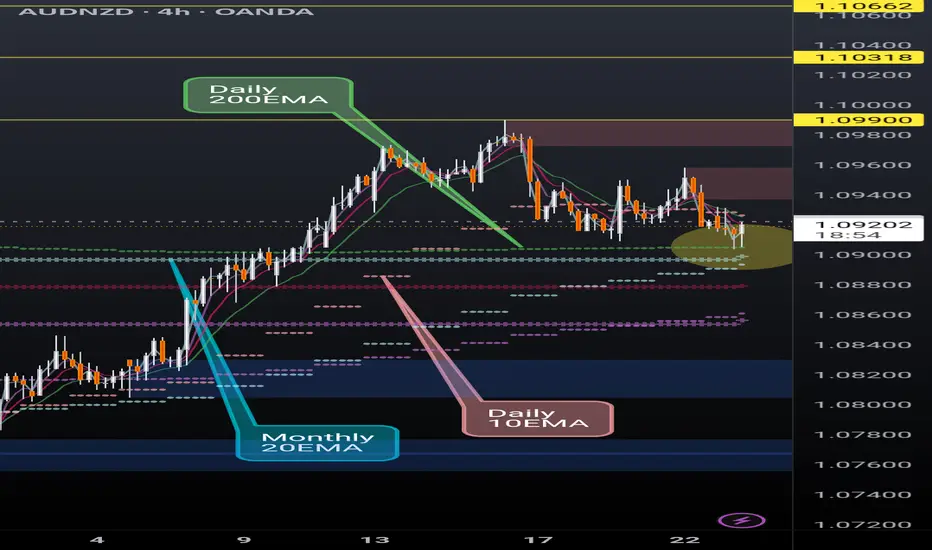
AUDNZD finding support on critical EMAsAUDNZD is finding support at the daily 200EMA (overlayed on 4H chart) and, more significantly, above the monthly 20EMA (overlayed). Break and hold the daily 10EMA (overlayed) will be key.
If the momentum continues we could see a continuation of the ongoing rally however recent AUD monetary policy meeting minutes seemed to lean dovish.
I'm a cat not a financial advisor.
Nike Looks Ready — A Smart Time to Consider InvestingOn the monthly chart, NIKE has been in a downtrend since November 2021, but the signs are pointing toward a potential trend reversal. Here's why I believe the bottom may already be in:
✅ MACD Histogram shows a strong positive divergence, signaling weakening bearish momentum.
✅ The RSI downtrend line has been broken and successfully retested, confirming bullish strength.
✅ A clear hammer candle has formed at a historical wide support zone, showing strong demand.
Now, price is facing three consecutive resistance levels — and with each breakout, the next zone becomes the new target, (87.5 → 102 → 122).
The structure suggests a step-by-step move higher if momentum holds. Keep an eye on the breakout above the descending trendline — that’s where things could accelerate.

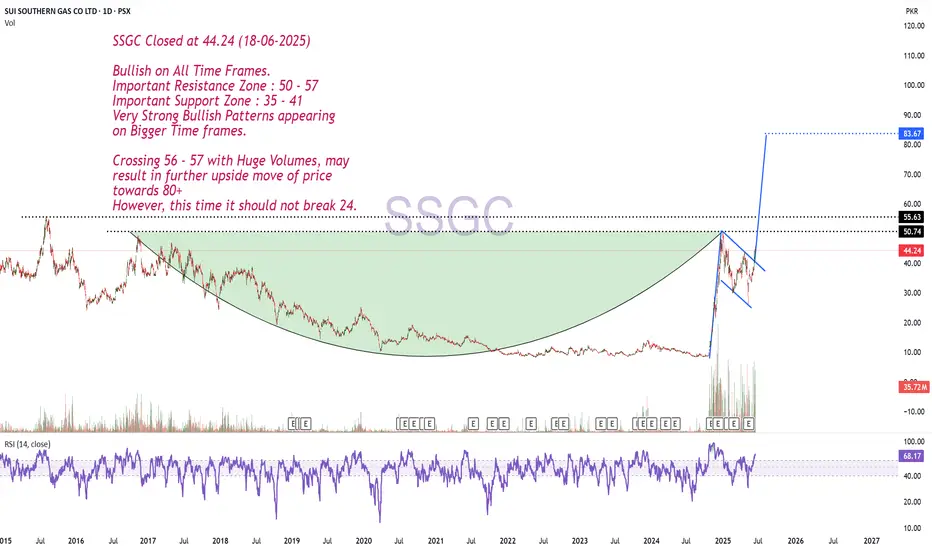
Bullish on All Time Frames.SSGC Closed at 44.24 (18-06-2025)
Bullish on All Time Frames.
Important Resistance Zone : 50 - 57
Important Support Zone : 35 - 41
Very Strong Bullish Patterns appearing
on Bigger Time frames.
Crossing 56 - 57 with Huge Volumes, may
result in further upside move of price
towards 80+
However, this time it should not break 24.
GTLB reverses to increaseBased on wave analysis, the main support line and RSI indicator when the price is oversold below 40, it shows a very high possibility of GTLB reversing to increase.
The price now (Closed on 06.16.2025): $42.08.
Price target: $47.76/ $50.50.
Stop loss: $39.
!!! Important note for stoploss as price can return to fill gap $35.68 at any time.
IMO, amateur trader.

Inverse H&S pattern.Closed at 16.75 (04-06-2025)
Inverse H&S pattern.
Sustaining 16.45 may lead it
towards 18.70 - 19 initially
& then 20.50 - 21.50
Stoploss is Must!

EUR/GBP Bullish Breakout Forming – Falling Wedge & Retest SetupEUR/GBP has been in a prolonged downtrend over the past several weeks, characterized by lower highs and lower lows. However, the recent price action shows signs of exhaustion in selling pressure, as the candles begin to compress into a Falling Wedge pattern — a classic bullish reversal formation.
The wedge is defined by two descending, converging trendlines. As price moves closer to the apex of this wedge, volatility contracts and volume typically dries up (not shown here, but conceptually expected). This signals that market participants are preparing for a directional breakout, most likely to the upside in this context.
🔍 Key Technical Elements:
🔸 1. Falling Wedge Pattern:
The Falling Wedge is a bullish setup that forms during a downtrend and signals a potential reversal when confirmed. Price here has followed a steady decline, but the slowing momentum and structure of the wedge suggest the sellers are losing control.
The wedge acts as a compression zone, where bearish moves are becoming less impactful.
Price touches both upper and lower wedge boundaries multiple times, increasing pattern validity.
A breakout has already occurred, and the pair is now undergoing a textbook retest of the broken wedge resistance (now acting as support).
🔸 2. Retest at Key Support Zone (SR Interchange):
The retest is happening precisely at a former support/resistance flip zone, labeled SR – Interchange on the chart. This is a historically significant area where price has reacted multiple times, adding confluence to the setup.
If this level holds during the retest, it may invite strong buying interest, fueling the bullish breakout move.
🔸 3. Resistance Zones & Targets:
Inner Resistance (~0.8460): First hurdle for bulls; breaching this will signal strong momentum.
Minor Resistance (~0.85618): This is the primary target of the setup, based on previous structure and wedge height projection.
Major Resistance (~0.8740): A longer-term bullish objective if momentum sustains beyond the first two targets.
These zones serve as logical areas for profit-taking and reassessment.
📐 Measured Move & Target Projection:
The projected breakout target of 0.85618 is derived using a combination of:
The vertical height of the wedge at its thickest point.
Previous market structure resistance zones.
Fibonacci and price symmetry (if analyzed further).
This target also aligns with a previous supply zone, making it a strong magnet for price if bullish momentum kicks in.
💡 Trading Plan (Not Financial Advice):
This setup provides a good risk-to-reward opportunity if executed with patience and proper confirmation:
Entry Zone: After bullish confirmation at the retest (e.g., bullish engulfing candle, pin bar, or break of minor lower high).
Stop Loss: Below the SR Interchange zone or recent swing low (~0.8350–0.8360).
Target 1: Inner Resistance (~0.8460)
Target 2: Minor Resistance (~0.85618)
Target 3 (extended): Major Resistance (~0.8740)
🔄 Market Psychology:
This chart setup reflects a shift in momentum and sentiment:
Sellers have driven the price down consistently but have failed to create new significant lows with force.
Buyers are stepping in at key demand zones, creating higher lows within the wedge.
The breakout suggests smart money accumulation, and the current retest offers one of the last low-risk entries before a broader move.
🔔 Confirmation to Watch:
Bullish reversal candlestick patterns at the retest zone.
Break above local lower highs near 0.8440–0.8460.
Momentum indicators (if used) showing divergence or crossover confirmation.
📉 Bias:
Short-Term Bullish
Valid if support at 0.8390–0.8400 holds and price confirms breakout continuation.
🧠 Minds Post (Expanded Explanation)
Title: EUR/GBP Bullish Reversal Developing – Falling Wedge Breakout Retest
EUR/GBP has broken out of a textbook falling wedge on the 4H chart, which often signals the end of a downtrend and beginning of a new bullish phase. The price is currently pulling back, testing the breakout zone — a crucial step in confirming the validity of the breakout.
If this retest holds, we may see a sharp move toward the 0.8460 and 0.8560 levels — both key resistances based on past price action.
This pattern reflects a deeper market psychology shift — from consistent bearish dominance to a potential bullish takeover. Smart money may already be positioning here.
I’m watching for confirmation at the support zone around 0.8390. If price holds and breaks above local highs, a continuation toward the upper resistance is likely.
Let the market come to you. Don’t chase. Wait for structure, then trade with confidence.

ADITYA BIRLA CAPITAL LTD – Trend Reversal Breakout Trade🧠 Technical Highlights:
Downtrend Channel Breakout: Clear breakout from a falling channel pattern
Resistance Break: Strong breakout above supply zone of ₹204–₹210
Volume: Massive volume spike validates bullish strength
RSI: Above 70, indicating strong momentum but not overbought yet
🟢 Buy Setup
Buy Above: ₹219 (today's close confirms breakout)
Stoploss: ₹204 (below the previous resistance/new support)
Target 1: ₹235
Target 2: ₹248
Target 3: ₹260+ (swing/high-risk high-reward)
🔻 Sell/Short Setup (only if reversal)
Sell Below: ₹203
Stoploss: ₹210
Target: ₹190, ₹178
📅 Timeframe: Short-to-Medium Term (2–6 weeks)
📊 Risk-Reward: ~1:2.5
For Education Purposes Only

Gold Bulls Are Loading — Don’t Miss the Fair Value Launch Zone🔍 XAUUSD 30M | Smart Money Breakdown
Gold just gave a liquidation + FVG bounce setup with a high-probability bullish reaction.
Let’s break it down like a sniper 🧠👇
🔻 1. Falling Channel Structure
Gold’s been grinding down in a neat descending channel, consistently taking out liquidity beneath swing lows.
This compression usually ends in aggressive expansion — and Smart Money knows it.
🔁 2. FVG Reclaim = Institutional Entry Zone
The chart shows a Fair Value Gap (FVG) perfectly respected around $3,226 – $3,236.
Price dipped into this imbalance and is now reacting — textbook Smart Money entry.
You're seeing clear demand stepping in after a sell-side liquidity sweep.
📈 3. Target = Upper Channel + Imbalance Fill
If momentum holds, Gold likely reaches for the upper channel resistance and fills the imbalance zone up to ~$3,280+.
That’s your primary draw on liquidity.
🎯 4. Trade Plan (RR ~3:1)
📍 Entry: Around FVG zone ($3,226–$3,236)
❌ Stop-Loss: Below the FVG zone
✅ TP: $3,280 (upper channel tap)
Smart Money is entering early while retail waits for confirmation breakouts 👀
🧩 Key Confluences:
✅ Falling Channel
✅ Fair Value Gap Tap
✅ Bullish Engulfing Response
✅ Clean RRR Setup
✅ Liquidity Sweep Prior to Entry
📊 Summary:
This setup screams Smart Money Accumulation. Gold hunts the lows, reclaims the imbalance, and is now gearing up for a bullish run. The reaction off the FVG is your golden ticket.
Let price work — don’t chase, just manage risk like a pro.
💬 Comment “💰 XAU Sniper Setup” if you caught this one early!
⚔️ Follow @ChartNinjas88 for elite Smart Money plays.
👀 Tag a trader still shorting this range 😅

2 Mai - Gold targeting 3318 ?💰 Gold on the Move – Bearish or Bullish? 🤔
Hey traders! 👋
On the 1H chart, Gold was chillin’ on a trendline starting from $3386 on Wed, Apr 23, climbing up till $3353 on Mon, Apr 28 📈. But then... it changed direction! 😬
Starting Wed, Apr 30, we saw a shift to a lower trendline at $3319, and today it’s trying to climb above $3300 🔄.
📉 Bearish vibes? We're eyeing a dip toward $3279.
📈 Bullish comeback? If Gold breaks above $3279, we might see some real momentum! 🚀
👉 What’s your take? Drop your thoughts in the comments! 💬
-------------------------------------------------------------------------
This is just my personal market idea and not financial advice! 📢 Trading gold and other financial instruments carries risks – only invest what you can afford to lose. Always do your own analysis, use solid risk management, and trade responsibly.
Good luck and safe trading! 🚀📊

OFSS Weekly | Bullish Harmonic Reversal & RSI Breakout | Short-T📈 Swing Trade Recommendation (Short-Term):
Buy Zone: ₹8,600–₹8,750 (on dips or on strength)
Target 1: ₹9,300 (initial resistance and round number)
Target 2: ₹10,200–₹10,500 (next harmonic resistance zone)
Stoploss: ₹8,050 (below recent swing low)
🔍 Technical Highlights:
Bullish Harmonic Structure forming with strong reversal from "C" to "D".
Volume breakout supports the current leg of momentum.
RSI bullish divergence and breakout confirms potential trend reversal.
For Education purpose only

EURJPY Weekly Forecast: Triple Bottom Breakout & Bullish Target Overview of the Chart & Market Structure
The EUR/JPY daily timeframe chart presents a Triple Bottom Pattern, a powerful bullish reversal formation that suggests a potential shift in market sentiment. This pattern occurs when price tests a key support level three times and fails to break lower, indicating strong buying interest at that zone.
Historically, a Triple Bottom leads to a significant trend reversal as sellers lose strength and buyers gain control. If confirmed by a breakout above resistance, this setup could provide a high-probability trading opportunity for swing traders and position traders.
Key Chart Components & Price Action Analysis
1. Triple Bottom Formation
The three bottoms marked on the chart represent repeated failed attempts by sellers to push the price lower:
Bottom 1 (August 2024): The first rejection from the support zone (~155.000) led to a temporary bounce.
Bottom 2 (October 2024): Price retested the same level, but buyers stepped in again, preventing a breakdown.
Bottom 3 (March 2025): The final test of support confirmed a strong accumulation zone, setting the stage for a potential bullish breakout.
In technical analysis, a Triple Bottom is considered a stronger reversal signal than a Double Bottom, as it represents prolonged buying pressure at key levels.
2. Support & Resistance Levels
Support Zone (~155.086): This level has been tested multiple times and remains a solid demand zone, where buyers have consistently entered the market.
Resistance Zone (~166.000): This level represents the neckline of the pattern, which must be breached to confirm a bullish reversal.
Breakout Target (~179.233): If price breaks out above 166.000, the projected target is set at 179.233, based on the height of the Triple Bottom pattern.
Trading Strategy & Entry Plan
1. Entry Point – Waiting for Confirmation
A buy trade should be initiated ONLY after a confirmed breakout above the resistance level (~166.000). Traders should wait for a daily candle close above this level, preferably with high volume, to confirm the breakout.
2. Stop Loss Placement
A stop-loss should be placed below the third bottom (support level) at 155.086 to minimize risk.
This placement ensures that if price invalidates the pattern by moving below the support level, the trade is exited early.
3. Profit Target Calculation
The measured move technique is applied to estimate the target. The height of the pattern (distance from support to resistance) is projected upward from the breakout point.
Target price: 179.233, aligning with historical resistance.
4. Risk-to-Reward Ratio & Position Sizing
The risk-to-reward ratio (RRR) for this setup is favorable, making it an attractive swing trade opportunity.
Traders should adjust position sizes based on risk tolerance, ensuring proper money management principles are applied.
Additional Confirmation Factors
1. Volume Analysis
A breakout with increasing volume will confirm strong bullish momentum.
Weak volume during breakout could indicate a false breakout, requiring caution.
2. RSI & Momentum Indicators
RSI trending above 50 suggests growing bullish strength.
Bullish divergence on RSI or MACD would add further confidence to the trade.
3. Retest of Resistance as Support
Often, after breaking resistance, price retests the breakout level before moving higher.
This could offer a secondary entry opportunity for traders who miss the initial breakout.
Potential Risks & Market Conditions to Watch
False Breakouts – If price fails to sustain above resistance, the pattern could be invalidated.
Macroeconomic Events – Major news events, such as ECB or BOJ policy decisions, could impact EUR/JPY movement.
Geopolitical Uncertainty – Unexpected events may cause volatility and deviation from technical patterns.
Conclusion – High-Probability Bullish Setup
The Triple Bottom Pattern in EUR/JPY is shaping up as a strong bullish reversal setup. If the price successfully breaks above 166.000, a rally toward 179.233 is expected.
📌 Trading Plan Recap:
✅ Entry: Buy above 166.000 (confirmed breakout).
✅ Target: 179.233 (measured move projection).
✅ Stop Loss: 155.086 (below support).
✅ Risk-Reward Ratio: Favorable for swing traders.
This setup aligns well with technical and price action strategies, making it an attractive trade idea for the upcoming weeks.

EUR/USD Triple Bottom Reversal | Bullish Breakout SetupChart Overview
This is a EUR/USD 1-hour chart showing a classic Triple Bottom Reversal Pattern, a strong bullish reversal signal. The price has tested a key support level multiple times, forming three distinct bottoms, indicating that sellers are losing momentum while buyers are stepping in.
This setup suggests an upcoming breakout, with well-defined entry, take profit, and stop-loss levels to capitalize on the potential upward move.
Technical Breakdown
1. Support & Resistance Zones
Support Zone (Highlighted in Beige)
The price has tested this zone multiple times without breaking below, confirming strong buying interest.
Each time the price touched this level, it rebounded, indicating accumulation by buyers.
Resistance Zone (Highlighted in Beige)
The price previously reversed from this level, making it a key area to watch for a breakout.
A confirmed breakout above this resistance could trigger strong upward momentum.
2. Triple Bottom Formation
A Triple Bottom is a strong bullish reversal pattern. It consists of:
Bottom 1: First rejection from support.
Bottom 2: A retest of support with buyers defending the level.
Bottom 3: The final touch before an upward move, confirming the pattern.
This pattern signals that selling pressure is diminishing and buyers are preparing for a strong breakout.
3. Bullish Reversal & Breakout Zone
A breakout above the neckline resistance (around 1.0843) will confirm the pattern.
Traders should wait for a confirmed candle close above the resistance before entering a long position.
A retest of the breakout zone can provide an additional entry opportunity.
Trade Setup & Key Levels
🔹 Entry Strategy
Aggressive Entry: Enter at the breakout level (above 1.0843) with volume confirmation.
Conservative Entry: Wait for a breakout retest before entering long.
🎯 Take Profit Targets
TP1: 1.08868 (First resistance zone)
TP2: 1.09642 (Major resistance zone, strong price reaction expected)
❌ Stop Loss Placement
Stop Loss: Below 1.06786, under the support zone.
This ensures that if the price breaks below the key level, the trade is invalidated.
Market Sentiment & Expected Move
If the price breaks the resistance → Expect a strong bullish move toward TP1 and TP2.
If the price fails to break out → It may consolidate further or retest support.
Watch for increased volume on the breakout to confirm strength.
📌 Final Thoughts
This is a high-probability bullish setup based on a well-formed Triple Bottom Reversal pattern. Traders should monitor price action near the breakout zone and manage risk effectively with proper stop-loss placement.

CHF/USD Trading Setup – Triple Bottom Reversal & Breakout Setup🔍 Overview of the Chart Setup
The CHF/USD (Swiss Franc vs. U.S. Dollar) 1-hour timeframe chart reveals a classic Triple Bottom pattern, which is a well-known bullish reversal signal. This pattern indicates that sellers have attempted to break the support level three times but failed, suggesting a potential shift in momentum from bearish to bullish.
Traders closely watch this structure as it often leads to a strong upward breakout once key resistance levels are breached. The current setup provides an excellent risk-to-reward trading opportunity, especially for those looking to capitalize on the breakout.
📊 Key Levels in the CHF/USD Chart
1️⃣ Support and Resistance Zones
🟢 Support Level (~1.1300 - 1.1280 Zone)
This zone has been tested three times, confirming strong buying interest at this price level.
The formation of long wicks on candlesticks signals strong demand and buyer dominance.
A breakdown below this level would invalidate the bullish setup and may indicate a continuation of the bearish trend.
🔴 Resistance Level (~1.1415 - 1.1430 Zone)
This level acts as a price ceiling, where previous bullish attempts were rejected.
A break and retest above this zone would confirm the Triple Bottom breakout.
🎯 Target Level (~1.1457 Zone)
The projected target is based on the height of the pattern, which is measured and added to the breakout point.
This level aligns with previous price action zones and acts as a natural take-profit area for traders.
🚨 Stop-Loss Level (~1.1243 Zone)
A stop-loss is placed below the support zone to protect against false breakouts or an invalidation of the pattern.
📉 Understanding the Triple Bottom Pattern
The Triple Bottom is a strong bullish reversal formation that occurs at the end of a downtrend. It signals that sellers are exhausted, and buyers are gradually taking control.
🔹 Breakdown of the Triple Bottom Formation
✅ Bottom 1 (First Low)
The first bottom forms when the price hits the support level and bounces back.
Sellers are still active, so price declines again to test the same support zone.
✅ Bottom 2 (Second Low - Confirmation of Support)
The second test of the support zone validates the demand area.
Buyers step in again, pushing the price upward.
The market still lacks enough momentum for a breakout, leading to a third retest.
✅ Bottom 3 (Final Low and Strong Rejection)
The third bottom is crucial because it signals the last test of support before a breakout.
The failure to break lower creates a higher probability of an upside move.
📌 Breakout Confirmation & Price Action Signals
🔵 The breakout is confirmed when:
The price closes above the resistance zone (1.1415 - 1.1430) with strong momentum.
Volume spikes during the breakout, indicating institutional buying interest.
A successful retest of the resistance zone as new support further validates the trend reversal.
If the breakout lacks volume or gets rejected, traders should be cautious of a fakeout or potential retracement.
📈 Trading Strategy & Execution Plan
🔹 Conservative Entry (Safe Approach)
Enter after a confirmed breakout above 1.1415, ensuring a strong candle close above resistance.
Look for a retest of the breakout level before entering the trade.
🔹 Aggressive Entry (Early Positioning)
Enter near the third bottom (~1.1300 - 1.1320) with a tight stop-loss.
Higher risk but better reward if the price moves upward without retesting.
🔹 Stop-Loss Placement
Conservative traders: Place the stop-loss below the support zone (~1.1243).
Aggressive traders: Place a tight stop below the recent swing low for better risk management.
📌 Profit Target Projection
Take Profit Target: 1.1457, based on the height of the pattern.
📌 Risk-to-Reward Ratio
Risk: ~60 pips (from entry to stop-loss).
Reward: ~150 pips (from entry to target).
Risk-to-Reward Ratio: 1:3, making it a high-probability trade.
📡 Additional Confirmation Indicators for Stronger Trade Setup
📊 1. Volume Analysis
A spike in volume at the breakout level suggests strong buyer interest.
Low volume on the breakout may indicate a potential fakeout.
📈 2. RSI (Relative Strength Index) Confirmation
RSI should be above 50 and trending upward to confirm bullish momentum.
If RSI is overbought (>70), watch for a pullback before entering the trade.
📉 3. Moving Averages Support
If the 50-period or 200-period moving average supports the breakout level, it adds extra confirmation.
A moving average crossover may further validate the trend reversal.
🔍 4. Beware of Fake Breakouts
If the price briefly moves above resistance but fails to hold, it may be a bull trap.
Always wait for a candle close above resistance and a potential retest before confirming the entry.
🛠️ Alternative Scenarios & Market Risks
🔺 Bullish Scenario (Breakout & Rally to Target)
Price breaks above 1.1415, confirming a trend reversal.
A retest of resistance as support gives additional buying confidence.
Price reaches 1.1457 target before facing new resistance.
🔻 Bearish Scenario (Fakeout & Breakdown Below Support)
Price fails to hold above resistance and falls back below support.
A breakdown below 1.1243 invalidates the pattern, triggering a bearish continuation.
Traders should cut losses quickly if the setup is invalidated.
⚠️ Fundamental Risks to Watch
U.S. Dollar news events (FOMC, NFP, CPI reports) can increase volatility.
Swiss economic data may impact CHF strength.
Unexpected geopolitical events can influence currency movements.
🔎 Summary of the Trading Plan
📌 Trading Strategy Checklist
✅ Pattern: Triple Bottom (Bullish Reversal).
✅ Entry Strategy: Buy after breakout confirmation above 1.1415.
✅ Take Profit Target: 1.1457.
✅ Stop-Loss Level: Below 1.1243.
✅ Risk-to-Reward Ratio: 1:3 (High-Profit Potential with Proper Risk Management).
💡 Final Thought:
This setup provides a high-probability bullish trade with strong technical confluence. However, always remain cautious of market news, economic reports, and sudden volatility that could influence price action.
🚀 Patience & discipline are key—wait for confirmation before entering! 📊

EUR/GBP - Double Bottom Reversal Setup | Trendline BreakoutThis EUR/GBP (Euro to British Pound) daily chart presents a textbook double bottom reversal pattern, signaling a potential trend reversal after a prolonged downtrend. Additionally, a trendline breakout further strengthens the bullish outlook.
The market structure suggests that buyers are regaining control, and a breakout above the neckline resistance zone (0.84500 - 0.85000) could trigger a significant upward move. Let's break down this setup in detail.
📊 Technical Breakdown of the Chart
1️⃣ Double Bottom Formation – A Strong Reversal Signal
🔹 The double bottom is a powerful bullish reversal pattern that forms after an extended downtrend, indicating that selling pressure is fading and buyers are stepping in.
🔹 First Bottom: Established in December 2024, where the price reached a key support level (~0.82453) before bouncing back.
🔹 Second Bottom: Formed in March 2025, confirming the validity of the support level and creating a solid demand zone.
🔹 The neckline resistance (0.84500 - 0.85000) is the key level that price must break to confirm the reversal.
2️⃣ Trendline Breakout – Shift in Market Sentiment
🔹 The market has been in a downtrend, as shown by the descending trendline acting as resistance for several months.
🔹 Recently, the price broke above this trendline, indicating that bearish momentum is weakening and a potential trend reversal is underway.
🔹 This breakout adds confluence to the double bottom pattern, reinforcing the bullish bias.
3️⃣ Key Support & Resistance Levels to Watch
📌 Support Zone (Bottom Area) – 0.82453:
✅ This level has been tested twice (December & March), confirming it as a strong demand zone.
✅ Price consistently rebounded from this level, showing buyers’ dominance.
✅ This is the ideal stop-loss level to protect against downside risks.
📌 Resistance Zone (Neckline) – 0.84500 - 0.85000:
✅ A breakout above this neckline resistance is necessary for a bullish continuation.
✅ If price breaks and retests this level as support, it will confirm a high-probability buy setup.
📌 Target Level – 0.87394 (Projected Move)
✅ This is calculated using the measured move technique, where the distance from the bottom to the neckline is projected upwards.
✅ This level coincides with a previous resistance zone, making it a realistic target.
📈 Trading Strategy – How to Trade This Setup
🎯 Entry Plan for Long Position (Buy Setup)
1️⃣ Breakout Entry:
Enter a long position after a confirmed breakout above 0.85000.
Watch for strong bullish candles with volume confirmation.
2️⃣ Retest Entry (Safer Option):
If price breaks above resistance, wait for a pullback and retest of the 0.84500 - 0.85000 level.
If price holds this zone as new support, it strengthens the bullish confirmation.
📉 Stop-Loss Placement (Risk Management)
✅ Place a stop-loss just below the support zone (0.82453) to protect capital.
✅ This level is strong because price has bounced off it twice, confirming buyer strength.
🎯 Profit Target (Take Profit)
✅ The projected target is 0.87394, aligning with previous resistance.
✅ This offers a high reward-to-risk ratio (RRR), making the trade worth taking.
⚠️ Risk Management & Market Outlook
✅ Bullish Bias – Price action suggests uptrend continuation after breaking out of the trendline.
✅ Confirmation is Crucial! – Enter only after a clear breakout and retest.
✅ Watch for Fakeouts – If price fails to hold above the neckline, it could be a false breakout.
✅ Fundamental Factors – Keep an eye on economic data and central bank policies (ECB & BoE) that may impact the GBP & EUR.
📢 Final Thoughts – Why This Trade is High-Probability
🚀 Double Bottom + Trendline Breakout = Strong Bullish Signal
🚀 Neckline Breakout Above 0.85000 = Confirmation of Trend Reversal
🚀 Targeting 0.87394 with a Favorable Risk-Reward Setup
If price successfully breaks and holds above resistance, we could see a strong rally toward 0.87394 in the coming weeks.
📌 Monitor price action carefully and wait for confirmation before entering the trade.
🔔 Like & Follow for More Trading Setups! 🚀📈

XAG/USD (Silver) – 1H Technical Analysis & Trade SetupThis analysis presents a high-probability bullish trade setup based on key price action principles, market structure, and technical indicators. The chart illustrates a potential reversal from a support zone, a descending channel breakout, and an overall shift in trend dynamics.
1. Market Structure & Key Price Levels
Before placing any trade, it's essential to analyze the bigger picture, including support and resistance levels, trend structure, and liquidity zones. Let's break down the key areas:
A. Resistance Area (Supply Zone) – $34.20 to $34.60
This horizontal resistance zone has historically acted as a selling pressure area where price faced rejection.
It represents a profit-taking zone for bulls and a possible reversal point for bears.
If price successfully breaks and closes above this resistance, it could signal further upside potential.
B. Support Level (Demand Zone) – $32.90 to $33.10
The price has consistently bounced from this region, indicating strong buying interest.
This level has acted as a demand zone, where institutions or large traders are likely accumulating positions.
A strong bullish reaction from this zone strengthens the reversal scenario.
C. Change of Character (CHoCH) – Key Structural Shift
A Change of Character (CHoCH) is marked on the chart, indicating a potential shift from a bearish to a bullish trend.
This is one of the most reliable signals when transitioning from a downtrend to an uptrend.
2. Chart Pattern & Price Action Analysis
A. Descending Channel Formation (Bullish Reversal Pattern)
The market has been forming a descending channel, which is a corrective pattern rather than a continuation pattern.
This structure consists of lower highs and lower lows, indicating short-term selling pressure.
However, when such a pattern forms near strong support, it often precedes a breakout and trend reversal.
A confirmed break above the channel's upper trendline will serve as a bullish breakout signal.
B. Liquidity Grab & Stop Hunt Consideration
Many retail traders place stop-loss orders below the support zone, making it an area of liquidity accumulation.
The market may attempt to sweep these stops before moving up, which aligns with institutional trading behavior.
If price momentarily dips below the support and then quickly reverses with strong bullish momentum, it confirms a stop hunt and a possible reversal setup.
3. Trading Strategy & Setup
To maximize profits while managing risk, we need a well-structured entry, target, and stop-loss strategy.
📌 Entry Strategy
Aggressive Entry:
Enter a buy position within the support zone ($33.00 - $33.10) if bullish price action (e.g., bullish engulfing candle) confirms buying pressure.
Conservative Entry:
Wait for a clear breakout from the descending channel’s upper trendline, then buy on a retest.
This reduces the risk of a fakeout and provides higher confirmation.
🎯 Target Levels (Take Profit Zones)
First Target (TP1) – $34.26
This is a key resistance level where price previously reversed.
Partial profit-taking is recommended here to secure gains.
Second Target (TP2) – $34.60
If momentum continues, price could reach this extended target.
Strong breakout volume would support this move.
🛑 Stop Loss (SL) Placement
Stop-loss should be set below the support zone ($32.45).
This ensures adequate risk management and avoids premature stop-outs.
If price breaks below this level with strong selling volume, the bullish setup is invalidated.
4. Risk Management & Trade Considerations
📌 Risk-to-Reward Ratio (RRR):
The trade setup offers an RRR of at least 1:3, making it a high-probability trade.
📌 Possible Fakeouts & Confirmation Signals:
If price breaks above the descending channel but fails to hold above support, it's a sign of a fake breakout.
Watch for strong bullish volume and clear break of previous lower highs before entering long.
📌 Fundamental Factors:
Keep an eye on economic reports, Federal Reserve speeches, and USD strength, as they heavily influence Silver prices.
5. Conclusion – High-Probability Bullish Setup
Descending channel breakout, strong support level, and CHoCH indicate a potential bullish reversal.
If buyers successfully defend the support zone, price is likely to target $34.26 – $34.60.
Risk management is crucial – waiting for confirmation reduces chances of a failed trade.
🚀 Watch for bullish confirmation before entering!

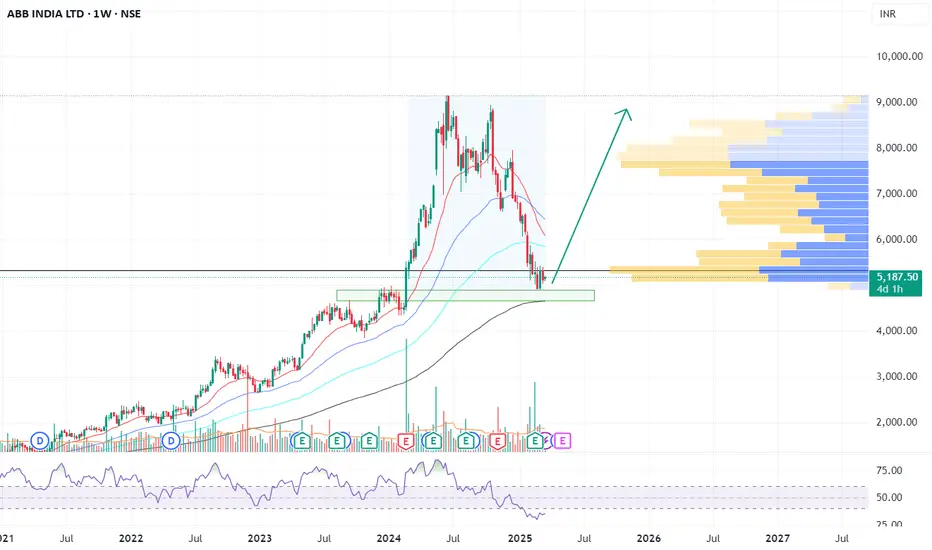
ABB India Ltd. (NSE: ABB) - Technical Analysis & Market OutlookABB India Ltd. (NSE: ABB) - Technical Analysis & Market Outlook
Overview:
ABB India Ltd. has demonstrated significant price action over the past few years, with a strong uptrend followed by a corrective phase. The current price action suggests a potential reversal from key support levels, presenting an opportunity for long-term investors and swing traders.
Key Observations:
Support Zone: The stock is currently testing a major support level around ₹5000 - ₹5200 , which aligns with a previous accumulation zone and historical resistance-turned-support.
200-Week Moving Average: Price action is hovering near the 200-week moving average, which has historically acted as a strong dynamic support.
RSI & Momentum: The Relative Strength Index (RSI) has moved into oversold territory and is now showing early signs of a potential reversal.
Volume Profile Analysis: The highest volume concentration is observed around the ₹6000-₹7000 range, indicating a major supply zone where price may retest if a reversal occurs.
Price Structure: The formation suggests a higher low structure , which is a positive sign for bullish continuation.
Potential Trade Setup:
Entry : Around the current levels of ₹5100-₹5200 with confirmation of bullish momentum.
Stop-Loss : Below ₹4800, as a break of this level may invalidate the bullish thesis.
Target 1 : ₹7000 (previous consolidation zone & high-volume area)
Target 2 : ₹9000 (previous swing high & psychological resistance)
Conclusion:
ABB India Ltd. is currently at a critical juncture, with strong confluence of technical factors supporting a potential upside move. Traders should monitor price action closely for confirmation before entering. If the support holds, the stock has a high probability of reversing towards higher levels.
Disclaimer: This analysis is for educational purposes only and should not be considered as financial advice. Conduct your own research before making any trading decisions.
Cummins India LongEntry- 2805-2810. ( Any dip till 2780 will be a buying opportunity)
Support- 2650
Target- 2950, 3000
Pattern- Looking great for a reversal from hereon. Making a bullish engulfing on daily chart and a sort of triple bottom around 2600 levels.
Disclaimer- This is just for education purpose please take advice from your financial advisor before making any decision.
Jai Shree Ram.

ETH/USD - Technicals and Fear Index Point to Upside!Welcome to another Wolf of Blockstreet analysis where I take a look on ETH/USD!
On the weekly timeframe, we can observe a significant market structure since the last low in September 2024. ETH in 2024 underwent an ABC correction into a strong support zone, followed by a massive wick up. This was followed by two bullish weeks, establishing a higher high, and then a wick fill down that set up a double bottom pattern.
This could be happening again. Additionally, we see a long-term support trendline in play here, reinforcing the bullish setup.
At the same time, the Fear and Greed Index is at a historically low level, signaling extreme fear in the market. As of February 27, 2025, the index stands at 10, which is even lower than the fear levels seen during the FTX crash in November 2022.
Historically, extreme fear in the market has often represented one of the best times to buy, as it tends to be followed by a recovery and upward movement in prices. The double bottom pattern on ETH/USD, combined with the extreme fear indicated by the Fear and Greed Index, could signal a potential reversal to the upside.
My key area to look for long-term buying opportunities lies in the $2000-$2200 range. This zone provides strong support and could serve as an ideal entry point for those looking to accumulate ETH for the long run. However, this idea would become invalid if we see a weekly candle close below this range, indicating a potential shift in market dynamics.
While both the technical analysis and market sentiment suggest a bullish reversal could be on the horizon, we need to see confirmation here and the cryptocurrency market remains highly volatile. Investors should conduct thorough research and be aware of the inherent risks before making any trading decisions.
For more updates you can follow me on X: @PuppyNakamoto

SOLUSDT: Long or Trap? Breaking Down the Setup
🔥 ** BINANCE:SOLUSDT.P ** is bouncing off the support zone, showing strength from the bulls! After a sharp dump, price held a key level and is now pushing up. The big question — is this a true reversal or just a "bearish retest" before another drop?
---
🔑 **Key Levels:**
**Support:**
**171.06 USDT** — strong demand zone.
**160.23 USDT** — critical level, breaking below could trigger more downside.
**Resistance:**
**199.55 USDT** — local resistance; breaking above could accelerate movement.
**272.53 USDT** — key target for profit-taking.
**295.16 USDT** — strong supply zone; breaking above opens the door to 300 USDT+.
---
🚀 **Trading Strategy:**
**Entry Point:**
- Long from **171.06 USDT** with volume confirmation.
- Conservative entry after a breakout of **199.55 USDT**.
**Stop-Loss:**
- Below **160.23 USDT** to avoid stop hunts.
**Take-Profit Targets:**
**198.45 USDT** — first target to reduce risk.
**272.53 USDT** — primary target for the bullish move.
**295.16 USDT** — extended target if the uptrend continues.
---
📈 **Technical Analysis:**
Increasing volume on the bounce signals strong buyer interest.
A breakout above **199.55 USDT** confirms bullish momentum.
If price drops below **171.06 USDT**, expect a potential retest of **160.23 USDT**.
---
💡 **Conclusion:**
SOLUSDT.P is showing bullish reversal signs, but without breaking **199.55 USDT**, we can't confirm a full trend shift yet. Is this just a retest before another sell-off or the start of a new uptrend? Let’s discuss! 🚀💬

Trading MRI comprehensive trade analysis for BNZIBanzai International, Inc. ( NASDAQ:BNZI ) is a marketing technology company that provides essential marketing and sales solutions for businesses of all sizes. Recent acquisitions, financial restructuring, and a reverse stock split signal strategic shifts aimed at enhancing the company’s market position. However, its financial metrics reflect significant challenges, including negative operating, profit, and gross margins.
Recent Stock Performance
Closing Price (Dec 20, 2024): $1.71 (+5.56% from previous close of $1.62).
Daily Trading Range: $1.63–$1.85.
Volume: 4.07 million shares (below the 4.23 million average).
Volatility:
5-day fluctuation: 16.33%.
30-day fluctuation: 11.04%.
Moving Averages:
+11.89% above 20-day SMA.
-19.48% below 50-day SMA.
-82.60% below 200-day SMA.
52-Week Range:
-99.23% from 52-week high.
+32.05% above 52-week low.
Recent Company Developments
Acquisitions:
Vidello: Adds 6.5M in revenue and 2.3M in EBITDA (announced Dec 20, 2024).
OpenReel: Enhances AI-powered marketing with enterprise video solutions (completed Dec 19, 2024).
Debt Restructuring (Sept 2024): 5.6M liabilities written off; 19.2M restructured.
Reverse Stock Split (Sept 19, 2024): 1-for-50 split to meet Nasdaq listing requirements.
These developments indicate strategic efforts to stabilize operations and capture growth in the video marketing sector.
Analysis Overview
Daily Timeframe:
Setup: Green Setup 3 progressing toward Green Setup 4.
Trend: Bullish short-term, supported by price action above the 20-day SMA.
Key Levels:
Resistance at $1.85.
Support at $1.60.
Weekly Timeframe:
Setup: Transition from Red Setup 8 to Green Setup 1.
Trend: Strong reversal potential.
Key Levels:
Resistance at $1.80–$1.95.
Support at $1.35.
Monthly Timeframe:
Setup: Red Setup progression from 2 to 4.
Trend: Bearish continuation.
Key Levels:
Breakdown below $1.45 signals bearish dominance.
Support at $1.30 and $1.20.
snapshot
Risk Assessment
1. Probabilities:
Daily (Bullish): ~50.7% success rate.
Weekly (Bullish Reversal): ~90% success rate.
Monthly (Bearish Continuation): ~55.6% success rate.
2. Risk-Reward Ratios:
Daily: 1:1.5 (moderate).
Weekly: 1:2 (favorable).
Monthly: 1:1.5 (moderate).
3. Trade Risks:
Financial instability and operational losses may limit upside potential.
Reverse stock split suggests efforts to manage compliance rather than growth.
Trade Recommendations
Daily Chart:
Action: Long on confirmation of Green Setup 4.
Entry: Above $1.75.
Stop-Loss: Below $1.60.
Targets: $1.85, $1.90.
Weekly Chart:
Action: Long on confirmation of Green Setup 2.
Entry: Above $1.80.
Stop-Loss: Below $1.35.
Targets: $1.95, $2.00.
Bold Prediction for Q1 2025 NASDAQ:BNZI
Optimistic Scenario:
If bullish reversals on daily and weekly charts are confirmed, supported by revenue growth from recent acquisitions:
Target Price: $2.10–$2.20.
Drivers: Growth in video marketing demand and operational cost savings from debt restructuring.
Target Price: $2.10–$2.50 by Q2 2025.
Pessimistic Scenario:
If bearish continuation dominates, compounded by financial challenges:
Target Price: $1.15–$1.25.
Conclusion and Bold Prediction
BNZI's stock performance in 2025 will hinge on the successful execution of its strategic initiatives and the market reception of its enhanced video marketing solutions.
Optimistic Scenario: Integration of Vidello and OpenReel drives growth and operational efficiencies, potentially lifting the stock to $2.50 by mid-2025.
Pessimistic Scenario: Continued financial losses and market volatility may push the stock to a low of $1.10 by mid-2025.
Investors should monitor quarterly updates on revenue growth, profitability improvements, and operational synergies from recent acquisitions. This will provide crucial insights into the company's trajectory in 2025.

BNZI:Could 2024's Low Be Behind Us? 2025 Signals a Potential UpAs we close out 2024, Banzai International, Inc. ( NASDAQ:BNZI ) shows signs that the worst may be over. With improved stock performance, strategic acquisitions, and significant financial restructuring, the company appears poised for a potential turnaround in 2025. However, critical confirmation signals are still required before declaring a bullish reversal.
Weekly Timeframe:
Trend: BNZI is transitioning from a "Red Setup 8" to a "Green Setup 1" on the weekly chart, suggesting a possible bullish reversal.
Key Levels:
Resistance: $1.80–$1.95.
Support: $1.35.
While the trend hints at a shift in momentum, traders should remain cautious, as longer-term signals still suggest the need for confirmation.
Recent Company Developments
Vidello Acquisition:
This acquisition is expected to add $6.5 million in revenue and $2.3 million in EBITDA for the trailing twelve months through September 30, 2024.
OpenReel Acquisition:
Enhances BNZI's AI-powered marketing platform, particularly in video marketing, positioning the company to capitalize on rising market demand.
Debt Restructuring:
Reduced liabilities by $5.6 million and restructured $19.2 million in debt. While this strengthens the financial position, it also underscores past financial challenges that must be carefully managed.
Reverse Stock Split:
1-for-50 split ensures compliance with Nasdaq listing requirements but raises concerns about organic growth.
Key Observations
Price rebound: BNZI closed at $1.71 on December 20, 2024, marking a solid 5.56% increase from the previous day. The stock has bounced 32.05% above its 52-week low, hinting at a potential bottom.
Bullish momentum: The stock trades 11.89% above its 20-day SMA, signaling short-term bullish sentiment. However, it remains below longer-term moving averages, suggesting that the reversal is not fully confirmed.
Acquisitions driving growth: The Vidello and OpenReel acquisitions are set to boost financial performance, adding $6.5 million in revenue and $2.3 million in EBITDA. These moves align with BNZI's strategy to focus on AI-driven marketing solutions.
2025: A Fresh Start?
Monthly Chart Update
Trend: Bearish continuation with Red Setup progression (2 to 4). However, the weekly chart's signals suggest a potential reversal could emerge.
Action: Wait for two consecutive green candles on the monthly chart to confirm a bullish outlook for 2025.
Entry Strategies
Bullish Scenario:
Enter long after confirming two monthly green candles, signaling a reversal.
The key breakout level is $1.85. If breached, momentum could carry the price to $2.00 and beyond.
Risk Considerations
While BNZI's prospects look promising, risks remain:
Post-Reverse-Split Volatility: The reverse split may increase price swings, impacting investor confidence.
Acquisition Integration Risks: Successfully integrating Vidello and OpenReel is critical to realizing expected revenue and EBITDA gains.
Broader Market Conditions: Macroeconomic trends and sector-specific challenges could impact BNZI's growth trajectory.
Conclusion
2024 was a year of volatility and restructuring for BNZI. As we head into 2025, the company appears to be on firmer ground, with improved fundamentals and strategic initiatives. However, technical confirmation of a trend reversal is essential before declaring a bullish outlook.
Key Takeaways for Traders:
Watch for two consecutive green monthly candles to confirm the bearish trend reversal.
A breakout above $1.85 could signal the start of a strong uptrend, potentially pushing the price to $2.00 and beyond.
Stay cautious of a breakdown below $1.45, which could reignite bearish momentum.
By balancing these factors, traders can position themselves effectively to capitalize on BNZI's potential opportunities in 2025.
Check more in-depth analysis:
TradingMRI
Want More Analysis?
📢 Check out our Reddit post on r/TradingMRI for an in-depth breakdown of BNZI’s setup, including technical insights, key levels, and trade recommendations.
👉 Visit Reddit - r/TradingMRI
Let’s discuss whether NASDAQ:BNZI is setting up for a breakout or another leg down. 🚀💡
