Bullish Flag Pattern.
Bullish Flag Pattern.
Crossing 435 with Heavy volumes will
trigger more positivity & will expose
New Highs targeting 700+
On flip side, breaking 300 now, will
bring more selling pressure.
Bullishsetup

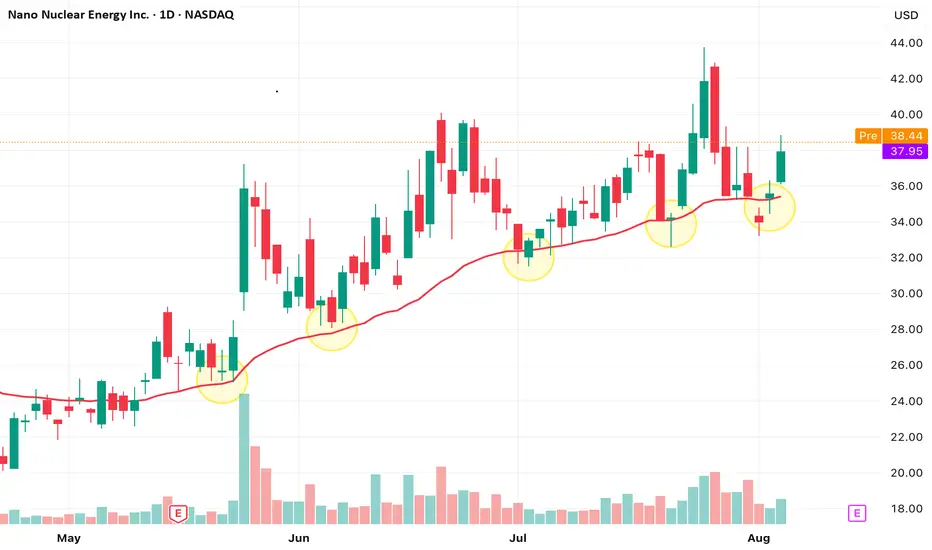
NASDAQ: NNE - Bouncing Off the Strong EMA 30?Nano Nuclear Energy - Price is retesting the EMA 30 after a sharp rally—will it hold as dynamic support and fuel the next leg up?
Technical Breakdown (Smart Money Concepts-Based)📊 Technical Breakdown (Smart Money Concepts-Based):
🔹 Market Structure:
Multiple Break of Structure (BOS) signals show a bullish shift in momentum, especially after the recent CHoCH followed by BOS at the current price zone.
Strong bullish confirmation after reclaiming previous liquidity zones, indicating institutional interest.
🔹 Liquidity and Zones:
Buy-Side Liquidity above $3,420 is likely the short-term institutional target.
Price has clearly reacted from a strong support block near the $3,260–$3,280 area, confirming demand and institutional accumulation.
The highlighted Bullish FVG (Fair Value Gap) aligns with a mid-level retracement zone—ideal for potential pullbacks before continuation.
🔹 Key Supply & Demand:
Resistance Zone (3,420–3,450): Contains weak highs and unmitigated FVG—prime liquidity zone for a sweep.
Strong Demand Zone: Around $3,260 has shown repeated reaction; the base of bullish moves.
Imbalance Fill & Rejection Expected in FVG near $3,420.
🔮 Projection & Scenario:
Expected pullback toward $3,340–$3,350, followed by bullish continuation.
Targeting liquidity sweep at $3,420, aligned with Smart Money accumulation and distribution logic.
Monitor for reaction at $3,420 for either a rejection or a clean breakout, confirming further upside.
✅ Conclusion:
This setup suggests institutional buy-side pressure with targets on resting liquidity around $3,420. Smart Money is likely driving price toward that level to grab orders before the next big move.
USDCAD Daily AnalysisUSDCAD has recently completed a clean 5-wave Elliott Wave decline, reaching a significant low at 1.3540 on June 16, 2025. This low marks the end of the bearish cycle, followed by an accumulation phase. During this phase, price formed a triple bottom pattern, confirming strong demand around the 1.3540–1.3560 zone.
The breakout above the neckline confirms this reversal pattern, and price is now retesting the previous resistance zone (1.3750–1.3770), which has turned into support.
The pair is also trading above the 21-period EMA, reinforcing the bullish momentum.
Elliott Wave & Structure Outlook
Elliott Wave count shows a completed 1–5 bearish wave, followed by a corrective bullish structure in progress.
Wave A of the corrective move has likely completed, and Wave B retracement is underway.
A continuation toward Wave C is expected, targeting the 1.4180–1.4300 resistance area, aligning with prior major supply zones.
Trade Plan
Buy Entry Zone: 1.3750 – 1.3700
Stop Loss: 1.3560 (below structure support and trendline)
Take Profit Targets:
🎯 TP1: 1.4000
🎯 TP2: 1.4180
🎯 TP3: 1.4300
USDCAD has shifted from a prolonged bearish trend into a bullish corrective phase. A successful retest of the breakout zone offers a high-probability long trade setup. Breakout and continuation toward 1.4180–1.4300 aligns with wave theory and technical resistance zones.

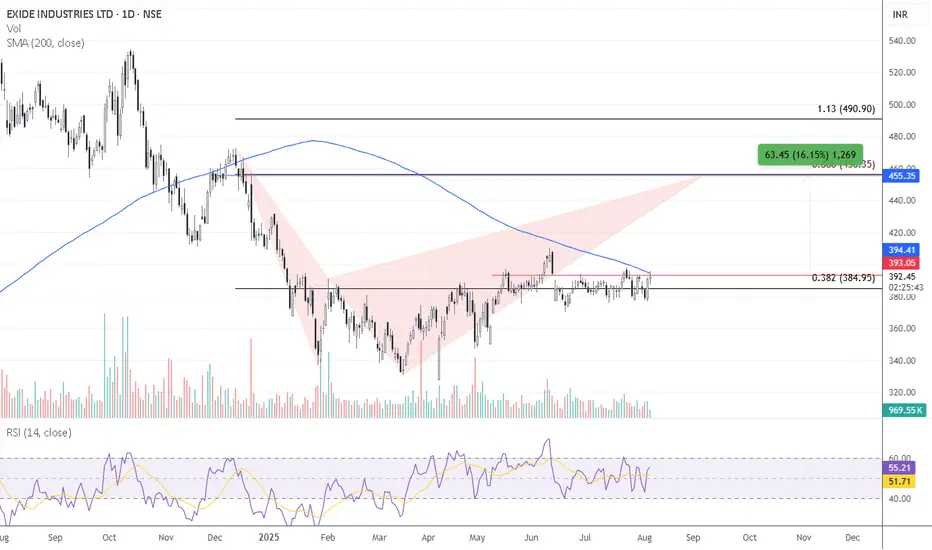
Exide Ltd is currently trading near its 200-day moving averageExide Ltd – Technical Outlook
Exide Ltd is currently trading near its 200-day moving average, which is acting as a key resistance level. A decisive breakout above this level could trigger a positional upmove of approximately 15%, making it a strong candidate for a medium-term long trade.
Additionally, the stock has been consolidating within a narrow 5% range, indicating a phase of accumulation. A breakout from this sideways range could present a short-term swing trading opportunity.
Actionable Insight:
Keep Exide Ltd on your watchlist for both positional and swing long trades, contingent on a breakout above key resistance levels.
SOLUSDT 1D - Bulls back in control with Golden Cross and channelOn the daily chart, SOLUSDT is forming a bullish continuation structure. After the Golden Cross (MA50 crossing MA200), the price is now pulling back toward the midline of the ascending channel and the 0.5 Fibonacci level at 166.38. This confluence with the broken trendline and 200 EMA makes this zone a prime technical area of interest.
Support: 166.38 (0.5 Fibo), EMA200 (161.77), broken trendline
Resistance: 182.84–189.67 (Fibo 0.705–0.79), 206.54, target - 255.93 (Fibo 1.618)
This retracement looks healthy, supported by higher volume during the prior bullish leg. As long as the 166.38–161.77 zone holds, continuation toward 206.54 and potentially 255.93 is on the table.
Fundamentally, Solana remains a key L1 narrative with strong traction in DePIN and AI-linked dApps. The rising TVL and investor sentiment support the trend.
Watch price action around 166 for confirmation - this is the battleground.

MRPL, Bullish Momentum, Large Volumes, Long, 1DMRPL is showing very Bullish momentum with large volumes. If it breaks 160 with Bullish candlesticks then enter in the trade for the target of 170 and 180.
Entry: 160 (only on Bullish CandleStick)
Target1: 170
Target2: 180.

NZDJPY Long Setup: Institutional Flow Signals Upside to 89.690🗓 Seasonal Outlook
- JPY Seasonal Weakness: Historical trends show July and August tend to be bearish months for the Japanese Yen, reinforcing weakness across JPY pairs.
- NZD Seasonal Strength: July typically supports bullish momentum for NZD, while August may present challenges. However, strength in NZD versus relative JPY softness suggests continued upside potential into early August.
💼 Institutional Positioning (COT Analysis)
- JPY: Commercial traders remain net short, suggesting expectations of further depreciation.
- NZD: Also shows commercial net shorts, yet the price structure aligns more with bullish continuation, hinting at speculative flow favoring NZD upside.
🧠 Technical Analysis
- Liquidity Dynamics:
- Price has cleared multiple buy-side liquidity levels near prior swing highs.
- Sell-side zones continue to hold, indicating strong bullish intent and failed bearish follow-through.
- Market Structure:
- Higher lows and sustained bullish reactions post-liquidity sweeps reinforce an upward trajectory.
- Current structure suggests accumulation and breakout patterns toward the proposed target.
🎯 Target Projection: 89.690

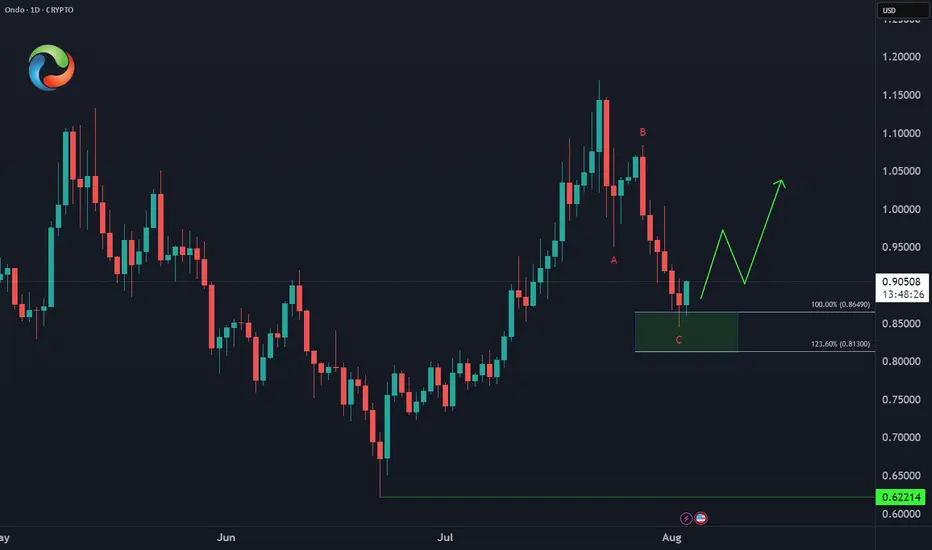
ONDO Ending Correction – What’s Next?🚀 CRYPTO:ONDOUSD completed a 3-wave pullback into the equal legs zone at $0.86–$0.81, signaling a potential bottom. A reaction higher is expected next week, and a break above the July peak would confirm bullish continuation toward $1.39 - $1.52.
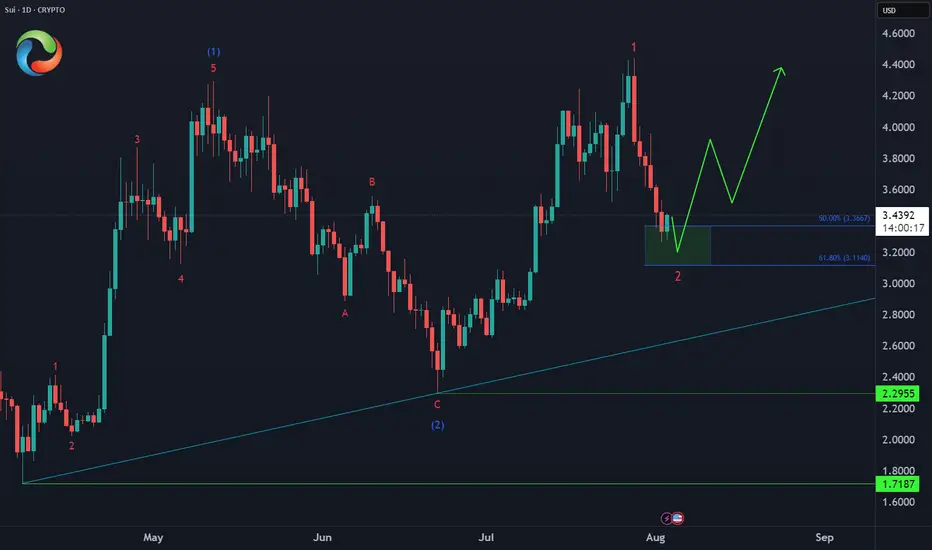
SUI Bullish Setup Ahead🚀 After breaking above its May peak, CRYPTO:SUIUSD has confirmed a higher high sequence, signaling bullish momentum. The current price action suggests it's now working on a higher low, likely forming around the 50%–61.8% Fibonacci retracement zone between $3.36 and $3.11 before resuming its rally.
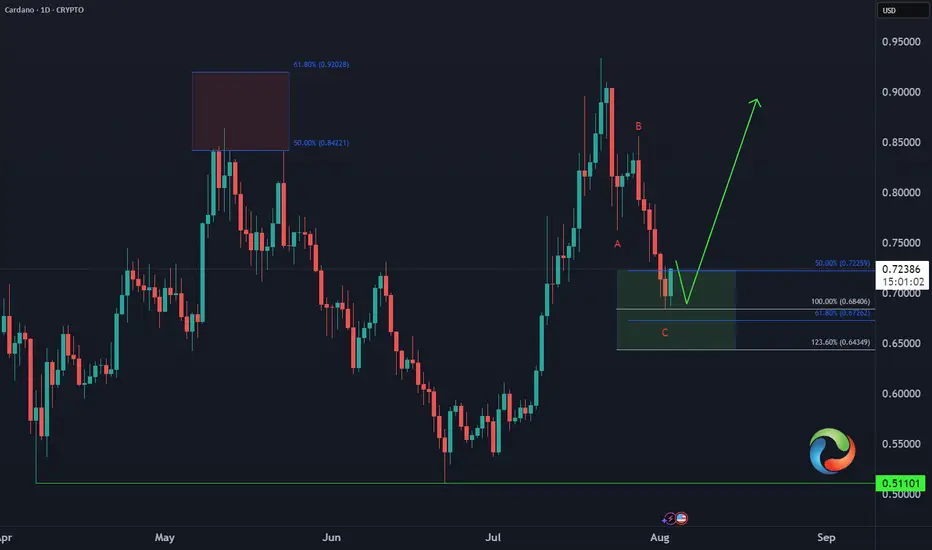
Cardano ADA Buying Opportunity📈 CRYPTO:ADAUSD has completed a 3-swing pullback against the June low and entered the extreme buy zone at $0.72–$0.64. While marginal new lows are still possible, this area aligns with Fibonacci confluence, making it a prime zone for a bullish reversal or at least a 3-wave bounce next week.
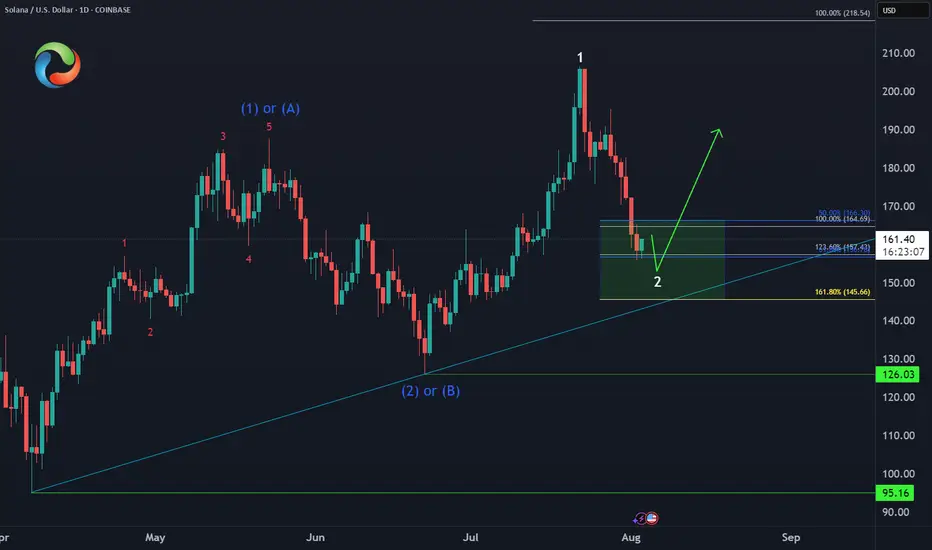
Solana SOL Extreme LevelsCRYPTO:SOLUSD Extreme Levels
50% - 61.8% Fib Ret ($166 - $156) ✅
Equal Legs area ( $164 - $145) ✅
Next Higher Target = $218 🎯
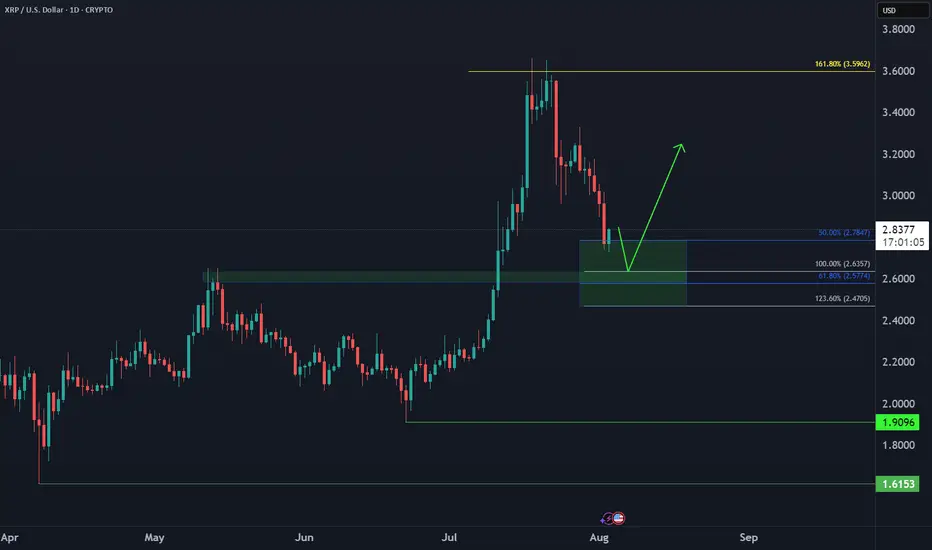
Ripple XRP Bullish Reversal📈 CRYPTO:XRPUSD dropped in 3 swings vs June low, now in buy zone $2.78–$2.47. Marginal lows still possible, but bounce expected next week from this extreme area.
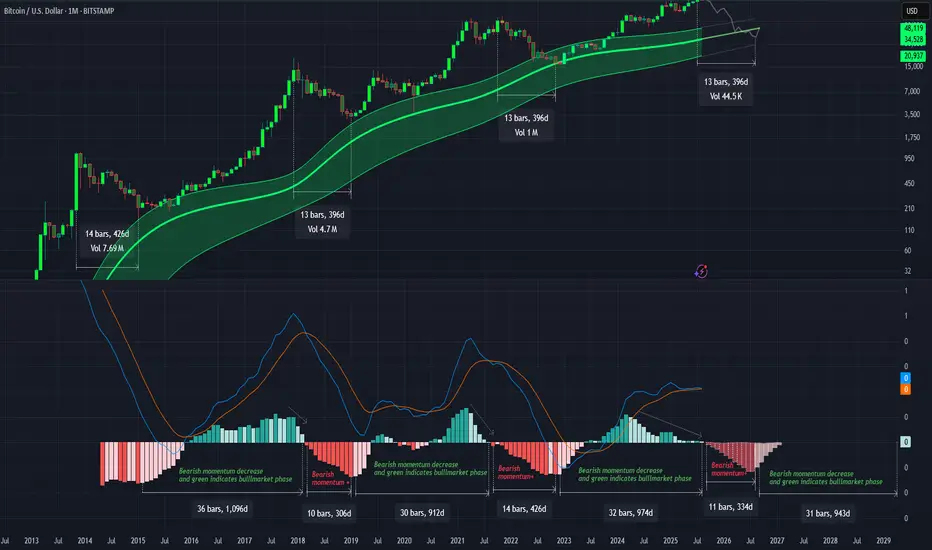
Gaussian and the LMACD deep dive!As you can see LMACD is showing signs of exhaustion. Histogram has been compressing or decreasing in momentum while the price has been climbing up. This divergence wont last for too long and a change in the trend seem very likely. BTC might be entering in the bear market pretty soon and you might start seeing the histogram turning red and increasing in bearish momentum before changing the trend once we approach to the core of the Gaussian or even bellow this time. Breaking bellow the core would mean range bellow 40k as bear market bottom.
DOTUSDTThe first higher high after a downtrend indicates a potential trend reversal to the upside. It shows that buyers are starting to regain control, signaling the possibility of a new bullish trend.
Trendline Break: A break above a significant trendline further confirms the shift in sentiment from bearish to bullish. The trendline break signifies that selling pressure has weakened, and the market is poised for further upward movement.

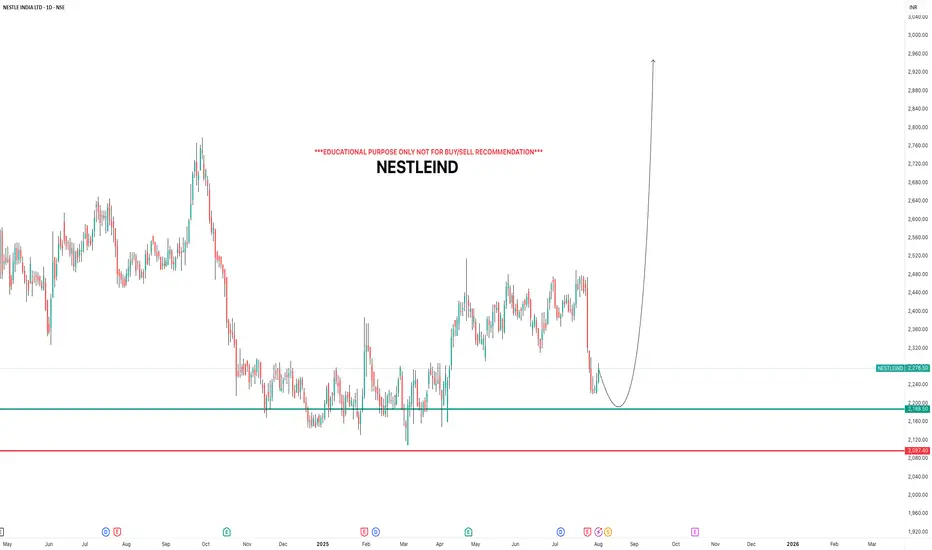
NESTLEINDIAi Observed these Levels based on Price Action and Demand & Supply which is my own Concept "PENDAM CONCEPTS"... Please don't take any trades based on this chart/post... Because this chart is for educational purpose only not for Buy or Sell Recommendation... Thank Q
BTCUSD Technical Analysis (Smart Money Concepts) BTCUSD Technical Analysis (Smart Money Concepts)
Market Structure Overview:
Break of Structure (BOS) observed multiple times confirms a strong bearish trend.
Change of Character (CHoCH) around 30th July indicated initial shift from bullish to bearish intent.
Price has been forming lower highs and lower lows, respecting the bearish structure.
Key Zones:
🔴 Previous Resistance Zone (119,000 - 120,500)
Strong supply area from where price sharply reversed.
Also aligned with a Strong High marked at ~$120,000 – key for any future bullish invalidation.
🟫 Current Target Zone – 116,000
Acts as an immediate imbalance fill/FVG retracement zone.
Target highlighted as potential retracement point before continuing lower.
🟦 Liquidity / Fair Value Gap (FVG) Zone
Located between ~115,800 and 114,500.
Price may aim to revisit this zone on pullback, filling inefficiencies.
🟩 Support Zone (~113,000)
Price currently reacting near this zone.
This area has acted as a demand zone in the past and is expected to provide short-term support.
Volume Profile & Order Flow:
Visible Range Volume Profile shows heavy activity near the resistance cluster, indicating strong distribution by institutional players.
Low volume in the FVG area further confirms inefficiency and potential for a retracement move.
Smart Money Perspective:
The current structure reflects distribution at highs, followed by markdown phase.
Price swept liquidity below local lows and may now seek to mitigate previous supply or FVG around 116,000 before resuming bearish trend.
📌 Conclusion:
Bias: Bearish until 116K is tested and rejected.
Next Move Expectation: Possible liquidity sweep → bounce to 116K → short continuation.
Invalidation Level: Break and close above 117K would signal strength returning.
✅ Educational Note:
This is a classic Smart Money trap setup — liquidity grab near lows, fakeout pump to FVG, and potential short continuation. Traders should be cautious of fake rallies into known supply zones.

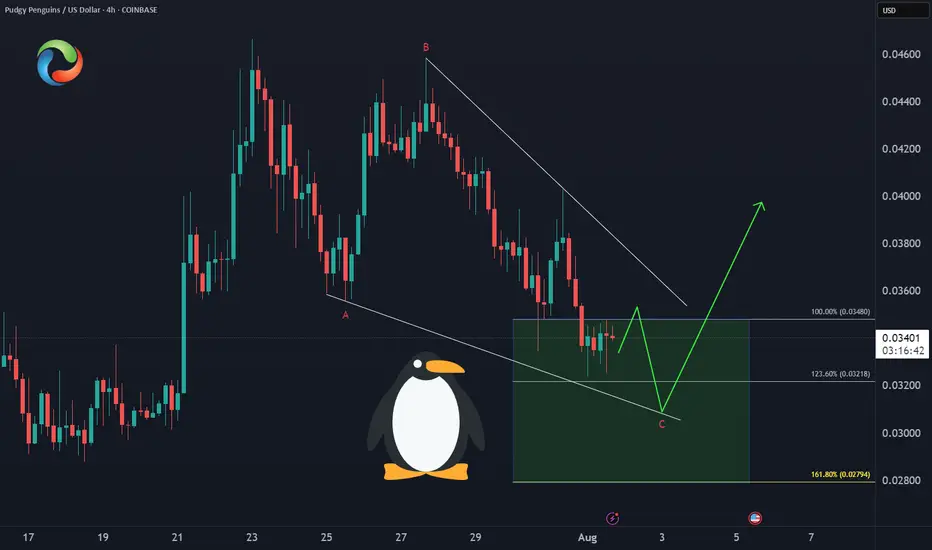
PENGU Enters Demand ZoneCOINBASE:PENGUUSD 🐧Price has developed a clean A-B-C correction into the equal legs support zone at $0.034-$0.028, offering:
✅ Optimal risk/reward entry
✅ Wave structure confirmation
✅ Higher low potential
This is the technical sweet spot for the next rally leg.
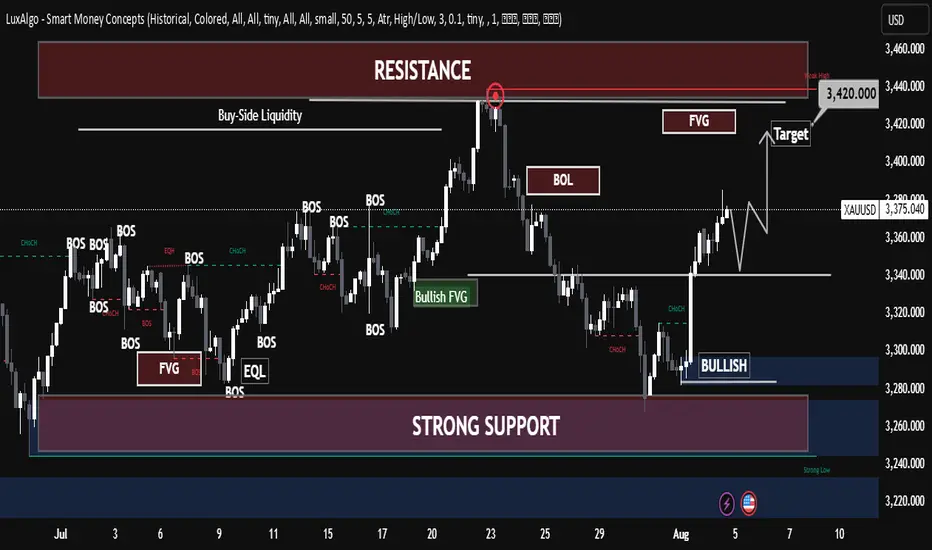
XAUUSD – Strong Bullish Reversal from Key Support XAUUSD – Strong Bullish Reversal from Key Support
Chart Summary:
Gold (XAUUSD) has shown a clear reaction from a strong support zone near 3260, suggesting bullish momentum is gaining strength. The chart highlights multiple key market structure elements and confirms the potential for a bullish move.
Technical Highlights:
🔻 Strong Support Zone (3260–3280):
Price tapped into a well-defined demand zone with historical significance, initiating a bullish response.
🔺 Resistance Zone (3460+):
A strong resistance level lies ahead. This area may act as a potential target for bulls.
🔁 Break of Structure (BOS):
Multiple BOS marks on the chart indicate trend shifts and liquidity grabs. Most recent BOS aligns with potential reversal.
💹 Bullish Fair Value Gap (FVG):
A bullish FVG near mid-structure confirms institutional interest and adds confluence to the upside move.
📈 Target: 3,366.984 USD
Marked as the next probable short-term liquidity target. If momentum sustains, price may approach resistance above this.
Price Expectation:
If the current bullish momentum holds above the strong support zone, we may see a rally towards 3,366–3,400 USD.
This move could be driven by:
Buy-side liquidity grab above prior highs
Breakout traders entering above BOS
Reaction to macroeconomic calendar (highlighted on the chart)
✅ Educational Takeaway:
This is a textbook example of:
Support-resistance flip
Liquidity concepts (Buy-Side Liquidity)
Fair Value Gaps usage
Volume Profile confluence

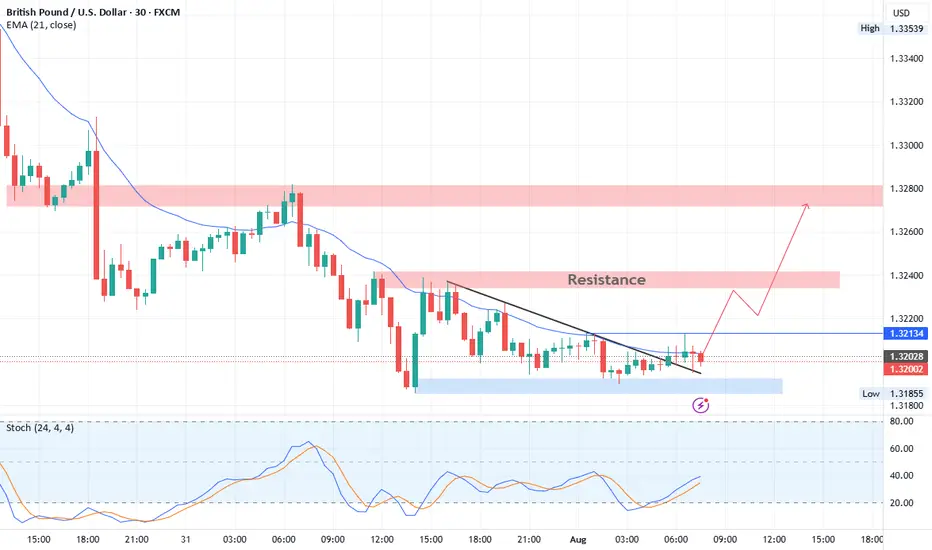
GBPUSD Technical BreakdownTrendline Breakout:
Price has decisively broken above a short-term descending trendline, signaling a potential shift in intraday momentum from bearish to bullish.
Support Zone (1.3185 – 1.3195):
This demand area has provided a strong base, with multiple successful rejections confirming buyer interest.
Resistance Levels:
Near-term resistance: 1.3213 (minor breakout level – watch for retest)
Key upside targets: 1.3240 followed by the major supply zone at 1.3275 – 1.3290
📈 Trade Outlook:
Bias: Bullish above 1.3213
Entry Idea: Look for bullish confirmation on a retest of 1.3213 as support
Targets:
TP1: 1.3240
TP2: 1.3275 – 1.3290
Invalidation: A sustained move below 1.3185 would invalidate the setup and reopen downside risk.
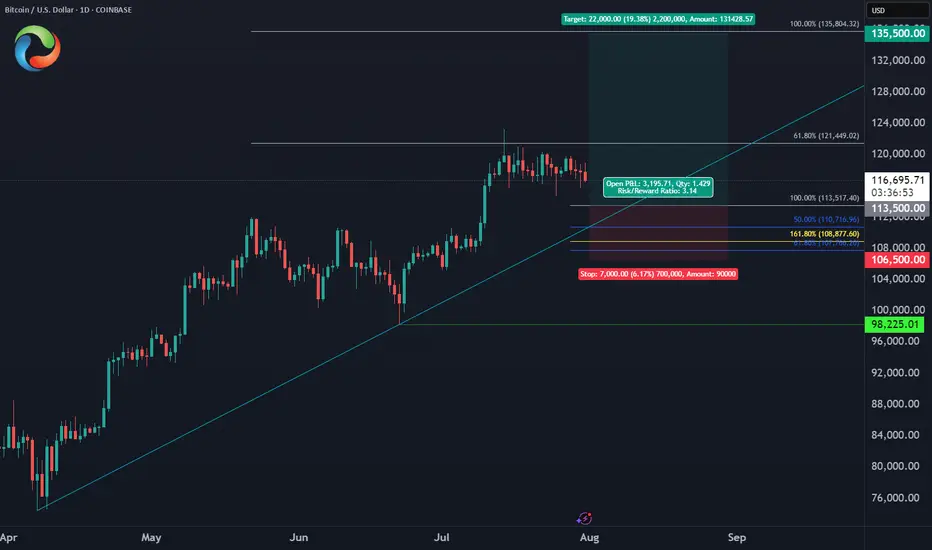
Bitcoin August Trade PlanBINANCE:BTCUSD
✅Entry Zone: $113,500 - $110,700
⛔️Stop: $106,500 (below June low)
🎯Target: $135,500 (ATH liquidity)
🔖Risk/Reward: 1:3
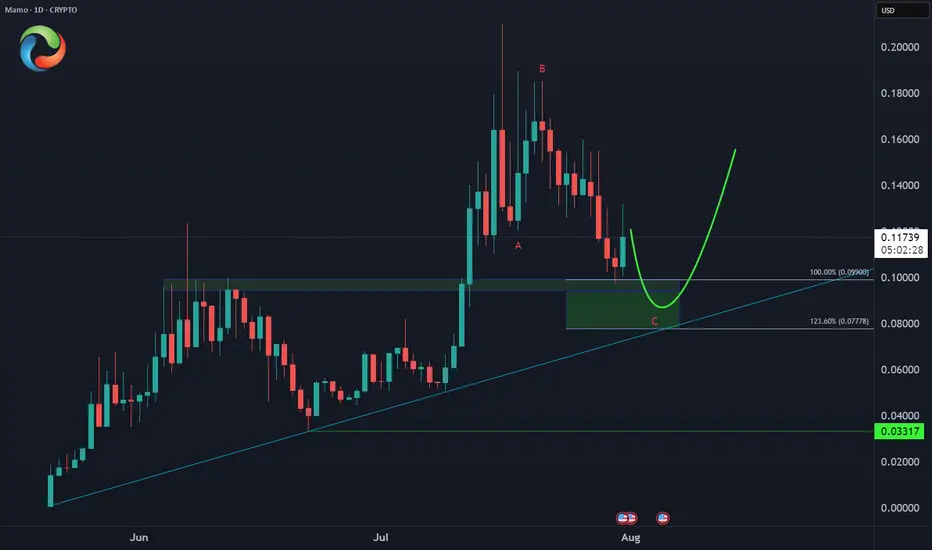
MAMO Buying Opportunity🤑 CRYPTO:MAMOUSD did 3 waves pullback into extreme area $0.099 - $0.077 and as long as it holds the trendline from May low then Bulls will be looking for more upside to take place from here!
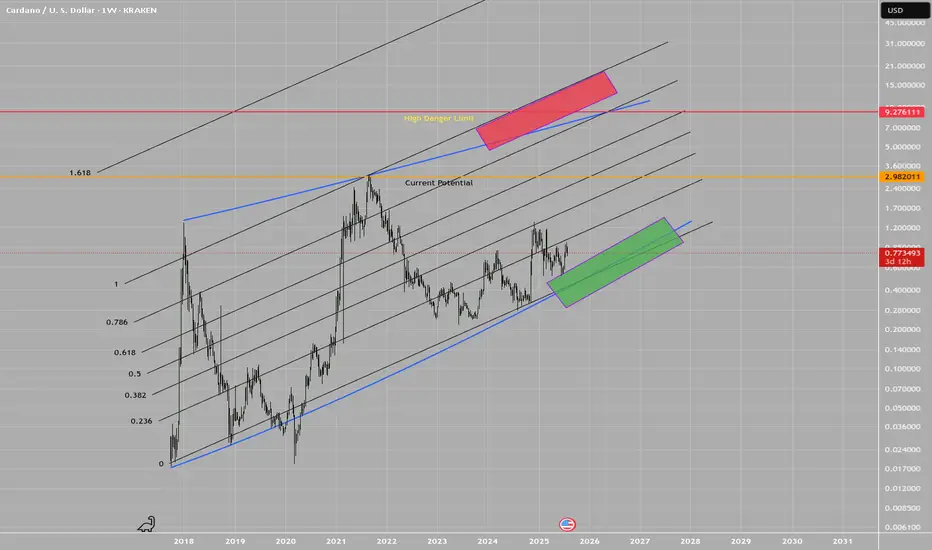
ADA, long term dubious speculationWARNING: This idea is highly dubious!
This is a logarithmic estimate of potential targets, in case Cardano moves in long logarithmic measures.
The real potential of this idea is strongly linked to the fundamentals evolution on time, i.e.: FED reducing the interest rate, for instance, but not only.
The plot features top and bottom limits drown by hand!, these are not perfect logarithmic measures, thus they certainly lacks of math accuracy. Beware.
There are zones in red and green, as transparent boxes, which depicts potential zones of buy and sell interest, of course, everything is in a log scale.
Everyone wish these kind of scenarios to be true. Only time and reality will show us the true face of it. In any case, in the total chaos of uncertainty that this market is, we try to make a sense of it.
Best of the lucks for everyone.
T.
DISCLAIMER: Do your own research! This idea is not a financial advice. All the information presented is highly speculative and cannot be taken as a reference in any circumstance.