EURCHFEURCHF is in new uptrend, as previously it was in down trend now the trend has shifted. Currently the pair is retracing at fib golden ratio which is also the previous support. Will the pair continue its upward trajectory ?
Bullishsetup

OCEANUSDT OCEANUSDT is in strong bullish momentum and seems like it is on the verge of breakout from resistance around 0.3720 region. If the instrument close above 03720 area , it will be nice buying option.

OXTUSDT OXTUSDT is in good bullish momentum, After the strong bullish impulse currently the price is retracing at support level, which seems to be a good buying area.
Will the bulls took benefits of support zone?

EURGBPEURGBP has given the breakout of important resistance zone, as it has already break through declining trendline. Bullish divergence signaling some long setup.

GNW on its path to a new highIt could be that GNW recovers quickly after the drop. If so, a new high should be expected. The company beats the EPS since 2021, every quarter. It could signal a decent business turnaround.

FTMUSDTFTMUSDT was in bearish trend and recently give breakout from falling trendline. Will the instrument continue with bullish momentum?

NIFTY 50 - DAILY TIME FRAMEThe Structure looks good to us, waiting for this instrument to correct and then give us these opportunities as shown on this instrument (Price Chart).
Note: Its my view only and its for educational purpose only. Only who has got knowledge about this strategy, will understand what to be done on this setup. its purely based on my technical analysis only (strategies). we don't focus on the short term moves, we look for only for Bullish or Bearish Impulsive moves on the setups after a good price action is formed as per the strategy. we never get into corrective moves. because it will test our patience and also it will be a bullish or a bearish trap. and try trade the big moves.
we do not get into bullish or bearish traps. We anticipate and get into only big bullish or bearish moves (Impulsive Moves). Just ride the Bullish or Bearish Impulsive Move. Learn & Know the Complete Market Cycle.
Buy Low and Sell High Concept. Buy at Cheaper Price and Sell at Expensive Price.
Keep it simple, keep it Unique.
please keep your comments useful & respectful.
Thanks for your support....
Tradelikemee Academy

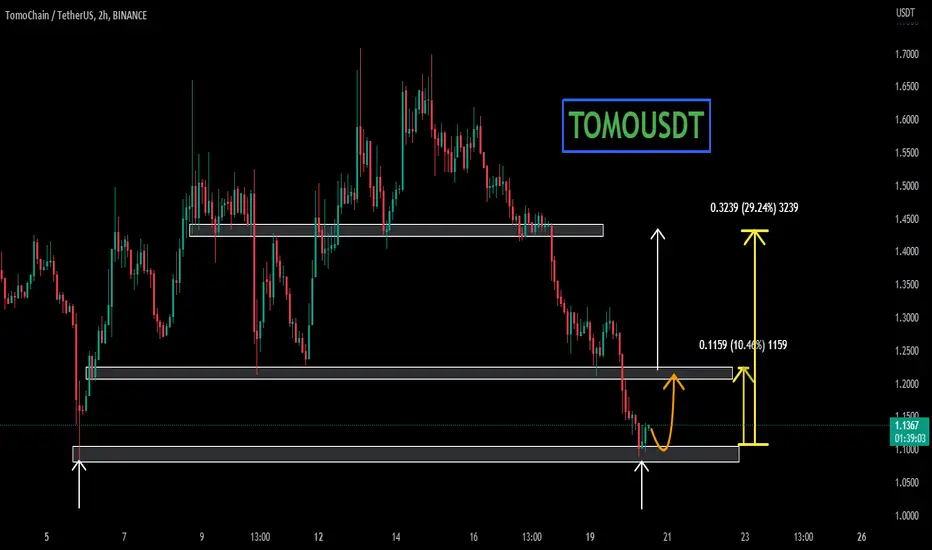
TOMOUSDTCurrently TOMOUSDT is at strong support area and has shown good reaction of this area as did in past. If it continue with this reaction then minimum of 10% followed by 30% gain is on table.
The Upcoming EUR/USD Key levels. Fiber is rallying up for buyside, we have a weekly gap acting as my main interest.

NZDJPYNZDJPY has formed inverse HnS and broke through neckline. A successful retest of neckline can push the price even higher.

XAUUSD going skyrocket soonhello everyone,
here my idea about XAU for bullish setup.
- minor touches on trendline
- I'm looking for inside bar candle breakout on H1 timeframe for confirmation.
- pullback or retest confirmation on 15/5M chart and execute position.

AUDUSDAUDUSD serge to upside and break long term resistance zone.
As the pair respecting inclining trendline, will the pair sustain inclining trendline and continue with its bullish momentum.

Alpha USDT Long Entry Chats shows a bullish signBINANCE:ALPHAUSDT.P Alpha USDT
Price Break the resistance level .11276 now retest the in 1 Hr TF. Bullish Candle in 4 Hr very good bullish sign towards price more upward direction in coming hr. Price 2 times test the .12544 Level now again test this level. If price break this level or stay above this level at least 1 day then chances move upward direction. Otherwise again tested and rejected this level again.
Now we enter the .11500 level. And tp is .12511.

Roaring to Profits: Uncover the 8.86% Upside Potential in ARRUSD
Technical Analysis:
1.The red line represents a crucial breakout point that triggers an 8.86% bull run.
2.Set your stop loss based on the demand zone of either 1 or 4-minutes intervals. If you need assistance in creating them, please direct message me.
3.Take profits by closing half of your position when reaching the orange line, and adjust your stop loss to breakeven if I haven't provided an update in the thread.
4.Close an additional 25% of your position at the blue level.
5.Remain patient for confirmation of trend continuation, which will be communicated in the thread.
Your comments and feedback greatly boost my confidence and contribute to my growth. Feel free to share your thoughts if you have a different perspective!
Cheers!!

Nifty Trade Setup (29-May-2023)This will be my personal trade Setup, This is not an advice of any kind to initiate trade according to this setup. This is for only for my learning purpose and maintaining my trading journal.
Hello everyone so as on 26-May-2023 (Friday) session when price took support at resistance level which i marked as horizontal line on 15 min TF i bought it there and stoploss was low of the hammer formed or day's low and i trailed my stoploss. It was good session and worked as per my trade setup.
( Cannot Post Previous Session Link as i am not pro member or don't have enough reputaion levels :) 😊 ... have to check previous day setup to check resistance level which became support.)
Now for my Tomorrow's trade setup from price action it is forming rising wedge pattern on Daily TF making HH's and LL's now price is at Equal of previous high and if this pattern will be respected then it will make new high touching that upper trendline of rising wedge but For price to reach there, on upside NIFTY have hurdles of 18500, 18550, then 18600 levels. On downside nearby support is 18450. For my trade setup i will look for following :
1.) If opens flat and nifty might retest nearby support of 18450 as there was rejections from day's high on previous session. If price take support there i will be looking for buying opportunities for target of 1st resistance level (18550) then for 18580.
2.) If opens gap down i will see if it takes support near 18450 if it does then will trade as per point 1 setup. If price rejects this support of 18450 then will look for shorting opportunities for target of 18400 then 18350.
3.) If opens gap up then will look for rejections from nearby resistance levels and will wait if price rejects that resistance of bulls take control of price as did in previous session and then will trade accordingly.
Things i will keep in mind:
Nifty is bullish on Higher TF. which is Primary trend and if i place trade against the primary trend i will try to follow strict stoploss and strict profit booking levels.
Hit like to keep me motivated for keeping my trading journal as it only take less then few seconds to hit like but it gives me motivation for preparing for my session. also if you can help as Trading View is holding rewards if Ideas or Script can be listed in Editor Picks :) . also one can comment how i can make it better or any improvements i can make in my trading setups or improving this journal.

Gold has Likely bottomed out for this monthI decided to go long on gold immediately after receiving a reversal candlestick at a low on top of daily support. This candle also provided bullish volume after breaking a trendline and creating a new high. Price is now on the buy side of a strong trendline as well as the buy side of a strong support. I look forward to adding an entry upon a reversal candlestick at the retest. At the end of the day we're counter trend trading NOW.

FTTUSDTFTTUSDT was trading downward direction and was respecting falling trendline. And now break through falling trendline and currently creating strong support around 1.065 region. Will it grow from this region ?

ID Ready to go currency ID It is preparing to breach the downtrend, which is expected to rise by 10% to 50%.

Sell wheat everyday 🐻🍞Who sells wheat everyday? It’s the price-reducing wheat bears who want to provide us all with a cheap basic supply of food. "Affordable wheat for all," chant they, offering reduced-price bushels of wheat to anyone who comes their way. At the moment, they are not to be restrained in their sell-off ecstasy, however, we already see the low of the blue wave (v) lying shortly before us, which means that this sell-off should soon come to its end. The wheat price is already in our green target zone here (between USX 662 and USX 472), where we expect a trend reversal. The bulls should therefore report back before too long and point to the need for higher wheat prices. It should be noted that with the end of said blue (v) wave, an overarching and relatively long-lasting correction should also come to its end. Therefore, our green highlighted target zone can serve as an excellent entry opportunity for speculations on the long side.

Go for Trident!!Why Trident ?
• daily Retracement Successfully done.
• Last swing broken
• Further breakout retracement done
• Candle breaks 20 EMA and closes above that
• Resistance trendline broken
I'm bullish on trident. Let's see what happens!
Follow me for more future updates on trident and other stocks!

Tesla Is Coming Into SupportTesla made nice and clean impulsive five-wave recovery from the lows that is now followed by a three-wave A-B-C correction, which from Elliott wave perspective suggests bigger recovery.
Tesla is now coming down into a support as mentioned few weeks back. Looks like wave C is now at the support, deeper one is 140. Invalidation level is at 102.

IEX - Towards UptrendStock has form a based at at support zone of 135-160 and can make a big move from here.
IEX - Indian Energy Exchange is looking good for an upside move CMP 160
TGT 1 196 (~25%) - Period 6 months
TGT 2 250 (~60%) - 1 Yr
TGT 301 (~90%) - 1.5 Y
Strict Stoploss 135 (~15%)
CAN BE AVEARGED In the range (135-160)

EOSTRY EOS #EOSTRY $EOS LONG UPDATEWe will see new actions after EVM lauch and new projects on EVM will fly to Eos as like Solan and Avax
