Litecoin Is Forming A Bullish PatternLitecoin with ticker LTCUSD made nice and clean five-wave recovery back to 100 area in the 4-hour chart, which confirms support in place and bullish reversal, so it can be a higher degree wave (1), thus more upside is expected for a higher degree wave (3) after current complex W-X-Y correction in wave (2) that can be in final stages. First support is here around 90-85 area, while second deeper one would be at 80 area.
Bullishsetup

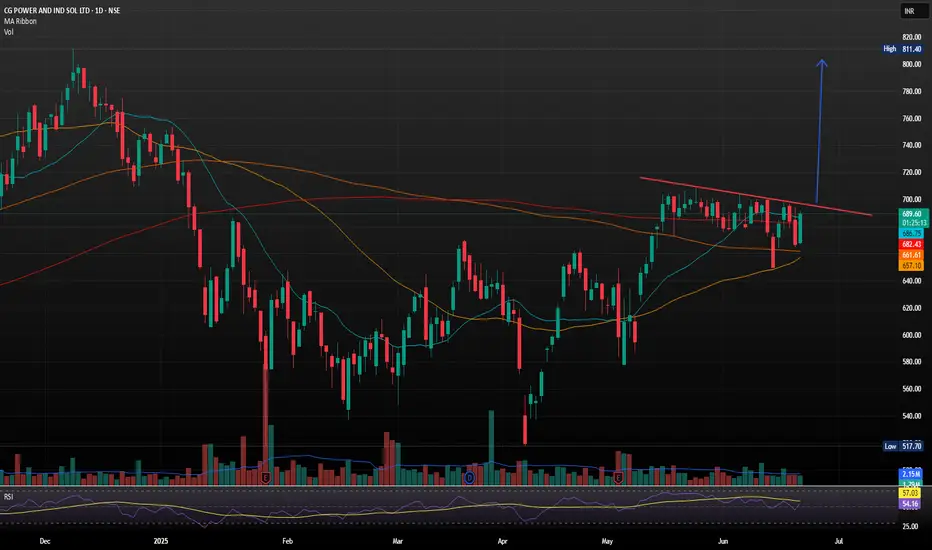
CG Power and Industrial Solutions with Strong Bullish Flag SetupCG Power and Industrial Solutions just landed its largest-ever single order a 641 crore contract from Power Grid Corporation of India Ltd (PGCIL) for high-voltage transformers and reactors
The company, now under the Murugappa Group, reported consolidated FY25 revenues of 9,909 crore. However, annual profit dipped to 972.98 crore from 1,427.61 crore in FY24, despite a strong Q4 showing with a 17% YoY rise in net profit to 274.26 crore.
- Inverse Head & Shoulders Breakout: The stock recently broke out of an inverse H&S pattern, a classic bullish reversal signal, with strong volume confirmation. Holding above 690 could push it toward 750 TO 800.
Support & Resistance Levels
- Support: 663–679 demand zone
- Resistance: 694, 704 and 712
Trend Summary
- Short-Term: Neutral to bullish
- Medium-Term: Bullish bias if it sustains above 690
- Volatility: Elevated, so expect sharp swings
EURNZD Breakout Incoming? Watch This Zone Closely!The Euro has broken out of a long-standing bearish trendline, signaling a potential shift in momentum.
🔍 Key Levels to Watch:
Resistance: 2.0000 (psychological & technical level)
Support: 1.9042
Current Price: 1.9202
What I'm Seeing:
Price has broken the descending trendline and is consolidating above support.
A successful retest of the 1.9042 support zone could trigger a bullish wave toward 2.0000.
Two scenarios to watch:
Aggressive move: Price continues upwards from current consolidation.
Retest play: Price pulls back to support, forms a higher low, and then launches.
📊 Trade Idea (Not Financial Advice):
Buy zone: 1.9050–1.9100 (upon confirmation)
Target: 2.0000
Invalidation: Clean break below 1.9000
Momentum is building, and a rally toward 2.0000 could be on the horizon. Patience is key — wait for confirmation.
What are your thoughts on EUR/NZD? Bullish or bearish?

Gold’s in a Trap — And That’s Exactly Why You Should Be CarefulGold is stuck in a tight sideways range. It’s been bouncing between $3,370–$3,380 for two days now. Everyone sees it. Every trader watching gold knows this level acted as support — and judging by the candle shadows, buyers are getting aggressive here.
So if you're purely technical — yeah, looks like a solid buy right now.
But here’s the twist…
___________________________________________________________
I’m not buying.
And I’ll tell you why — because it's too obvious.
When something screams "buy" from every chart and every textbook, that’s when you pause and ask yourself:
“Am I about to walk into a classic setup… or actually catch a real move?”
Because history shows us — these textbook setups often play out like this:
Motivation → Encouragement → Payback. (See Chart 2)
It goes like this:
Price breaks a visible high or low (Motivation)
Traders jump in and get some pips(Encouragement)
Then — brutal reversal (Payback)
Only then will everything get off the ground, and it will be fast, so that the "unnecessary" passengers who were "dropped off" should not have time to return to this train. So why are they "unwanted"? Well, here's one possible answer: because retail tends to hold losing trades too long , but gets spooked early on winners. We’re wired that way.
So what happens when everyone starts booking profits after a small bounce?
You get limit sell orders piling up , slowing momentum — sometimes even flipping the trend.
And then what do big players do?
Then come back in — buying at higher levels, averaging their positions. Not the best case scenario....
Key Takeaway:
______________________
Here’s my advice — especially if you’re in this game long-term:
1. Avoid those super obvious setups everyone else is jumping into.
2. Instead of asking, "Why should I open a trade now?"
Try asking: "Why shouldn’t I open a trade now?"
p.s.
If you liked this kind of deep-dive — follow along. We don’t just read charts. We read the market behind them.
Conclusion:
_________________________
📍 Gold is testing a key zone — but don’t let the crowd pull you in.
🧠 The first quick impulse is often a trap
📈 Stay sharp, stay ahead.

USDCAD Breakout from Parallel Channel | Bullish Move Ahead?USD/CAD has just broken out of a well-respected downward parallel channel, signaling a potential trend reversal. We saw a strong bullish impulse that pushed price above the channel resistance and now appears to be consolidating just above it.
🔍 What to Watch For:
Pullback Opportunity: Price may retest the breakout zone (~1.3640–1.3660). This zone could act as new support, providing a good entry point for buyers.
Upside Target: The next major resistance sits near 1.38542, offering a potential move of over 180+ pips from current levels.
Momentum: Bullish momentum is strong, suggesting a high probability of continuation after a healthy pullback.
📈 Bullish Bias remains intact as long as price holds above the breakout zone.
📉 If price drops back inside the channel, reevaluation of the bullish outlook will be needed.
🔔 Trade Idea: Look for long opportunities on a successful retest with confirmation (bullish candlestick or volume surge).
💬 What are your thoughts on this breakout? Are you long on USD/CAD or waiting for confirmation? Let me know in the comments! 👇

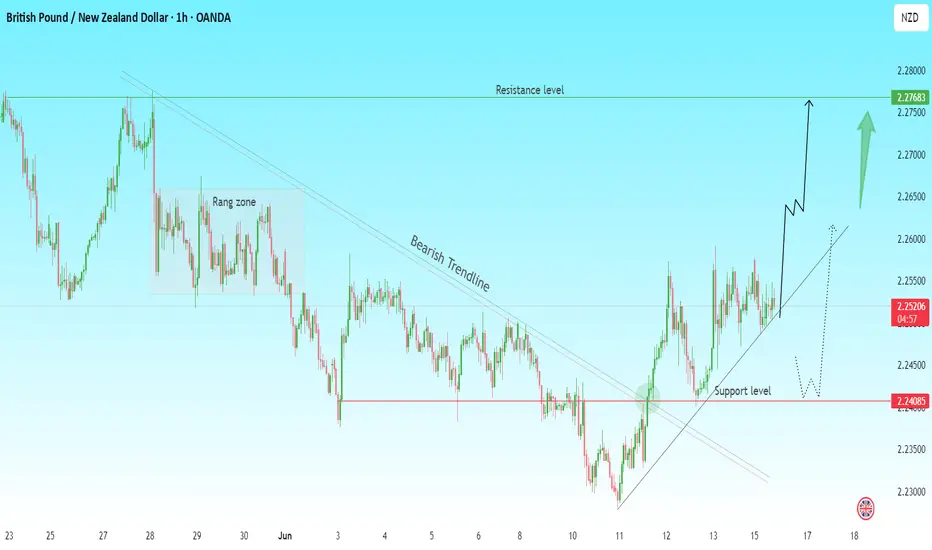
GBPNZD Analysis | Bullish Breakout in Play?📈 GBP/NZD Analysis – Bullish Breakout in Play?
Overview:
The GBP/NZD pair has broken above a long-standing bearish trendline and is currently retesting a key support level near 2.24085. This level has acted as a solid base after the price exited the previous range zone.
Technical Highlights:
✅ Bearish Trendline Breakout – The downtrend has been breached, indicating potential bullish momentum.
✅ Support Holding Strong – 2.24085 has been respected multiple times, reinforcing its importance.
✅ Higher Lows Formation – Price is forming a structure of higher lows, confirming bullish bias.
Next Resistance Target: 2.27683
Potential Scenarios:
Bullish continuation towards resistance with a breakout above 2.2600.
Possible pullback to trendline or support before resuming uptrend.
Trade Idea (Not Financial Advice):
Look for long entries on bullish confirmation above the trendline or on a pullback to support. Set TP around 2.2750 – 2.2780 zone.
Risk Management: Always use stop-loss and proper risk-to-reward ratio.
💬 What do you think? Are we heading to 2.2768 or will the support get retested again?
#GBPNZD #ForexAnalysis #TradingView #BreakoutTrade #PriceAction
XAUUSD Breakout Alert | Bullish Momentum in PlayGold has finally broken out of the consolidation zone that held price action for several weeks. The bullish trendline has acted as solid support, and now we're seeing strong momentum toward the key $3,500 resistance level.
🔍 Technical Setup:
✅ Price breakout from consolidation range
✅ Respecting a clean bullish trendline
📈 Immediate resistance at $3,490–$3,500
🔄 Potential for a retest before continuation
Strategy Insight: We may see a minor pullback to the breakout zone (~$3,400–$3,420), which could offer a solid buy-the-dip opportunity before further upside.
🎯 Bullish Targets: $3,500 and beyond
⚠ Invalidation Zone: Break below trendline
📢 Gold traders—what’s your plan? Are you in or waiting for a retest?
#XAUUSD #GoldBreakout #TechnicalAnalysis #PriceAction #ForexTrading #TrendlineSupport #TradingView

XAUUSD Technical Outlook | Bullish Setup AheadGold has been trading in a consolidation zone between ~3,300 and ~3,400 after a strong bullish impulse. The price action has respected a parallel channel, with clear resistance forming at the 3,402 level.
🔍 Key Observations:
Price is forming higher lows, showing buying pressure building up.
Resistance at 3,402 is being tested multiple times.
Break above this level could trigger a move towards 3,440+, aligning with the upper bound of the channel.
Consolidation indicates accumulation – potential for breakout.
📊 Possible Trade Setup:
✅ Breakout confirmation above 3,402
🎯 Target: 3,440
📉 Invalidated if price falls below 3,340 with strong bearish volume
Trading Tip: Always wait for breakout confirmation with volume or candle close above key levels. Manage your risk accordingly.
What’s your outlook on Gold? Bullish or bearish from here? 💬
#XAUUSD #Gold #Breakout #TechnicalAnalysis #TradingView #PriceAction

OKLO Daily Cup and HandleStrong pattern formed off a key level that could breakout in August or September. Upper price target of 90 as long as the gap is filled but not too far under


SUI is building momentum!📈 CRYPTO:SUIUSD After a three-swing corrective pullback into the $3.3 - $2.7 buying zone, price is bouncing and setting up for the next upside move.
The structure is in place—let’s see if the breakout confirms!

AUDNZD Breakout Alert | Reversal in Play?The AUD/NZD pair is showing strong bullish momentum as price has finally broken above a long-standing bearish trendline. After a period of consolidation within a descending triangle, bulls have managed to push price above the resistance zone, signaling a potential trend reversal.
Key Observations:
🔹 Bearish Trendline Broken – Indicates a shift in momentum from sellers to buyers.
🔹 Resistance Level Target: 1.09216 – This level aligns with previous supply zones and is a key target for bulls.
🔹 Retest in Progress? – Watch for a possible retest of the breakout zone around 1.0780–1.0800. Confirmation here could offer a great long entry.
🔹 Bullish Projection – If the retest holds, price could rally aggressively toward the 1.09200 level in the coming sessions.
Trading Plan:
✅ Buy on retest confirmation of the broken trendline.
🛑 Stop-loss below the breakout zone (around 1.0760).
🎯 Target: 1.09216 (next major resistance).
💬 Let me know in the comments: Are you buying AUD/NZD or waiting for confirmation?
#AUDNZD #ForexTrading #Breakout #TrendReversal #TechnicalAnalysis #PriceAction #TradingView

FLOKI Correction Complete & Ready to Rally!📊 CRYPTO:FLOKIUSD found strong buying interest in the blue box area at $0.000083 - $0.000074, setting the stage for a trend continuation to the upside.
🚀 Will momentum push it toward new highs?

ChainLink LINK gearing up for a move back toward $20CRYPTO:LINKUSD found strong buyers in the $14 - $12 equal legs zone after a three #elliottwave pullback, setting the stage for the next upside push.
Momentum is shifting—are you ready for the breakout?

IRB INFRA: Cup & Consolidation Breakout🔍 Chart Analysis
The stock formed a textbook cup pattern, indicating accumulation after a long downtrend and also given 200 EMA breakout.
After forming the rounded base, it entered a tight consolidation range (highlighted in blue).
Today, the stock broke out of this range with strong bullish momentum and rising volume.
Immediate support lies at ₹49.25, the base of the consolidation box.
Next major hurdle: Strong resistance at ₹60.52, which aligns with a previous swing top.
📈 Why This Setup Looks Promising
Cup and handle patterns often precede major upward moves, especially when breakouts happen with volume.
Breakout from consolidation confirms bullish interest near ₹53 zone.
The stock has already corrected about 47% from its all-time high, offering a potential value opportunity if trend reversal sustains.
🎯 Levels to Watch
Support: ₹49.25
Resistance: ₹60.52
Breakout Confirmation Zone: ₹53.00–₹54.00
⚠️ Disclaimer
This is not investment advice. Please do your own research or consult your financial advisor before taking any position. The market is subject to risk and uncertainty.

SPX6900 - Time to Get Aggressive and Flip SPX🔥 CRYPTO:SPX6USD With a new ATH on the horizon, wave (3) is eyeing $2.4 - $3.1 as the next target. But this is just the start, momentum is building and summer volatility could push prices even higher!

KAITO is setting up for its next 2x move!📈 BINANCE:KAITOUSDT Found strong buying interest in the #BlueBox zone and now it's gearing up for a potential 100% rally.
🚀 Targeting $3.3 - $4.3 as momentum builds.
Did you catch the dip, or are you waiting for confirmation?

Pudgy Penguins PENGU Gearing Up for a +100% Move! 🐧 BINANCE:PENGUUSDT has completed its 5-wave advance from the April low (wave 1) and corrected with a 3-wave Zigzag structure in wave (2), reaching the buying area at equal legs $0.009 - $0.008.
🚀 Now, it's setting up for wave (3) higher, with an initial target at $0.022.
🌊 Are you positioned to catch the next wave higher?

Exploring Bullish Targets for Hyperliquid HYPE🚀 BINANCEUS:HYPEUSD has surged into a new ATH and the most bullish scenario suggests a nest structure forming.
🎯 This setup could lead to an extension beyond the 1.618 Fib level at $66, opening the door for +$100 range in the coming months.
Are you positioned for this breakout? What’s your personal target for this cycle?

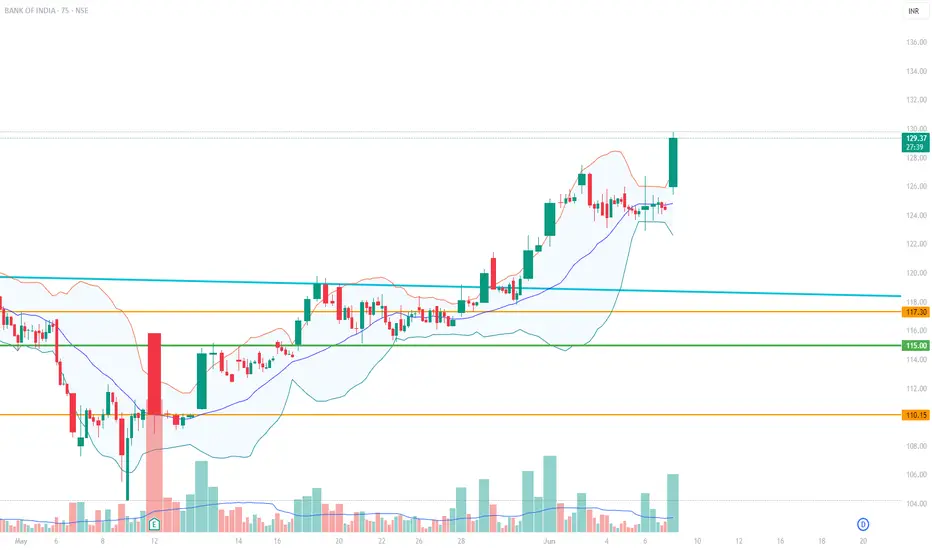
BANKINDIABANKINDIA – STRONG BREAKOUT ALERT!
The stock has given a decisive breakout on both daily and weekly timeframes, backed by strong price action. After a period of tight consolidation on smaller timeframes, BANKINDIA is showing clear signs of resuming its upward trajectory.
🔹 Risk–Reward Setup:
Risk: ~4%
Potential Upside: ~10%
The setup looks promising for momentum traders and positional players.
📌 Disclaimer: All posts are intended purely for educational and study purposes. Please consult your financial advisor before making any investment decisions. ⚠️
Making HH HL.
Closed at 40.45 (04-06-2025)
Making HH HL.
Bearish Divergence played well &
dragged the price from 44 - 45 to around 33.
Printed HL & started moving upside.
If 45 is Crossed & Sustained, we may witness
new Highs around 55 - 57.
However this time, Stoploss should be 33.50
on Closing basis.

ABFRL at Best Support !!This is the Weekly Chart Of ABFRL .
ABFRL having good Law of Polarity at 70 range.
ABFRL having EMA support at 72 range
If this level is sustain , we may see higher price in ABFRL ||
Based on time-wise analysis, our initial expected return is 40–42%, which the stock consistently forms beyond the Law of Polarity (LOP).
Thank You !!

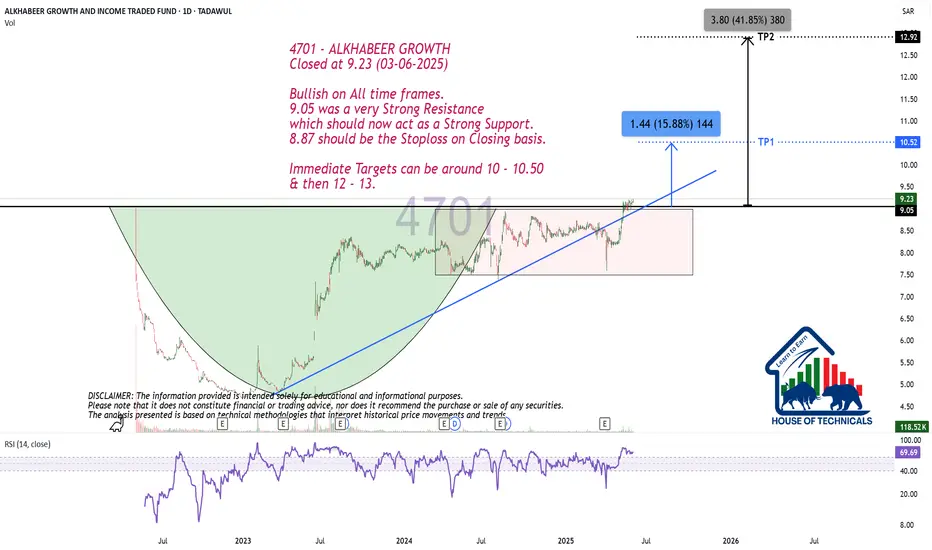
Bullish on All time frames.
Closed at 9.23 (03-06-2025)
Bullish on All time frames.
9.05 was a very Strong Resistance
which should now act as a Strong Support.
8.87 should be the Stoploss on Closing basis.
Immediate Targets can be around 10 - 10.50
& then 12 - 13.