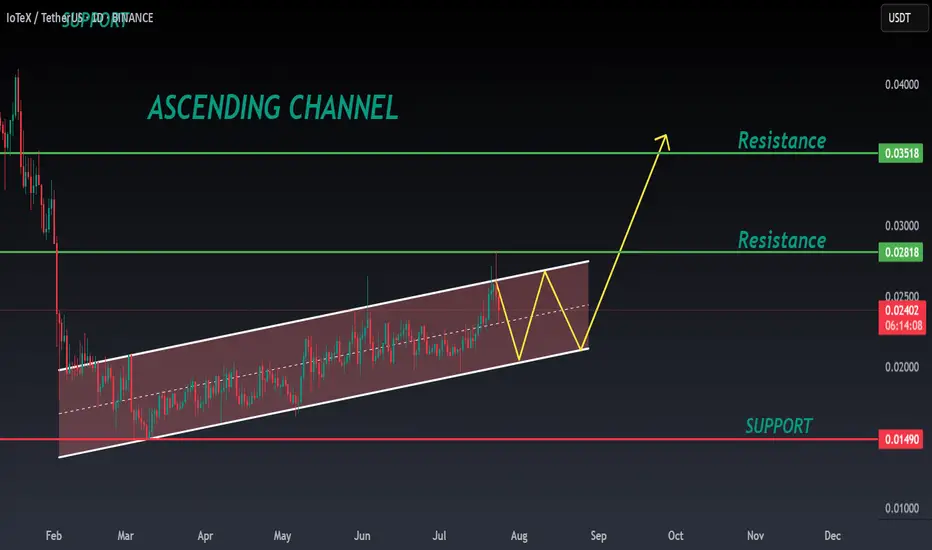
IOTX ANALYSIS🔆#IOTX Analysis : Channel Following ⛔️⛔️
As we can see that #IOTX is following ascending channel on daily time frame. We can see a bullish formation here. And if it trade with good volume then we can see a proper bullish move in #IOTX 📈📈
🔖 Current Price: $0.02400
⏳ Target Price: $0.03500
⁉️ What to do?
- Keep your eyes on the chart, observe trading volume and stay accustom to market moves.🚀💸
🏷Remember, the crypto market is dynamic in nature and changes rapidly, so always use stop loss and take proper knowledge before investments.
#IOTX #Cryptocurrency #ChartPattern #DYOR
Bullishsignal
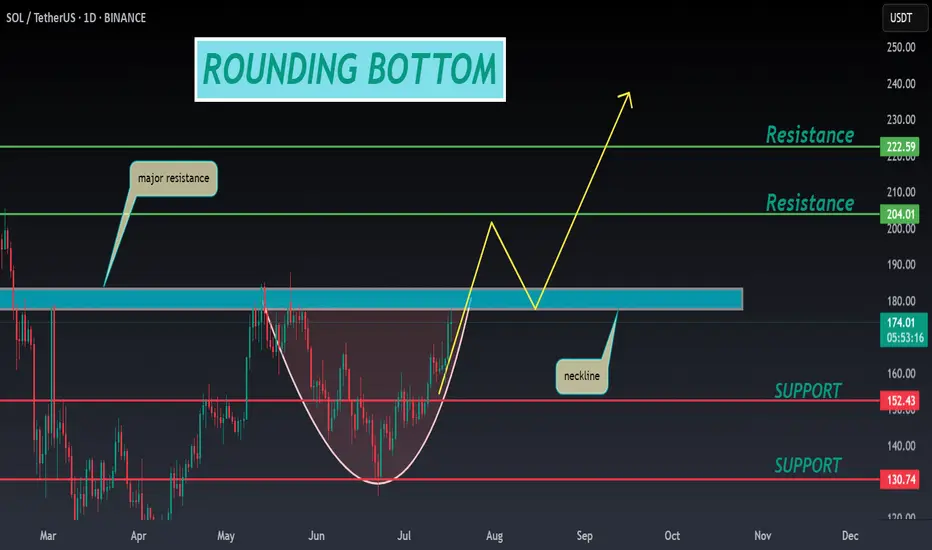
SOL ANALYSIS🔮 #SOL Analysis 💰💰
📊 #SOL is making perfect and huge rounding bottom pattern in daily time frame, indicating a potential bullish move. If #SOL retests little bit and breakout the pattern with high volume then we will get a bullish move📈
🔖 Current Price: $173.75
⏳ Target Price: $204.00
⁉️ What to do?
- We have marked crucial levels in the chart . We can trade according to the chart and make some profits. 🚀💸
#SOL #Cryptocurrency #Pump #DYOR
CRV ANALYSIS🔮 #CRV Analysis 💰💰
🌟🚀 As we can see that #CRV is trading in a symmetrical triangle and given a perfect breakout. But there is an instant resistance. If #CRV breaks the resistance 1 then we will see a good bullish move in few days . 🚀🚀
🔖 Current Price: $0.7280
⏳ Target Price: $1.0800
#CRV #Cryptocurrency #DYOR

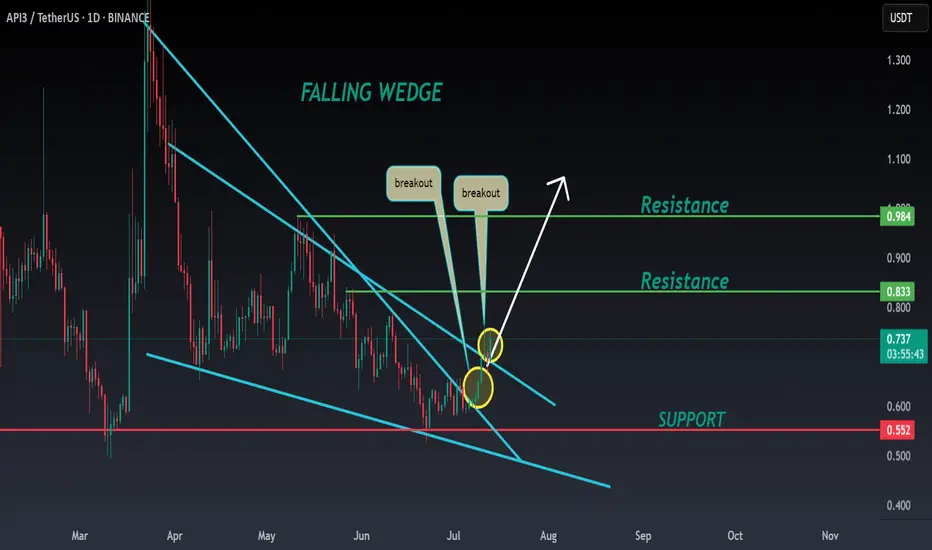
API3 ANALYSIS🚀#API3 Analysis :
🔮As we can see in the chart of #API3 that there is a formation of "Falling Wedge Pattern". In a daily timeframe #API3 broke out the pattern. Expecting a bullish move in few days if #API3 retest the levels
⚡️What to do ?
👀Keep an eye on #API3 price action. We can trade according to the chart and make some profits⚡️⚡️
#API3 #Cryptocurrency #TechnicalAnalysis #DYOR
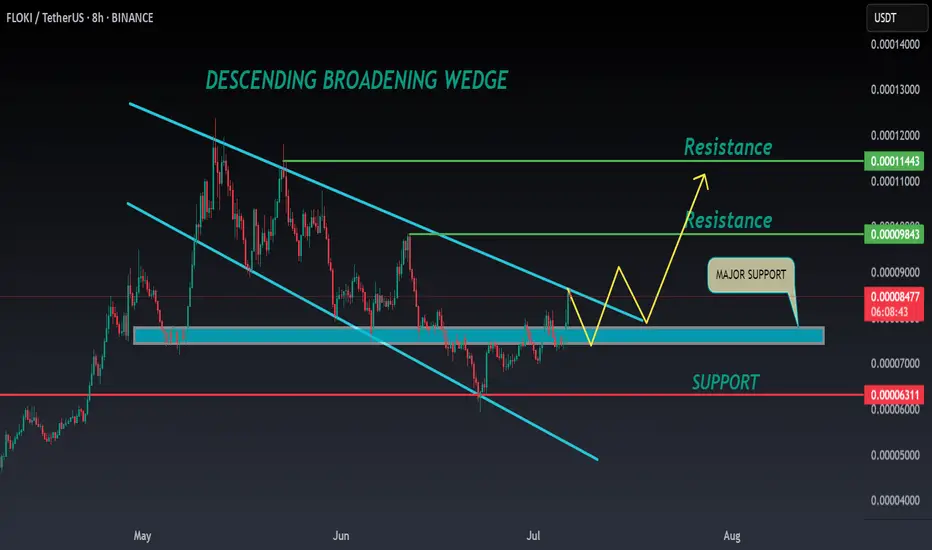
FLOKI ANALYSIS🔮 #FLOKI Analysis 🚀🚀
💲💲 #FLOKI was trading in a Descending Broadening Wedge Pattern, and trying to breakout the pattern. Also there is a instant support zone and after the breakout of resistance zone we will see a bullish move. 📈📈
💸Current Price -- $0.00008540
📈Target Price -- $0.00009840
⁉️ What to do?
- We have marked crucial levels in the chart . We can trade according to the chart and make some profits. 🚀💸
#FLOKI #Cryptocurrency #Breakout #DYOR
ETH ANALYSIS🔮 #ETH Analysis 🚀🚀
💲💲 #ETH is trading between support and resistance area. There is a potential rejection again from its resistance zone and pullback from support zone. If #ETH closes above 2500$ then we would see a bullish move
💸Current Price -- $2,462
⁉️ What to do?
- We have marked crucial levels in the chart . We can trade according to the chart and make some profits. 🚀💸
#ETH #Cryptocurrency #DYOR

TURBO ANALYSIS📊 #TURBO Analysis
✅There is a formation of Falling Wedge Pattern on daily chart and currently pullback around its major support zone🧐
Pattern signals potential bullish movement incoming after sustain above the major support zone and breaks the pattern with good volume
👀Current Price: $0.004050
🚀 Target Price: $0.004470
⚡️What to do ?
👀Keep an eye on #TURBO price action and volume. We can trade according to the chart and make some profits⚡️⚡️
#TURBO #Cryptocurrency #TechnicalAnalysis #DYOR

ONDO ANALYSIS📊 #ONDO Analysis
✅There is a formation of Descending triangle pattern on weekly chart 🧐
After a small retest towards to its support zone we would see a bullish movement
👀Current Price: $0.8820
⚡️What to do ?
👀Keep an eye on #ONDO price action and volume. We can trade according to the chart and make some profits⚡️⚡️
#ONDO #Cryptocurrency #TechnicalAnalysis #DYOR

CHZ ANALYSIS📊 #CHZ Analysis
✅There is a formation of Descending triangle pattern on weekly chart 🧐
Pattern signals potential bullish movement incoming after a breakout.
👀Current Price: $0.03818
⚡️What to do ?
👀Keep an eye on #CHZ price action and volume. We can trade according to the chart and make some profits⚡️⚡️
#CHZ #Cryptocurrency #TechnicalAnalysis #DYOR

BTC ANALYSIS🔆#BTC Analysis : Channel Following ⛔️⛔️
As we can see that #BTC is following ascending channel on 4h time frame. We can see a bullish formation here. And if it trade with good volume then we can see a proper bullish move in #BTC
🔖 Current Price: $108700
⏳ Target Price: $115300
⁉️ What to do?
- Keep your eyes on the chart, observe trading volume and stay accustom to market moves.🚀💸
#BTC #Cryptocurrency #ChartPattern #DYOR

ETH ANALYSIS📊 #ETH Analysis
✅There is a formation of Falling Wedge Pattern on daily chart and currently trading around its major support zone🧐
Pattern signals potential bullish movement incoming after sustain above the major support zone
👀Current Price: $2380
🚀 Target Price: $2785
⚡️What to do ?
👀Keep an eye on #ETH price action and volume. We can trade according to the chart and make some profits⚡️⚡️
#ETH #Cryptocurrency #TechnicalAnalysis #DYOR

OG ANALYSIS📊 #OG Analysis
✅There is a formation of Descending Channel Pattern in daily time frame in #OG .
Also there is a perfect breakout and retest. Now we can expect a bullish move. If the price successful retest the major support zone then we will see more bullish move
👀Current Price: $5.226
🎯 Target Price : $6.152
⚡️What to do ?
👀Keep an eye on #OG price action and volume. We can trade according to the chart and make some profits⚡️⚡️
#OG #Cryptocurrency #Breakout #TechnicalAnalysis #DYOR

ENS ANALYSIS📊 #ENS Analysis
✅There is a formation of Falling Wedge Pattern on 12 hr chart and currently trading around its major support zone🧐
Pattern signals potential bullish movement incoming after the breakout of resistance 1
👀Current Price: $22.58
🚀 Target Price: $31.29
⚡️What to do ?
👀Keep an eye on #ENS price action and volume. We can trade according to the chart and make some profits⚡️⚡️
#ENS #Cryptocurrency #TechnicalAnalysis #DYOR

DEXE ANALYSIS📊 #DEXE Analysis
✅There is a formation of Descending triangle pattern on daily chart 🧐
Pattern signals potential bullish movement incoming after a breakout.
👀Current Price: $14.68
🚀 Target Price: $18.50
⚡️What to do ?
👀Keep an eye on #DEXE price action and volume. We can trade according to the chart and make some profits⚡️⚡️
#DEXE #Cryptocurrency #TechnicalAnalysis #DYOR

CYBER ANALYSIS🚀#CYBER Analysis : Pattern Formation
🔮As we can see in the chart of #CYBER that there is a formation Inverse Head And Shoulder Pattern and it's a bullish pattern. If the candle breaks and sustain above the neckline then a bullish move could be confirmed✅
🔰Current Price: $1.290
⚡️What to do ?
👀Keep an eye on #CYBER price action. We can trade according to the chart and make some profits⚡️⚡️
#CYBER #Cryptocurrency #TechnicalAnalysis #DYOR

TURBO ANALYSIS🔆#TURBO Analysis : Channel Following ⛔️⛔️
As we can see that #TURBO is following ascending channel on 4h time frame. We can see a bullish formation here. And if it trade with good volume then we can see a proper bullish move in #TURBO📈📈
🔖 Current Price: $0.005610
⏳️ Target Price: $0.006160
⁉️ What to do?
- Keep your eyes on the chart, observe trading volume and stay accustom to market moves.🚀💸
#TURBO #Cryptocurrency #ChartPattern #DYOR

OG ANALYSIS🔮 #OG Analysis 🚀🚀 Update
💲 #OG is trading in a Rising Broadening Wedge Pattern and currently retesting the major support zone. Now we can expect a bullish move after the retesting of support zone.
⁉️ What to do?
- We have marked crucial levels in the chart . We can trade according to the chart and make some profits. 🚀💸
#OG #Cryptocurrency #DYOR

BAT ANALYSIS🚀#BAT Analysis :
🔮As we can see in the chart of #BAT that there is a formation of "Falling Wedge Pattern". In a daily timeframe #BAT broke out the pattern. Expecting a bullish move in few days if #BAT retest the levels
⚡️What to do ?
👀Keep an eye on #BAT price action. We can trade according to the chart and make some profits⚡️⚡️
#BAT #Cryptocurrency #TechnicalAnalysis #DYOR

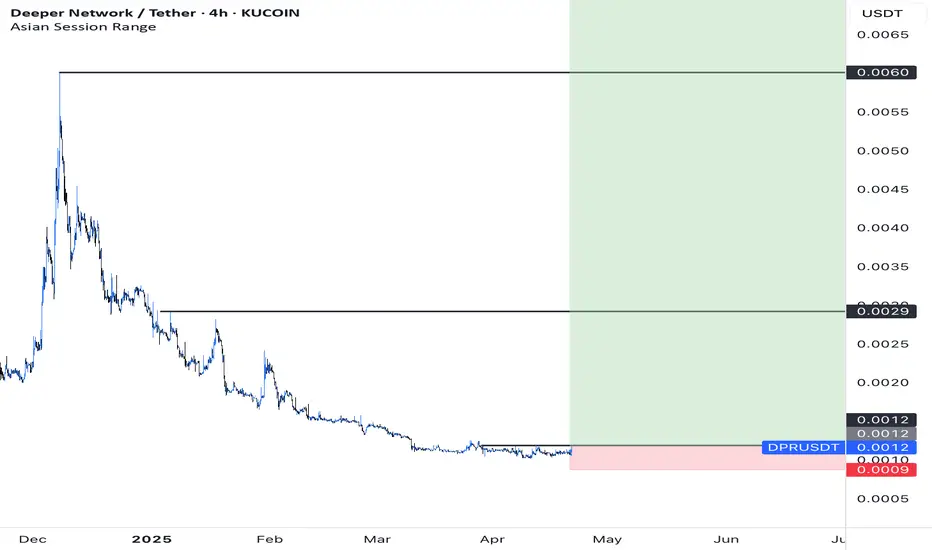
Deeper network (DPR)Perfect point to buy 1000XAll time low . most probably 100 USD can make 1 Million in a couple of months . DYOR
Wait for a Bullish Sign!Important Support Zone
166 - 184
Somewhat Bullish on Monthly TF,
But if 180 breaks,we may witness
further selling pressure.

EOS ANALYSIS📊 #EOS Analysis
✅There is a formation of Falling Wedge Pattern on daily chart with a good breakout and currently retesting the major resistance zone🧐
Pattern signals potential bullish movement incoming after a breakout of major resistance zone
👀Current Price: $0.6235
🚀 Target Price: $0.9200
⚡️What to do ?
👀Keep an eye on #EOS price action and volume. We can trade according to the chart and make some profits⚡️⚡️
#EOS #Cryptocurrency #TechnicalAnalysis #DYOR

HBAR ANALYSIS📊 #HBAR Analysis
✅There is a formation of Descending triangle pattern on weekly chart. Also #HBAR is trading around its low level. If the price sustains here and give a bullish move then we could expect a bullish move otherwise we would see more dip.
👀Current Price: $0.18230
⚡️What to do ?
👀Keep an eye on #HBAR price action and volume. We can trade according to the chart and make some profits⚡️⚡️
#HBAR #Cryptocurrency #TechnicalAnalysis #DYOR

ADA ANALYSIS🚀#ADA Analysis :
🔮As we can see in the chart of #ADA that there is a formation of Descending Channel Pattern. #ADA is consolidating in a parallel channel.... currently waiting for breakout the pattern. It is trading above its major support zone and there maybe a small retest towards support zone and after that we will see a bullish move📈📈
🔰Current Price: $0.7650
🎯 Target Price: $0.9440
⚡️What to do ?
👀Keep an eye on #ADA price action. We can trade according to the chart and make some profits⚡️⚡️
#ADA #Cryptocurrency #TechnicalAnalysis #DYOR
