EURAUD, Trend continuationPrice has made a correction and pulled back into the trendline, a continuation of the uptrend is the next.
Bullish Trend Line

DXY Targeting Liquidity Zones & Gap Fill Before Potential ReversThe U.S. Dollar Index (DXY) is showing a strong bullish push, climbing steadily along an ascending trendline. Price appears to be heading toward key liquidity levels and a visible Fair Value Gap (FVG) near the previous New York high. The chart also highlights an unfilled gap above, which aligns with a potential liquidity sweep scenario.
Once these upper zones are tapped — including the liquidity and imbalance areas — a significant rejection could follow, especially considering ongoing strength in the Euro (EUR). This setup suggests a high-probability reversal opportunity after the liquidity grab

#Cochinshipyard - Expecting 30% move from here on Stock is making higher highs
Bullish market structure 💥💥

$FET Ascending Triangle Incoming PUMP? 1 Hour Time FraNYSE:FET 1Hr Time Frame
📝 Technical Analysis:
FET is currently forming an ascending triangle pattern, a typically bullish continuation structure. This pattern is developing after a clear retest of the demand zone between $0.7038 and $0.7390, which previously acted as a strong support area.
✅ Key confirmations:
- Two clear rejections from the lower boundary of the ascending triangle, suggesting strong buying interest.
-A break of the previous bearish trendline, shifting market sentiment from bearish to neutral/bullish.
-Volume consolidation seen in the lower portion of the chart aligns with the tightening price action – often a precursor to breakout.
📊 Price Action Insights:
- The next potential retracement is expected around the Golden Pocket (0.618–0.65 Fib zone), which aligns with both the ascending triangle support line and demand zone – this confluence adds strength to the level.
- A breakout above the triangle's resistance, with confirmation, would present a long opportunity.
- Fair Value Gaps (FVGs) on the 4H timeframe are visible overhead at:
$0.7873 – $0.8061
$0.8401 – $0.8470
These serve as profit-taking targets for any bullish breakout trades.
📊 Volume Profile:
Using the anchored Volume Profile:
- High volume node is seen around $0.9141–$0.9889 – indicating historical resistance where price may slow down.
- Low volume node (volume gap) exists in the mid-region, implying a potential fast move through this zone if the triangle breaks upward.
❌ Invalidation Criteria:
This bullish setup is invalidated if:
- Price breaks below the ascending triangle support, followed by a loss of the swing low and demand zone below $0.7038.
This would likely lead to a continuation of the prior downtrend.
🧠 Conclusion:
The setup currently favors bulls, provided the ascending triangle holds. A confirmed breakout above resistance opens the path toward the identified FVG zones. However, risk management is crucial around the support area as a breakdown would negate the bullish structure.

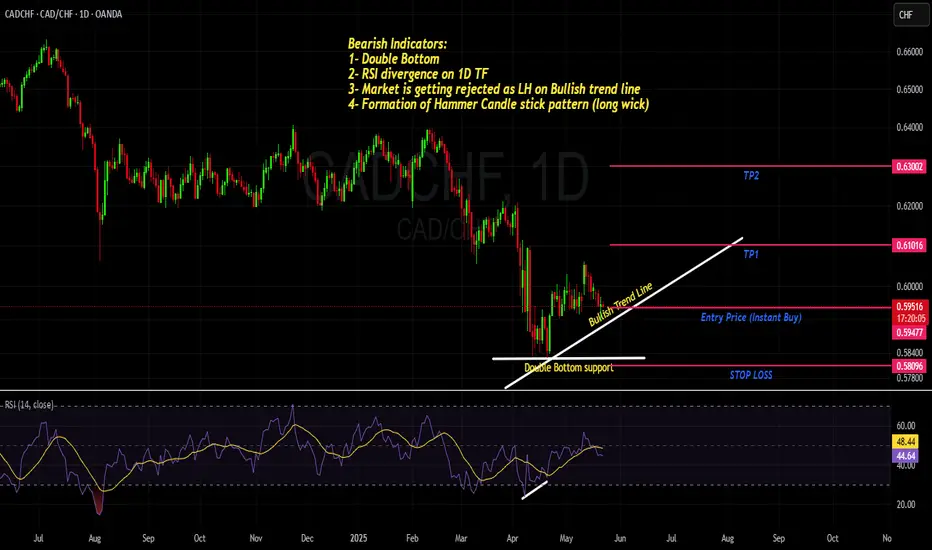
CADCHF- Another way to Look at BULLISH BIAS - 5 Strong Reasons Strong confluences on 1D time frame for the Bullish BIAS on this pair.
1- RSI divergence
2- Formation of HH and HL
3- Bullish Trend Line
4- Hammer Candle stick pattern formation
5- Double Bottom
we anticipate the market to remain in Bull phase.
Entry point is market with TP1 and TP2 as R:R of 1:1 and 1:2 respectively. Keep you Stop loss slightly below the Double Bottom (Support line)
KRDI Egypt is expected to target 0.65 then 0.75Daily chart,
the stock EGX:KRDI has been trading above a rising trend line since Oct 2024. I see the price will rebounce from the current level 0.600 to test the resistance line R1.
After crossing R1 line at around 0.650 - 0.658, the next target will be R2 (around 0.750 - 0.760).
Technical indicators: RSI and MACD still need confirmation for a new entry (buy)
Note: A Resistance level at 0.670
Consider Stop Loss below 0.600 (closing)

Road to 3200Gold had a strong 4hr timeframe rejection from the 2960-2980 zone.
Also had a triple bottom in the same area.
Showing super strong signs of another bullish run.
Gold is making the strong move up to the 3140 area once 3100 is broke.
Should get a small rejection off the 3140 zone before a strong push up to a new all time high.
Next all time high goal is 3200 🚀
Short Notes:
•Run up to 3140 (Small rejection/load up zone)
•Then Load up zone 3110-3100
•Take Profit area 3200
As always, trade safe during these high volatility times and go crush it!💰

#1000CHEEMSUSDT is setting up for a breakout Long BINANCE:1000CHEEMSUSDT.P from $0,0014000
🛡 Stop loss $0,0013740
1h Timeframe
⚡ Plan:
➡️ POC is 0,0013254
➡️ Waiting for consolidation near resistance and increased buying activity before the breakout.
➡️ Expecting an impulsive upward move as buy orders accumulate.
🎯 TP Targets:
💎 TP 1: $0.0014380
💎 TP 2: $0.0014700
🚀 BINANCE:1000CHEEMSUSDT.P is setting up for a breakout—preparing for an upward move!

#1000XUSDT is setting up for a breakout📉 Long BYBIT:1000XUSDT.P from $0,05470
🛡 Stop loss $0,05297
1h Timeframe
⚡ Plan:
➡️ POC is 0,04229
➡️ Waiting for consolidation near resistance and increased buying activity before the breakout.
➡️ Expecting an impulsive upward move as buy orders accumulate.
🎯 TP Targets:
💎 TP 1: $0,05640
💎 TP 2: $0,05775
🚀 BYBIT:1000XUSDT.P is setting up for a breakout—preparing for an upward move!

Gold (XAUUSD) Breakout Setup – Targeting $3,014Gold is showing strong bullish momentum on the 1H timeframe, forming a breakout structure with a well-defined resistance and support zone.
Key Levels:
📌 Resistance: Around $2,940 (previous rejection zone)
📌 Support: Around $2,900 (previous consolidation zone)
📌 Target: $3,014 (+3.16% move)
Technical Analysis:
🔹 Gold recently broke out of a bullish flag pattern after a strong uptrend.
🔹 Price successfully retested the support zone and is now pushing higher.
🔹 A breakout above $2,940 could trigger a sharp rally towards the $3,014 target.
🔹 Volume confirmation and strong momentum support further upside potential.
Trade Plan:
✅ Long above $2,940 with a target of $3,014
❌ Stop-loss below $2,900 to protect against fake breakouts
Gold remains bullish, and if the price holds above the breakout zone, we could see a strong move higher! 🚀

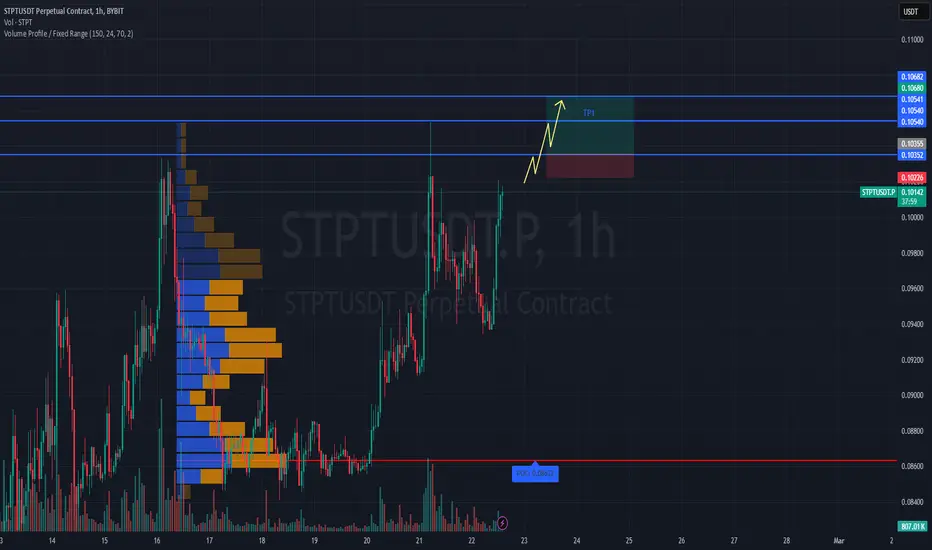
#STPTUSDT maintains bullish momentum📈 LONG BYBIT:STPTUSDT.P from $0.10355
🛡 Stop Loss: $0.10226
⏱ 1H Timeframe
✅ Overview:
➡️ BYBIT:STPTUSDT.P is showing strong bullish momentum after consolidating at lower levels, indicating buyer presence.
➡️ Volume Profile suggests that the main liquidity (POC) is positioned significantly below the current price, confirming demand dominance.
➡️ A breakout above $0.10355 and holding above this level will validate the bullish continuation.
➡️ The nearest resistance zone is between $0.10540 and $0.10680, where partial profit-taking may occur.
⚡ Plan:
➡️ Long entry upon breaking $0.10355, confirming buyer strength.
➡️ Stop-Loss at $0.10226—placed below the nearest support to minimize risk.
➡️ Main target range: $0.10540–$0.10680, where selling pressure might emerge.
🎯 TP Targets:
💎 TP 1: $0.10540
🔥 TP 2: $0.10680
🚀 BYBIT:STPTUSDT.P maintains bullish momentum — expecting further upside!
📢 BYBIT:STPTUSDT.P remains within an uptrend. If the price consolidates above $0.10355, further acceleration is expected.
📢 Volume suggests strong buyer activity, supporting the bullish outlook.
📢 However, the $0.10540–$0.10680 zone could act as a profit-taking level, so monitoring price action and partial profit-taking is advisable.
#APEUSDT remains bullish📈 LONG BYBIT:APEUSDT.P from $0.7715
🛡 Stop Loss: $0.7640
⏱ 1H Timeframe
✅ Overview:
➡️ BYBIT:APEUSDT.P is showing strong upward momentum, breaking through resistance levels and heading toward a new liquidity zone.
➡️ POC (Point of Control) at $0.6958 – a key volume area that acted as an accumulation zone before this move.
➡️ The price has broken out of consolidation and is approaching $0.7820 – $0.7910, where resistance was previously observed.
⚡ Plan:
➡️ Enter long after a breakout above $0.7715, confirming the bullish movement.
➡️ Stop Loss at $0.7640 – placed below the nearest support level.
🎯 Take Profit Targets:
💎 TP 1: $0.7820
🔥 TP 2: $0.7910
🚀 BYBIT:APEUSDT.P remains bullish – expecting further upside movement!
📢 BYBIT:APEUSDT.P is showing strength but approaching key resistance levels. At $0.7820 – $0.7910, watch for price reaction.
📢 If volumes support the breakout, further growth is likely.
📢 However, partial profit-taking is a wise approach.

GOLD 1H TRADING ANALYSIS FOR THE DAY / ALL TIME HIGHDear Traders,
Please seee our updated Analysis of the New Chart (5th February)
Key Observations
All orange circles represent previously achieved targets: Reflects accurate analysis and alignment with market conditions.
In this chart
TP1 (2817.55): Successfully hit.
TP2 (2837.03): Successfully hit.
TP3 (2856.51): Pending
Resistance Levels:
2845.42
Support Levels:
Key Support: 2812.
GOLDTURN Levels:
2837 (critical weighted level).
2828 (critical weighted level).
2817 (next major support level).
2807 - 2812 (lower demand zone).
EMA5 (Red Line):
Currently above TP2 (2837), indicating ongoing bullish momentum.
EMA5's position will be critical for determining future price action.
Recommendations
Focus on EMA5 Behavior:
Bullish Case:
* If EMA5 holds above TP2 (2837) and Goldturn 2837 provides support, bullish momentum will likely push the price higher to retest and achieve TP3 (2856.51).
* If EMA5 cross and lock above 2856, it will determine further bullish target to 2869
Bearish Case:
* If EMA5 cross and lock below 2837: Indicates bearish pressure, likely pushing the price towards Goldturn 2828.
* If EMA5 crosses and locks below Goldturn 2828: Expect further decline to:
Goldturn 2817 (strong demand zone and support).
* If EMA5 crosses and locks below Goldturn 2817 : Expect further decline to:
2807 - 2812 (key structural support).
Summary of Key Points
Holding above indicates bullish momentum with potential retest of 2856.51.
Breaking below leads to bearish targets at 2823, 2817, and 2807.
We will continue to capitalize on buying dips using our identified support levels, aiming for gains of 30 to 40 pips per trade. Consistent with our previous strategy, each of our structured levels typically provides reliable bounces ranging from 20 to 40 pips, offering steady opportunities for short-term profits.
Please show us support with likes, comments, and follow our channel. Don't forget to boost our post.
The Quantum Trading Mastery

Gold Struggles at Trendline Resistance: What’s Next?Gold Weekly Analysis
Trendline Resistance:
Gold's price has repeatedly struggled to break above the rising trendline, signaling strong resistance in this area.
Support Zone Strength:
The previous resistance zone has flipped into a solid support level, providing a safety net for any pullbacks.
Next Move:
A breakout above the trendline could trigger a strong bullish continuation.
A rejection here may lead to a pullback, with support near $2,387 acting as the critical level to monitor.

LINK on the Verge Bullish Breakout Sparks Momentum !Pattern
The chart shows a descending wedge pattern. This is generally a bullish pattern, indicating potential price reversal or breakout to the upside.
Breakout
The price has broken above the upper trendline of the wedge. This breakout is a positive signal, suggesting that bullish momentum is building.
Volume Confirmation
Check if there’s an increase in volume during the breakout. A breakout with strong volume provides confirmation.
Retest
After a breakout, it's common for the price to retest the previous resistance (now turned support). Waiting for this retest can provide a safer entry point with reduced risk.
Targets
First target: The recent swing high near $24.50.
Second target: $28.50, where there’s visible resistance.
Risk Management
Place a stop-loss below the breakout level or the lower trendline of the wedge in case the breakout fails.

DeepBook/USDT in Uptrend: Ascending Channel Holds KeyThe DEEP/USDT chart is trading in a clear ascending channel, consistently forming higher highs and higher lows.
This pattern reflects sustained bullish momentum and suggests the uptrend is likely to persist in the medium term.

Bullish Setup for Fartcoin: Watch the FVG ZoneFartcoin is trading within an ascending channel, showing a steady bullish structure. The price is currently near the fair value gap (FVG), which could act as a support zone for a potential retest before continuing upward.
A breakout above the channel's resistance may lead to a strong rally, targeting higher levels.

GOLD will rise by +300% in only 3 years! (Better than Bitcoin)I am pretty confident that GOLD will rise by +300% in price in only 3 years! Is gold a better investment than Bitcoin at this moment? Should you sell BTC and buy GOLD? Definitely yes, and I will tell you why!
Gold was in a sideways consolidation period from 2011 to 2024. And this year, in March 2024, the price finally made a strong breakout bullish candle on the monthly chart that changed everything! The big players have a lot of liquidity and then cannot move large amounts of money from one asset class to another with a single order. Also, for them, it's not best to buy all assets at the same time. In 2024, we see that big players are hugely interested in gold again, so this should be your main focus.
Why can Gold go 300% in 3 years and Bitcoin cannot? That would be around 210,000 USD per Bitcoin in 2027, and we know that this is impossible to happen as Bitcoin is statistically dropping every third year by 70% - 90%. Of course, big players are using this high volatility to buy cheap Bitcoin and to force retail investors to sell in a huge loss. They will do it again, as it's extremely profitable for them. Most likely, the price of Bitcoin in 2027 will be below 70k!
From a technical perspective, on the monthly chart we can see that the price of GOLD is inside this ascending parallel channel (since the year 2000). The probability of touching the top of the ascending channel is very high at this moment. From the Elliott Wave perspective, gold is starting an impulse wave (3)! Usually, waves 3 are the strongest! Another indication that huge news is coming for GOLD.
Let me know what you think about my analysis in the comment section, and please hit boost and follow for more ideas. Trading is not hard if you have a good coach! Thank you, and I wish you successful trades.

ATAUSDT 🥁 Rising Channel Buying Opportunity Spotted! Hey guys!
We are in a moment of volatility in the markets, either you risk and go for memes or play it safe and go for patterns that took time build and create so that it would add up extra confluence to our ideas.
1) Buy area has the BUY icon, within this area we can see a rising trendline indicated as the potential zone to buy from, everytime price falls into this range we are given a chance.
2) TARGETS would be simply the top of the channel indicated as a red trendline but I think safe target it's 0.40 so we still very early take this on.
Don't miss this chance because we are in the middle of fear and greed in the markets but remember BTC has been on an uptrend, don't be afraid to buy and hold ♥
Hope you find it useful, any questions are welcome.
Kina Tip of the Day: I suggest you go for the best ideas that make more sense for you instead of taking every single signal you see on telegram or discord. Better make your own choices with good confluence.
Keep it shiny ⭐
Kina, The Girly Trader

Market is on its Upper Band - Its 2nd Camel HumpAll the major markets are testing their upper band channels since their first major hump in the 90s.
The Russell 2000 has reached its second hump and is on the way down. Though the Russell 2000 is the least known among the four indices, it serves as a leading indicator for the other three.
Why?
The Russell 2000 comprises 2000 mid-sized listed companies, which I believe employ the largest workforce in the United States. This means their employees are also the mass consumers who use or buy products and services listed on the Nasdaq, S&P, and Dow Jones. When the Russell 2000 is not doing well, mass consumers tend to spend less, and the rest of the indices subsequently follow.
Micro E-mini Futures & Options
Ticker: MYM
Minimum fluctuation:
Outright: 1.0 index points = $0.50
Disclaimer:
• What presented here is not a recommendation, please consult your licensed broker.
• Our mission is to create lateral thinking skills for every investor and trader, knowing when to take a calculated risk with market uncertainty and a bolder risk when opportunity arises.
CME Real-time Market Data help identify trading set-ups in real-time and express my market views. If you have futures in your trading portfolio, you can check out on CME Group data plans available that suit your trading needs www.tradingview.com

possible good swing trade with small Stop Losswith the way RPG Life Sciences is its support trendline, it can be a great buy for a swing trade with targets easily reaching 1800 and 1950 after that. So the target is nearly 30% gain, then it would be advisable to keep an SL of 10% to maintain a 1:3 trade at the minimum and then it can be further trailed to 1950.

Seize the Crypto Momentum: Double Bottom Training for a Bright FAn exceptional opportunity looms on the horizon for the JUV cryptocurrency! The chart reveals a perfectly orchestrated Double Bottom formation, marking a potential bull turn. With the two troughs aligned, we hit a sturdy stand, indicating constant buying pressure.
The recent rupture of the neck line, accompanied by an increase in volume, confirms the trend. This is the critical moment when previous resistances become supports, paving the way for soaring prices. By applying W amplitude measurements from the neck line, we project bold bullish targets.

AUDJPY - 1H - Bearish Flag - Short EntryIn this chart we have observed a Bearish Flag, but we also spotted that there is a Bullish Divergence and candle sticks are making HH & HL which indicate it is a Bullish trend.
There might be a chance of UPTREND, but we are following Bearish FLAG and we have executed entry & exit points accordingly.
