GWO Double Bottom 200SMA GWO has recently passed the 200MA on the weekly chart signalling a strong reversal in the price trend from bearish to bullish. after price showed a double bottom reversal, the price rebounded to break the resistance and cross over the 200SMA indicating a strong bullish trend. Price showed a similar pattern of a double bottom reversal crossing the 200MA in late 2011/early 2012 leading to a strong rally seeing the price increase almost 50% after breaking the resistance. the price target is 45-47.50 (35%)
Bullish Trend Line

AUDUSD Sell IdeaW1 - Price is moving inside a bearish flag pattern, price reached an important resistance zone formed by the top of this pattern, 100% fibonacci expansion of the first wave we had and it is currently moving lower. Bearish hidden divergence
D1 - Price has broken below the most recent uptrend line.
H4 - We may now look for pullbacks and then sells with more bearish evidences.

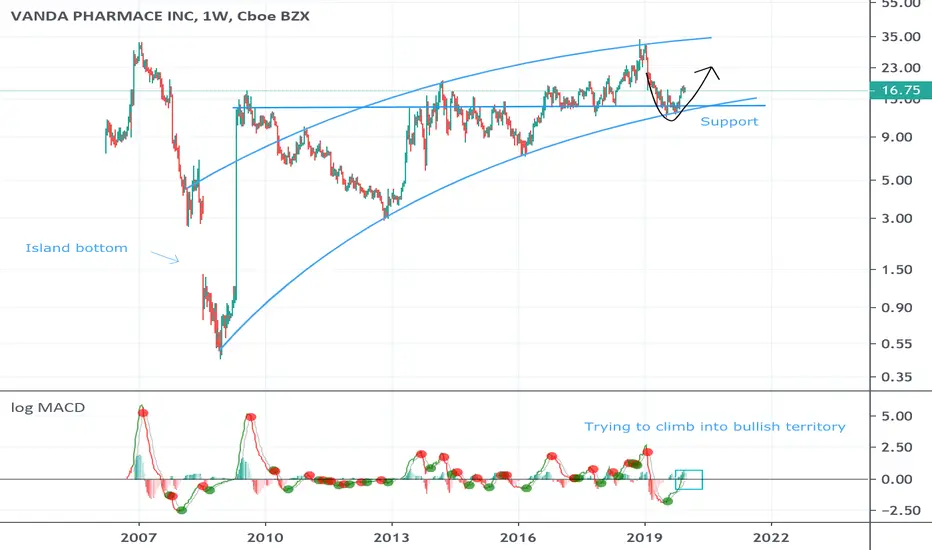
VNDA ParabolicParabolic uptrend. Bullish W formation, upsides expected if the uptrend holds. MACD can be seen to be climbing into bullish territory.
STXBTC #STXBTC #STX #BTC $BTCSTX te Bullish Kelebek formasyonu bulunmaktadir. Takip edip update yapacagim.
STX Has bullish butterfly pattern and i will follow up and update

Gold Sell IdeaD1 - Price is moving inside a falling wedge pattern.
H4 - There are two possible scenarios:
Scenario #1 - Price pushes higher, and enters the critical resistance zone that we have marked and also reaching the 100% Fibonacci expansion at 1485.22. This is where I will be looking for aggressive and conservative entries with bearish evidences.
Scenario #2 - We need the price to push lower and break the up trend line. After that we can start looking for sell entries with bearish evidences.

CMT BTC BULLISH HARMONIC BAT PATTERNCMT BTC BULLISH HARMONIC BAT PATTERN
Lets see what's going on on pattern


GBPAUD Analysis: Triangle breakoutHi traders,
The main trend for this pair is uptrend.
Rising trendline is very evident.
Price just broke a triangle pattern from the lower side.
There are high chances that due to the breakout, price may continue further downwards towards the trendline.
What are your views? Hit the like if you agree to show support.

EURAUD trading the rejection at the top of the rising wedgeEURAUD is following a rising wedge and the setup of the moving averages also show that there is an uptrend. So why am I planning a short position?
The rising wedge is still quite large and this gives the opportunity to try to find a rejection at the top of it, with a great risk to reward ratio.
Also, the moving averages are quite close to each other, so with a rejection at the top, the setup could change quite fast, so I wouldn't rely that much on that in this situation.
I structured the trade to trade the rejection at the top and also a breakout at the bottom, but I would start to take part of my profits if the price reached the bottom of the rising wedge.

MCD t.a. & set upMCD is showing signs of an overall long-term uptrend pattern, & is currently trading above the SMA200, signaling a possible long entry. On the daily chart, possible cup and handle also forming after a significant pullback occured early/mid September. Also, last session the price opened above, and closed above the EMA21, signaling a potential intermediate uptrend is likely if price continues to consistently close above EMA21 level. Additionally, The EMA5 recently crossed up & above the EMA10, signaling short term bullish momentum. Considering this combination of confirmed and pending signals:
A good entry might be; if the price breaks above and closes above the SMA50 level.
*another option could be to take an initial entry if Monday opens above the EMA21, and then add to position if price breaks/closes above the SMA50
A stop could be set at: any close below the EMA21 @ -1%
A good target exit might be best at: Known resistance @65-70 RSI area, or any close below the EMA10 level @ +4%
Risk/Reward ratio optimal @ 4:1

rising wedge for the CablePrice is approaching a trendline but we can see a MACD DIVERGENCE in H4 timeframe, if price will break the wedge I will open a sell position; great oppportunity; price could push as low as 1.2285.
Look at daily timeframe using bollinger bands; in my opinion price could reach medium band (around 1.225).
wait to open a sell order


Bullish Trendline in NANOUSD during March and April 2019During basic trading exercises I identified a bullish trendline in Nano vs Dollar, Crypto. It ocurred from March 25th to April 21th.

USDCHF Sell IdeaD1 - Currently it looks like the price is moving lower towards the dynamic support.
H4 - Price broke below the bearish flag pattern.
We may now look for pullbacks and sells with bearish evidences.

USDZAR - NeutralWith the National election that is over. ZAR could continue to strengthen against the US Dollar or weaken. It finds itself at a very important support area (14.14000) which is confirmed both with a bullish trendline and also confirmed by the 38.2% Fib levels. If this breaks ZAR could find support around 14.11000 which is the 50% Fib level. For now, we remain neutral. We will enter around late Monday afternoon and will update below. We looking at what price action and the candles will tell us. Should we go long we can expect a 400 pip move until 14.50 and beyond.

#ZILBTC #ZIL $ZIL#BTC $BTC AB=CD PATTERN PLEASE FOLLOW GREEN BARAB=CD PATTERN PLEASE FOLLOW GREEN BAR

DKS - Hammer pattern reaching supportMay 2nd: DKS reached SMA(100) support line forming a Hammer candlestick.
Technical information:
RSI(14) @39
CCI(10) @-100
Support: 32.46
Resistance: 39.4

Head & Shoulders pattern in GBPJPYIn the daily chart Pound/Yen is about to complete the triangle, so either it will continue it's bullish trend or break to the down side to complete the Head & Shoulders pattern then do the continuation to the upside
