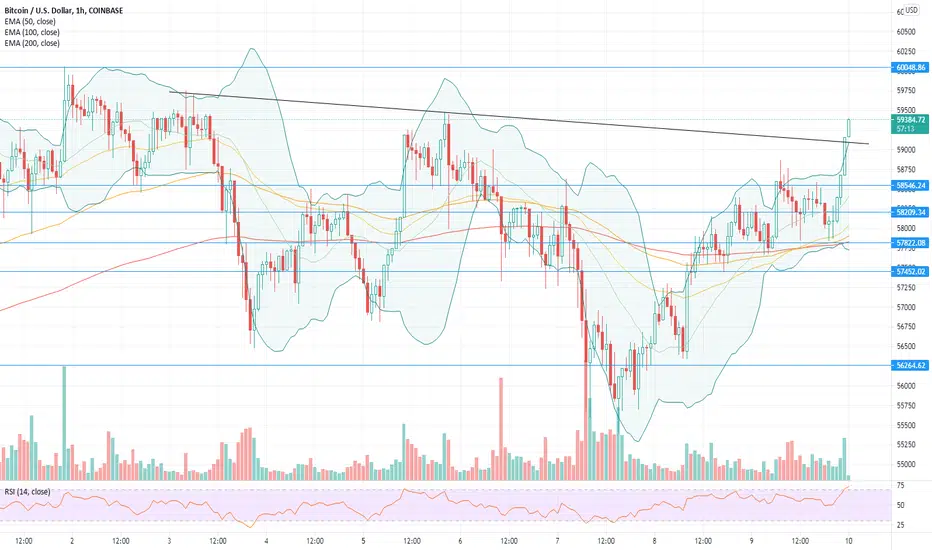
BTC Bullish Trend Line BreakLooking pretty decent, not hodling my breath for new ATHs, but it would be funny if a lot of folks were ready for "altseason" and overly divested of Bitcoin at this time...
I don't say funny because I want people to lose money, but funny because I think group-think and scripted thinking are potentially financially dangerous. Feel free to not follow me if you don't appreciate the insights.
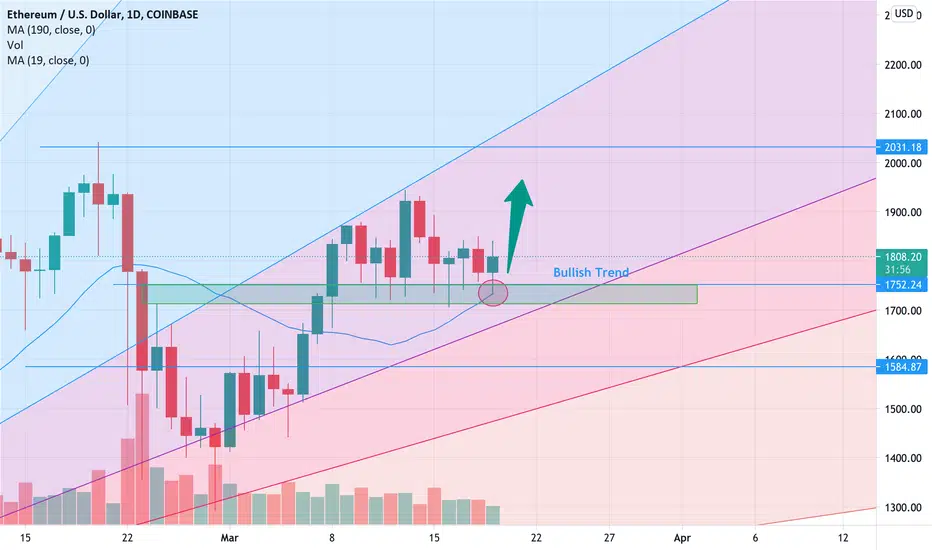
Bullish Trend Line

BTMXUSDT has nice bullish situationIf price could break out top of rising wedge it would be bullish and make 137% profits.

Gold rejected on BIG demand and BIG supportAfter 8 months of bearish trend, as you can see gold made bullish falling wedge pattern. And it has reached good support and good zone also rejected on it. What a good setup. XAUUSD is on a price which can be beginning of uptrend for next few months. And don`t forget it is an idea, not a signal. Hope you guys enjoy it.

ETHUSD market is increasing.This might be a great opportunity for crypto traders to join a very promising bullish trend.
lets rock for the next step this is an update for the last step its going to turn the MA is in a place to move forward

SPX's Since 1957 Inception's day & before 'SHOCKING STUDY'"Unbelievable results, Could that be possible. This will make All technical and wave analysis = Worthless ;-)

Elrond EGLDUSDT - Bull Flag + Elliott Wave, BREAKING OUT!- Elrond is pumping hard recent months and this trend should continue!
- As per my Elliott Wave count, i am expecting one more 5th wave to the upside.
- Out profit target can be top of the trendline, 1:1 FIB or 1:618 FIB (conservative target 0:618 FIB)
- The price is currently breaking out of the bull flag on the daily timeframe
- Expected duration of the trade, Stop Loss, Profit Target, Entry Price and Risk To Reward Ratio - for more information, please check my signature below ↓
- The blue trendline really should hold for continuation to the upside.
- If you want to see more of these ideas, hit "Like" & "Follow"!

LMND broke out from downtrend ready to retest 130$Downtrend channel broke out now ready to retest previous resistance level of 130$

NPXS/USDT TA idea for upcoming change in tokenomicsNPXS will change its tokenomics which often results into a pricespike.
We also are close to the rising supportline (violet).
Take a look at it and share your oppinion.
Enjoy the ride and don't be too greedy.
If you like the content, please like, comment and give this channel a follow.
Always do your own research and keep in mind that my charts and comments cannot be considered financial advice.
Cheers
ps.
Chart explanation:
Green lines are tested support lines.
Orange lines are resistance lines or, if we are above, possible support lines which were not tested yet.
Cyan line is for volume trendline.
Purple lines are trendlines we take a look at.
Yellow lines are for visual help only.

AVAX/USDT prediction - do not avoid the bullish trend lineDISCLAIMER: *THESE ARE MY PERSONAL PREDICTIONS, THEY SHOULD NOT BE CONSIDERED AS FINANCIAL ADVICES*
AVAX keeps it going nice and steadilly throughout a long bull trend against the USDT. Even after the Feb 4th-28th rush, the trend line(dashed blue line) successfully works as a safe harbor and support level at every bear movement.
By the APR 10th the trend seems to be carrying the price up to the 35 usd support-resistance level on which the price may go even more rapidly if it can succeeds to hold for a while.
Next Resistance : 41.52 USDt
Trend Break Down: Below 27-26 USDt
Supports: 26.52 - 21.630 USDt
If the market remains healthy this trend line working as an indicator of increasing inflation of USD, would work really well. However there might be major ups before the designated date depending on the company profile, partnerships and product's reputation.


Analytical Candlestick Patterns.Hello Guys,
As our candlesticks gives us an idea of what Is happening on the chart, us traders need the right amount of patience to wait and enter at the good point(sniper entries). Below is an idea on what the market might tend to do in the next couple of hours or days till the end of the week unless shown otherwise, candlesticks, or went against our analysis and the market tend to move in the opposite direction.
Ill also advice traders to stick to their trading plan and disciplinary actions being measured.
Enjoy trading and don't over-leverage.
!!!!!BM-FX, The Best Team For Trading!!!!

I'm definitely bullish about XPENG 🚀🚀🚀The entire world is bullish about XPENG. 🚀🐮 Don't see these black lines as precise trajectories. I don't write the future. I just respected the support and resistance areas.
You can always make money with stocks. It's never late! Don't FOMO!!
What's your opinion? Your comments are welcome.
##############
Take into account that fundamentals (news) supplement technical analysis . A trader does not use a crystal ball to predict the future (news and people's reactions). Additionally technical analysis is not an exact science. It involves a degree of subjectivity.
Legal disclaimer: I am not a financial advisor. The advice here given is not a financial advice even though my excitement might make it look like such. This account shouldn't be followed by anyone expecting something from me. You trade at your own risk and nobody can guarantee you results. Even if someone could, I don't.

$GNW entry soonentry here is possible, hold for 3.05 or 2.85; scalping at 3.18, 3.43 or 3.62 all viable into mid April convergence

LTC Bullish trendline formingWe may potentially be looking at an LTC bullish channel with price attempting a second touch at the moment. However BTC is currently indecisive and we could see some further bearish momentum on BTCUSD which will negatively affect LTC.

Binance Coin (BNB) Price Predication In this crypto daily snaps update we take a look at Binance coin BNB why has it crashed? and some potential price targets and support levels for Binance BNB coin moving forward!

APPLE (AAPL) | Channel up pattern + MA100 support+ Channel up or Rising channel or ascending channel or whatever f you call it pattern
+ Apple M1 architecture is a game changer. Watch out Microsoft
- Rising bond yields (Technology sector sell down)
+ Dividend increase news
+ Good entry price
+ Plan your trade per your risk tolerance

$ADT long run setup$ADT in an elevation sequence with earnings next week. Looking beautiful for a run towards the top. Looks at this one closely.
Short Term Target: 12
Short Term Target: 13
#bullish #ADT

LINKUSD 4HR Chart, Blastoff?It is my opinion LINK will make a move in the next 24 hours and bounce strongly off of the uptrending support as it is starting to do now. Lose the yellow line and we fall....

EURUSD 240+ PIPS CHANCE! Make sure that you have a valid entry, before taking this trade! this trade have a risk entry and risk reduced entry, use them according to your account and risk management!

