ATOM/BTC Bull TrendATOM looking great riding the bull market on 2HR chart.
Once ATOM reaches trend consolidation area, hopefully it can brake free creating ATH but can also create new ATL when the markets switch.
Lmk in comment section if you are bull/bear on ATOM and don't forget to hit that like button.
Happy trading everyone :)
Disclamer; I am not a financial advisor so please apply with caution.
Bullish Trend Line

The S&P 500 remains in a bullish trend - but beware
Quick comments in this analysis.
I tend to find just looking at the direction the ema ribbon, or red 20dma is an easy way to tell the underlying trend. Clearly it is still bullish.
I was wrong in the latest TA on the S&P 500 I posted. I foresaw a drop through that ema ribbon that did not materialize. That next week I closed that short for a loss, as once the price bounced off that ema ribbon which was historically a setup, it was evident shorting a bull market would have made the loss much worse.
I however did not chase the price as it went up higher, nor am I recommending longing here. I do however think while the price can continue higher, frankly I even am expecting it as the price appears very bullish and the financials XLF continue to rise towards historical resistance - there is not a clear setup for longing with the price this far from the mean and so overextended. If the price were to fall to support within the channel, & tag and confirm support off a pivot point to the right of the chart then I would consider longing.
If we have a significant drop I will seek to get back into equities. Till then I am stuck spectating, stock picking, and continuing to ride the Bitcoin/Eth bull market up its own wall of worry.

$PSG USDT Bullish cup in play #PSGUSDTAscending channel/cup in play on the daily
Play the pattern or buy the break out of this pattern

$Mine Chart setting up beautifullyMine Chart very bullish
RSI is respecting the tread-line perfectly
Mac D cross coming. Do not miss out!

$BUZZ Cup and Handle#BUZZ ready for take off! Just how far will it travel?
If your not onboard you get jump in..


TDOC: LONG SET UP FORMING, BE PREPAREDTDOC is setting up nicely for a break of the wedge/pennant.
A long position could be taken if we break and stay above 209 for a day.
Immediate targets are on the chart.
Trade safe.


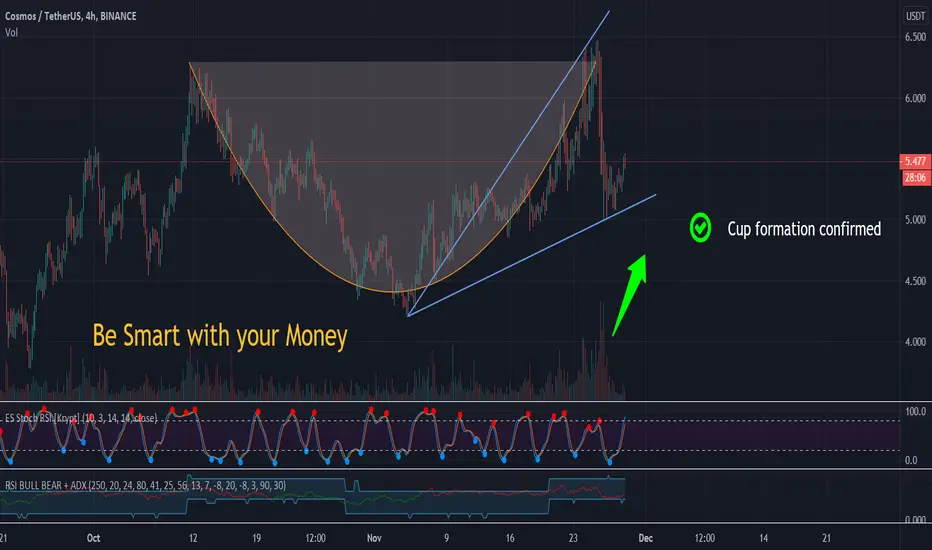
ATOM/USDTATOM is going to be bullish for now to form the cup structure then we are going to hunt a fortune out of it so stay tuned we are going to do magic with it :)
NWC/USDT is going to be bullishNWC is going to be bullish while the cup formation is going to be completed and the ladder structure highly supports the trend


Potential Ascending Triangle on the S&P 500Potential Ascending Triangle on the 15m. Nice bullish continuation pattern following a nice bottoming pattern.
Trendlines: The horizontal line is the resistance area while the ascending line (line trending up) offers support.
EMA Ribbon: The ema confirms what we are observing regarding the trend & likewise visualizes the bottoming pattern following the bullish continuation pattern.
Inverted H&S pattern – Quick bottoming pattern displaying left shoulder, head, and right shoulder

Long Position: Ethereum mark the 0.618% of Fibonacci!!!Hello, in this technical analysis, Ethereum mark the 0.618% of price entry with confirmatio to entry in long posiiton. I put my buy order limit at $410 USD with a SL at $403 USD and my own take profit it''s $442 USD.
So, I see that Ethereum is going to bullish!!! This is a good opportunity to buy Ethereum!!!
And then, this is the Daily timeframe. Ethereum show that it's going to bullish!!! So, we would need to buy Ethereum in hte best level to get our target profit!!!
Good luck in this posiiton!!!


$TLSS BREAKING OUT ~ DO NOT GET LEFT BEHIND$TLSS Countdown to financials Mid November. Q3 #'s will be fantastic.
TLSS acquired the assets of GRC Trucking. Cost savings and creating more revenue.
Deal with FedEx as we know. #FedEx #1 transporter for #Walmart, #SamsClub etc. #Walmart+.
Waiting for confirmation from TLSS in PR. We have done our DD.

#GOBTC #GOCHAIN #GO TIME TO $GO LONG TIME :)))It will move up strongly once it finish the accumulation and we will run behind of the $GO

VOC -long term breakoutOne to put on a watchlist for now is Vocus as it appears to be breaking out of a massive wedge pattern, for me there are two important levels to watch to confirm the strength and validity of a new potential long term trend - the 3.80 level, a breakout and retest of this level would be a long entry for me, taking half profit at 4.90 and let the rest run. If you want to be extra safe/certain it would be ideal to wait for a breakout and retest of 4.90 as this would be a crucial breakout area.
Just my opinion

ORCL breaking out of rising wedge amidst TIKTOK rumors ORCL breaking out of days long rising wedge with TIKTOK acquisition rumors coming to a close between ORCL vs. WMT and MSFT.
ORCL is at High of Week so it's hard to determine a target. My personal price target is 60.
Set a trailing stop for this one. Break above descending upper trendline has been confrimed. Now we wait for Monday.

SVL Trendline Support + Volume Increasing On UpwavesASX listed SVL simple trendline support on daily + seems like volume is decreasing on the down waves and increasing on the upwaves. Divergence can also be seen if you overlay the Monster Cumulative Delta indicator however It gets a bit messy so i left it out.
just noticed williams vix fix is in the green as well indicating a bottom.

$GO #GO #GOBTC #GOCHAIN TIME TO GOOOOOOOOOOOOOO :)Yesterday's candle was closed as DOJI :)
It is a good news . Let see the movie
