STOVE KRAFT, AGAIN TOUCHED THE TREND LINEi am waiting for a breakout by stove kraft, but it touched its major downtrend line, and now its gainig momentum(since, there are larger bars in the volume).
by the way, if you look the trend line from its IPO time(drawn in larger black line), the stock is sitting at the least point(support line), so if you are waiting for a breakout or not, you can still buy the stock, and earn till it reached its resistance line.
Bulls Power

Hindustan copper break a assending trangle Hindustan copper break a assending trangle after 2 year (1 day time frame )

Hidden Bullish Signal on chainlink??: Is this what a hidden Bullish Signal looks like?? Looks like a bull to me 😅

How To Go Long On GBPCADHi Traders,
Happy Monday, New week new Goals and New Opportunities,
Today I have my eye on GBP/CAD, My approach to this instrument is slightly different as I am using demand to spot a potential setup. Price has been making higher highs and higher lows since the 16th of May, We can see that price is currently pulling back to create a potentially new higher low.
I am specifically interested in 1.60 where there are a few confluences coming into play, It’s a psychological support area and we have a demand zone that is also untested, We could add a Fibonacci and a trendline which will add more confluences but I like to keep my chart clean.
I will be looking for price to pull back into my order block where I can then start looking at potential buying opportunities, Targets are around 1.680 which is also a previous high.
I will be waiting for price to come to me and then start applying my strategy for an entry.
Have a fantastic and profitable week ahead.
Renaldo Philander.

NAS 100 LongI believe we still have a lot for bullish momentum for yesterday's session that well continue to give bullish push

EURCAD BUY!!EURCAD has been trading inside a rectangle since April this year ! recently the pair tested the support and got pushed upwards ! Having had a failed attempt at getting pushed to the downside by the pivot line of the rectangle , i assume that the pair will be going up till the resistance of the rectangle before it gets pushed back in the pattern . My final Target for this Pair is 1.37400 !

Bitcoin Bulllish ? Or complex corrective structure ?Bitcoin Bulllish ? Or complex corrective structure ?

BTC Bulls ready?Lets see if btc can make it to 52k , I personally opened a long position. Trade safe!
Always DYOR no financial advice, watch out for scammers

QQQ New Support at 312 area ???Speculating that QQQ will create a new support line at 312 area. Once this support is created I think QQQ will receive more buy orders and the bulls will take over for a short period. Im thinking price will rise towards 322 area. However QQQ responds to 312 support will determine if I will be buying call options. If QQQ breaks 312 I wont decide to get in. If I do get in I will buy 322 Call Expiring 4/29.

GOLD, long or short?Starting with April 8th, we formed a very strong support area between 1938-1941. At the moment, we are in a bearish trend in this area. Large investors say "a downward trend is more likely to continue than change direction". The fight between the bulls and the bears begins. I think the bulls will do their job again.

Coming Breakout for the bulls So y’all seen the turn around and the bears was so close to breakdown; suddenly the bulls made a turnover reversal. It’s looking forward to surge pass the inflation, also the reporting seasonal kicks off as well so that is a good news.
NAS need to break pass 14600 to breakout and keep the bulls control; after that passes then we head to the recent highs since august of last year.
If that breaks still going then we will go to all time high since December.
Let’s see how Nás plays it off but will be pretty nasty push up pressure

GBPJPY LONGJust as predicted yesterday. It went for a beatiful retest and what we can expect overnight and throughout the day is going to the moooooon! Happy trading guys :)

DONT MISS SOLANA BUYFrom recent post just a content update for anyone expect the bullish breakout.
KEY FOR BULLISH BREAKOUT: expect to see 120 area to be broke; the support for 77 area are very strong… should be expecting the upside of the bulls.
I bought and already holding it..
once the bullish take over and control it then we should expect 400$ as our new high but I know we be expecting a lot higher this year.
But please DONT MISS THIS BUY OPPORTUNITY.
If you miss it , it’s not too late to get in if it drops only if drops then let it do its thing and buy the dip from there good luck.
THIS IS SOLANA YEAR

BULLISH REVERSAL FROM THE STRONG SUPPORT13170 became a very strong support, on the 4HR Chart. On the 1HR chart having a hard time from the support from the bulls making it’s turnover. Even experiencing worrisome from the Ukraine threats from the Russian nuclear weapons.
Anyways the bulls are strong and GER30 experiencing it from the big drop of wars at Europe, for now bulls are became now strong from the support and made a turnover reversal.
If it’s going to drop again then keep an eye around12960 or below area for the dip only if drop again.
2022 target is 180000 ; if breaks the high and bulls become stronger and take over more then it’s possible to hit 20000 before 2023.
What are your ideas analysis? No negative comments, thank you.

Silver - An opportunity of a lifetime? Hello All,
If you saw my last post about the bullish potential of Gold then Silver should pique your interest. Silver has not had a new All-time high since 1980 / 2011. Gold and Silver have a tendency to move together and act in tandem. Silver also has many use cases for technology that I will not get into here but a simple Google search can reveal that.
A large break out in Gold could push Silver much high and offer a larger percent return to the holder if this plays out. It would be good to keep your eye on these key levels over the next few months/years. This could be an opportunity of a lifetime.
This is a play that would require much patience but the time may be coming near.

US30 BULL RUN UPDATEDUS30.. is on a reversal point and now showed tug of war. Bulls are now stronger than bears, this is my view of point of what I’m seeing hope y’all love my new look of a chart.
ATH target is 40000 for this year, once 35800 breaks then we be seeing bull market breakout, but once new high hits about 38500 then big drop retracement then back shoot up to hit the very top. I be holding hit. Let’s go to the moon

Bulls unleashed power max, as the clouds of war became lax.With Russia and Ukraine war pressure seeming to ease today what we are seeing in Nifty is a relief rally. This can continue for a while and next resistance for Nifty is around the range of 17486. Crossing 17486 next resistance for Nifty will be at 17815. Supports on the down side for Nifty are 17128 and 16823. Critical level to cross for Nifty will be 50 EMA that is at 17486 sustaining above it will enhance the chance of Nifty moving first towards 17800 levels and thereafter to 18K levels. We hope that there is no further bad news from Ukraine front.

XAUUSD UPDATE!This is the update on XAUUSD. The market has stopped out the sellers and filled in the bulls buy limits. I am looking for price to retrace and buy to 1875. Let's see how it goes.

US30 BULLS BREAKOUTLast recent post I know this was going to happen thanks for the horizontal support and made a huge push up, bulls are now taking over.

Possible Inverted Head & Shoulders!!4 Hr Time frame inverted Head and Shoulders Pattern looks to be forming, Thoughts Leave in Comment

WATCH THIS DAY CLOSE🚀🚀In my last post I explained how you should have bought call options on the overall support line, from then the price has gone up.
If we manage to close a day candle over this resistance point we should expect very bullish behavior. Not that we haven't already.
Tell me what you think in the comments! Seeing everybody bearish yesterday but bullish today is confusing.

ETHUSD SHOULD BE ABLE TO BREAKETHUSD should be able to break the bands push up more and came oversold. The bulls are playing it well ; the next target is 6000, before the long big drop. It has to breakout the bearish channel pass 3200 then the bulls are good to fly. Less than tht then be in a bearish reversal; BTCUSD target is 75K.
Safe trading y’all and good luck

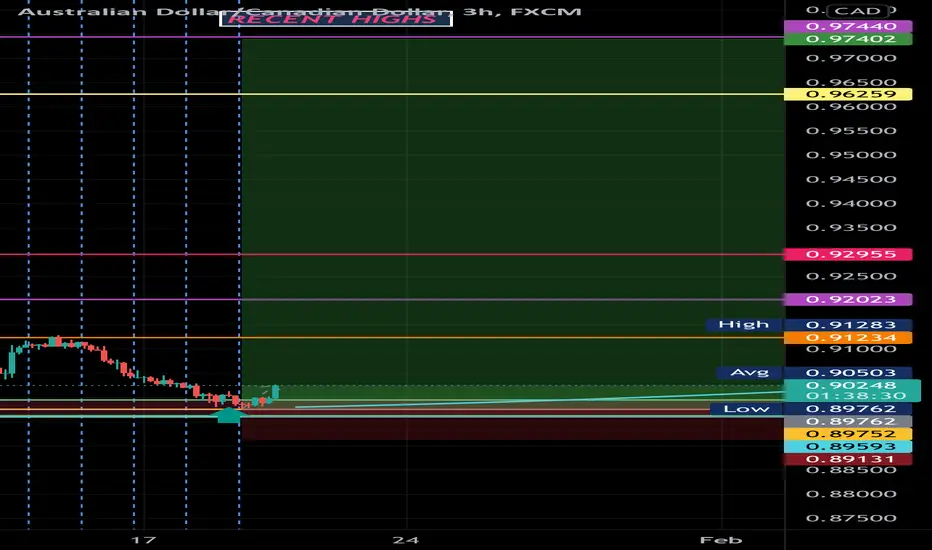
**UPDATE** INCOMING BREAKOUT If you buy Audcad already should be in deep profit the bulls are hella strong ; hold it and get ready for the breakout of the bulls y’all over hundreds of pips ( I lost cost )