XRP IN DECIDING PHASE!!XRP has been one-sided thus far. I've identified a 15min Ascending Channel, & price has recently bounced off of its resistance level. Also in the same area, XRP tested a strong Daily Resistance Level. 1 or 2 scenarios could happen. I'm expecting price to test the Daily resistance at least one more time before a sudden dive. If that occurs, then we could be in for some more BULLISH Action! Leave your thoughts & Comments below. Would love to see your perspective on XRP.
Bulls Power

Bitcoin Bulls are still here!!...Bullish action may proceed on Bitcoin following the Candle close above resistance turned support. First target has been set @ProfitLevel charted. Price is currently testing a strong Daily level. It could make a surge to $10k. At the same time its battling inside the top of a 1HR Ascending Channel. This will get interesting... Have a Safe Trading day!


BTC Current Chart July 2020 --- BULL RUN INCOMINGConsolidation window shown from my charts. I predict a huge price move up (or down) by Setpember/October, if not sooner.
Higher chances of moving upwards to due the supports after last weeks green candle, and general correlation right now with the gold and silver markets. Very bullish we get a weekly close above this light red line of resistance, formed since Dec 2017.
See these youtube links for more information on those statements above (not affiliated with these guys at all, just showing my sources):
youtube.com/watch?v=yGOPbAxuJOY&t=415s
youtube.com/watch?v=-fKjfW1K7wk&t=8s
I'm completely Bullish on this in the short term, and as always, in the long term.
This time next year, BTC around $9000 USD will seem like such a steal...
Cheers!

Bitcoin continue in demand: Buyers are strenshten!!!As updated, we see that Bitcoin have force to continue up in the next hous, now, this is a good indicator of what Bitcoin make
We see in Daily that Bitcoin has finished yesterday with a stong bull candlestick, that show us a signal that buyers are here to jump the price up.
Also, in H4 timeframe we have a species of neckline in the shoulder head shoulder inverted, and I see that Bitcoin doesn't want to broke down of there neckcline, otherwise Bitcoin is above of neckline!!!

BEARS incoming to create a HL for us to BUY for 75+ pips.#TellMeWhatYouSee What do yall see tell me if we have different opinions.

Market/Usd Prediction Maker coin has a lot of buying power right now... it could possibly not be too late at all to jump aboard for some nice gains 🚀🚀🚀🤑

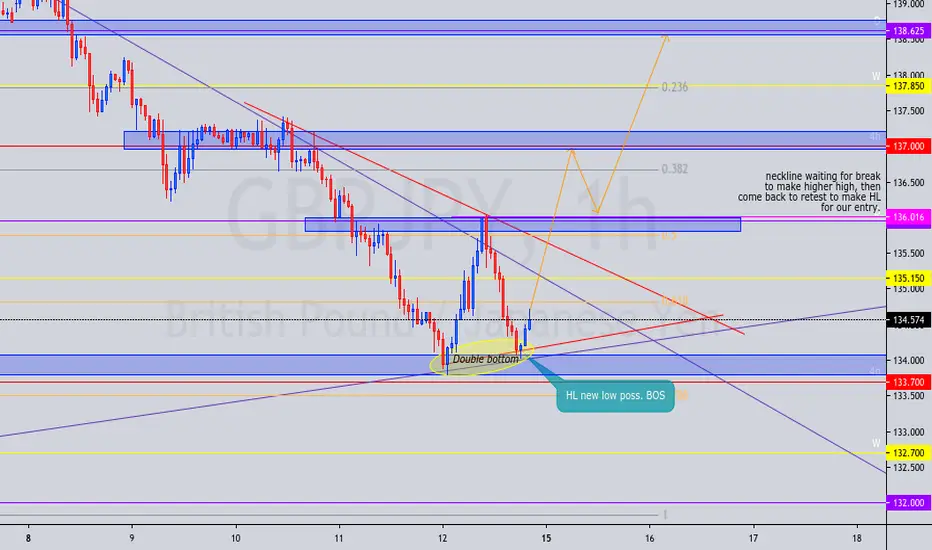
GBPJPY analysis BULLS COMING TO TOWN!This is what I am looking to see happen this coming week in the market.
EUR/USD - Continuation of Bullish MomentumHello Traders!,
Markets are back open, Hoping we all had a great weekend of rest, relaxation and preparation for the week ahead of us, it seems that we'll still be riding the bulls this week against the USD, lets wait and see!
What Is The Market Telling Us?
Great bullish momentum in this market ever since 14th May, almost a whole month now!
Price was previously rejected at weekly resistance, will anticipate another test of this level and determine where the trend goes
14EMA & 50SMA are repeating pattern of closing in together then repelling
Higher lows continue to be broken and retested
When Should We Enter?
Looking for clear bullish patterns on lower timeframe
Should look to BUY once a clear bullish candle closes above Support 1


Is Spy Bearish and When to Get In?This week has definitely been the most baffling to new investors and the untrained eye. This gap up on Monday followed the general market rules and the following days have been acting accordingly. If you understand the past movements feel free to skip to the Predictions section below; otherwise, keep reading.
Why the Gap?
First off if you don't know what happened, it has to do with the head and shoulders pattern that formed over the past month and the following pull down on Friday that occurred as a result of the pattern. This pull-down was headed to a destination, give or take the 260 area, but they needed to retest the neck-line to see if this movement was in fact valid..this happened on Friday, but the bearish head and shoulders pattern failed therefore the pull-down movement was the gap-up we saw. This type of movement calculable and I suggest you do some research if that interests you.
Predictions
Look for the time being you should ask yourself: where are sellers likely to come and when will the bulls lose steam? My thoughts are that a we will see sellers around the 299/298 mark. Why? Because this is where the 200 period moving average is for on the daily... need I say more? If they blast through this value watch the big fat round number 300 and past that will only be short squeeze to 302ish, this is where the head-and-shoulders reversal calculation will come in handy. These values are the big 3 to watch out for and a good entry point for a sell-off to at least the neckline, yes I know it should be invalidated but it is also a trend-line and I like the values(290 in particular).
What Am I?
I neither a bull nor a bear... just a trader. Check out my other predictions for quality and accuracy... except the fugly DKNG prediction. I learned a lesson that day, but on SPY and other major indices I pride myself as being in the know.
Like and Follow!! Also please leave comments and questions. I will happily answer and digest your guys input!

AUDUSD (OLHC) Possible Long-Term Bullish sentimentsMONTHLY
Overall structure since the beginning of this year 2020 is currently OLHC. Price is looking for a suitable strong support to bounce off .. There is also divergence in price from the 1st if September 2015 to 1 April 2020. Market is extremely oversold and needs to correct .. Currently sellers are still dominating market we wait for a strong support and also for Priceline crossing back above volatility bands and bloodline to introduce the return of buyers in markets . THIS COULD ALSO BE A POTENTIAL YEARLY STRUCTURE OLHC FX:AUDUSD .
WEEKLY
Structure is still OLHC.. Buyers are gradually gaining control . With Priceline crossing above bloodline we expecting bullish momentum soon.. inside bar range showing a little consolidation 0.62002 and 0.56993. Potential take profit will be liquid 50 and the Open of this month (check lower TF 4hr)
DAILY
OLHC structure still showing in a day .. price is looking for a strong support to reject off ..
4 HOUR
OLHC structure .. Priceline appears to be extremely oversold .. buyers will only be in market when Priceline crosses back above Volatility bands and bloodline.
Overall structure is OLHC.. we looking for a strong support to find long term buys .. Patience ..

BTC at U$ 55k? Is it possible?What the chart can tell us about the future of BTC?
There’re a lot of theories surrounding the crypto, and most of them are positively promising, and these theories are gaining strength now, specially with the halving coming this month. For instance, we have models that can be used to determinate the Bitcoin’s value, like the Stock-to-Flow model, which I find interesting and it makes sense, but what I’ll do here today is analyze the chart.
Let’s look the weekly chart for a good perspective. Now, BTC is trading inside a descending channel for months, which is typical of a bear market, and here I’ll quote again what Charles Dow, the technical analysis’s father, said about a century ago: “Trends persist until a clear reversal occurs”.
And that’s bad right? I mean, that “clear reversal” didn’t occurred yet. Yes, that’s true, but there’s a light at the end of the tunnel here. Look more carefully at the volume.
During the last bullish movement (evidenced by the purple rectangle) the volume was low, even lower when compared to the whole year (evidenced by the red rectangle). That means that the bulls were not strong enough to change the trend.
Now, we witnessed another good bullish reaction over the past weeks again, but this time there’s a difference. Look how the volume increased! Even the 21 moving average that is in the volume is going up now. Charles Dow also said: “Volume must confirm the trend”. And that could make the whole difference for BTC now.
And if a bull market starts here, I firmly believe BTC will have the strength to breakout the U$ 14k and will test the U$ 20k again. At least that’s what the chart tells us.
So, there’s a lot in stake here. With the halving coming and the price at such delicate moment, we are living one of the most decisive moments on the history of cryptos.
Remember to follow me, I’m a trader who uses the classic technical analysis (barely any indicator, just the candles and the volume). Like this idea if it helped.
Thank you very much.
* LIKE this idea and FOLLOW me, because:
- Here, you will see clean charts;
- Trades with clear risk management;
- The best of Dow Theory, Price Action and Candlestick psychology;
- Chart patterns with statistics. *
* My name is Nathan, I'm a trader and portfolio manager and I'm here to LEARN. Leave your COMMENT and FOLLOW me to keep in touch. *

BUY AUD/USDThe Elliott wave cycle is completed, the price is in a downward movement we are expecting the price to reverse its direction and move upwards towards the target profit:
Stop Loss: 0.6435
Entry Point: 0.6451
Target Profit: 0.6530.
Do not hesitate any question for clarification.
Good Luck!

Did BTC just break the downtrend?24hrs after my first idea that we are in a downtrend that was due to happen, seems that i jinxed it and woke up the bulls. Im long on a close above that line. BTC also touched the strong 6500 support area which held pretty amazing and it pumped pretty well.

Volatile Markets In Recent Times ? PERFECT !Over the past few weeks, we have been observing huge volatile market with various currency pairs due to the spread of the virus. Times like this, volatility gives price to reach long term movement much faster, Looking at the USDCHF price as been trending downwards up until last week, an huge reversal occurred to the upside at the 0.918 support level. I expect price to continue with this trend and momentum towards 1.032 eitherways time would tell !
Risk Warning : The risk of loss in trading Foreign Exchange (FOREX) can be substantial.
You should therefore carefully consider whether trading is suitable for you in the light of your financial condition.
Goodluck !

BULLISHLONG ON PNB FOR MONTHS TO COME EXPECTING A GOOD MOVE TO UPSIDE!! SEEMS LIKES BEARS ARE LOOSING TERRITORY!!!

GBPJPY BUYBUY GBPJPY AT BLUE LINE
TP AT GREEN LINE
SL AT RED LINE
Broke of trendline and 21 moving average act as dynamic support
Note I'm waiting for the break of the main trendline that's only when I'll use bigger lots size


Oil is at key level..I've made this analysis last week, 2 week ago waiting for the good buying confirmation.
It is now at the key level where it may bounce up or bear are still in control to 2nd buy scenerio.

long position on EURNZD is happenning now !!!!eurnzd haz completed its consolidation by the looks of it i have entered a long position and will be holding this position for the rest of the weeks with management .
price has came down to the level we marked as support a couple times and has not been able to break it ! we are anticipating a initial push up to indicate a trend reversal . then we will close out half my position and wait for reentry on new uptrend

CMCM MomentumIncreasing bullish momentum for CMCM within the current downtrend, a successful descending scallop can also be observed.

