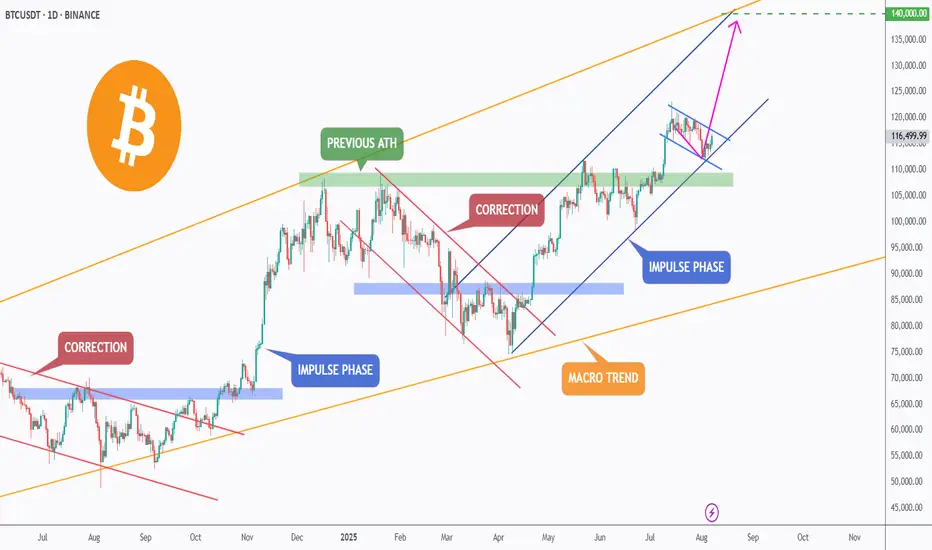
BTC – Breakout Loading?Bitcoin continues to respect its macro bullish trend (🟠), trading within a large ascending channel that has guided price action for over a year.
After breaking above the previous ATH 🟢, BTC entered a correction phase 🔻, retesting the green zone — a key structure now acting as support.
The bulls stepped back in, initiating a new impulse phase 🔵. Currently, BTC is consolidating within a small blue descending channel — forming a classic bullish flag 🏁 pattern.
⚠️ For the bulls to take over and trigger the next impulsive wave toward $140,000 🎯, we need to see a confirmed break above this small blue channel. This would signal trend continuation and open the door to the upper boundary of the macro channel.
✅ Key levels to watch:
- Support: ~$110,000 (green demand zone) 🟩
- Resistance: Top of the blue flag 🟦
- Target: $140,000 💰
A breakout from here could fuel the next major rally — stay sharp and follow the trend!
💬 What’s your bias here? Are you bullish or waiting for a deeper pullback?
📚 Always follow your trading plan regarding entry, risk management, and trade management.
Good luck!
All Strategies Are Good; If Managed Properly!
~Richard Nasr
Bullrun
BTC Retest In Progress – Ready for Liftoff?🚀 Bitcoin has been respecting the long-term rising channel (blue) — moving in clear impulsive 📈 and corrective 📉 waves.
After each bullish leg (highlighted in pink), BTC dips into a correction (red), finds support at key demand zones 🟧, and then kicks off a new rally.
🔥 Currently, BTC is hovering near a strong demand zone around the $110,000–$113,000 area, forming a potential higher low within structure.
If this zone holds, the bulls 🐂 could regain control and push price toward the $130,000–$140,000 range — aligning with the upper boundary of the channel 📊.
💡 Continuation soon?
Let the market decide — we’re watching this zone closely for a bullish breakout confirmation ✅
💬 What’s your bias here? Are you bullish or waiting for a deeper pullback?
📚 Always follow your trading plan regarding entry, risk management, and trade management.
Good luck!
All Strategies Are Good; If Managed Properly!
~Richard Nasr

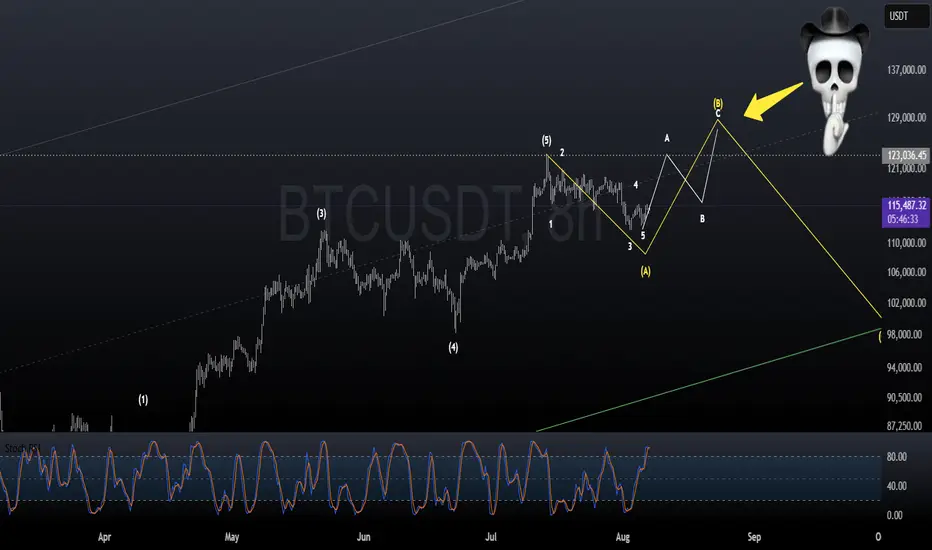
BTC, the clock is tickingLet the chart speak for itself. BTC will make new ATH before the Fed Pivot. After the pivot however, panic will occur and there will be blood on the streets.
You have been told.
P.S Not financial advice.
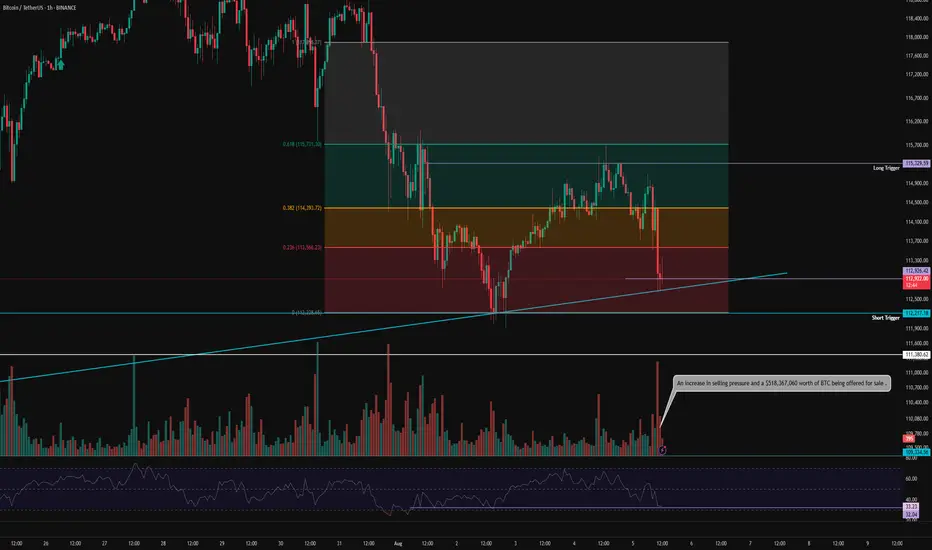
BTC 1H Analysis – Key Triggers Ahead | Day 2💀 Hey , how's it going ? Come over here — Satoshi got something for you !
⏰ We’re analyzing BTC on the 1-hour timeframe .
👀 After the strengthening of the US dollar , Bitcoin experienced a drop and formed a short-term support bottom around the $113,000 level . It is currently completing a pullback to the levels of this recent decline .
🎮 Our Fibonacci retracement is drawn from the breakout zone to the $112,200 bottom . Bitcoin broke below the 0.236 level and then found support . The best potential entry trigger, based on Fibonacci, is at the 0.382 level, or around $115,000 . If Bitcoin breaks above this level , it could form a higher high and a higher low in this timeframe .
⚙️ The RSI is showing a support level around 32 , which is currently preventing Bitcoin from entering the oversold zone . However , if this support is lost , Bitcoin could move into oversold territory .
📈 Our long position trigger is at the 0.382 Fibonacci level . A confirmed breakout of this level , combined with RSI overbuying and increased volume , would be our entry signal .
📉 Our short position trigger is around $113,000 . If this support breaks , we may open a short position . However, the main short trigger is at the 0 Fibonacci level ( support at $112,200 ) . If selling pressure increases and RSI enters the oversold zone , we will consider entering a short position with confirmation .
❤️ Disclaimer : This analysis is purely based on my personal opinion and I only trade if the stated triggers are activated .
ETHEREUM SEASON LOADING!Ethereum appears to be literally following bitcoin's pattern ahead of its 2021 bull run

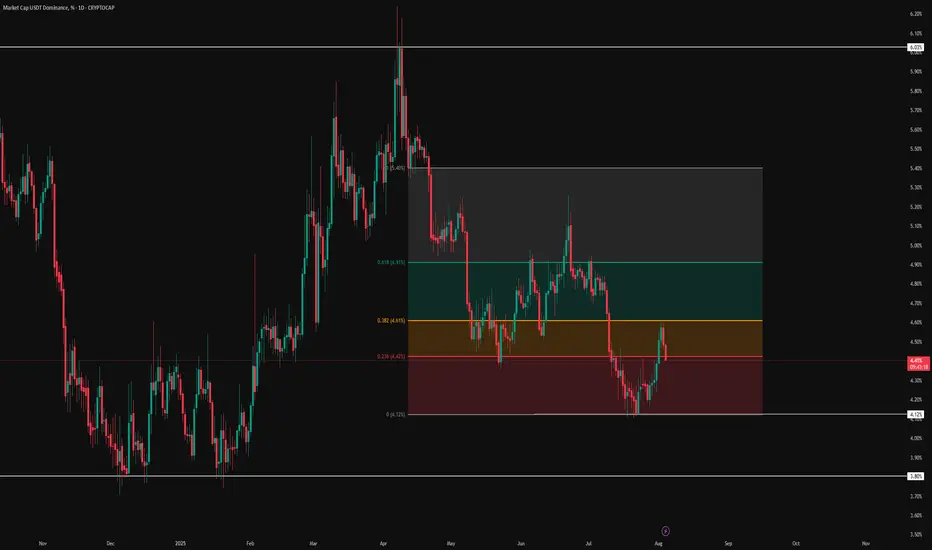
Will a Drop Below 4.12 Push BTC to New Highs ?👋 Hello, and welcome to Satoshi Frame .
📊 USDT Dominance , after a sharp move toward 6% , got rejected strongly from that level with a powerful candle .
🔻 Following that , it lost its key support and entered a deep corrective phase .
🚀 During this period, Bitcoin and altcoins experienced a strong upward trend , and 🟠 Bitcoin even recorded a new all-time high .
📉 The key support level for USDT Dominance is at 4.12% .
⚠️ If this level is broken, Bitcoin could potentially reach a new all-time high again .
📐 I’ve drawn my Fibonacci from the point where the support was lost , the structure broke , and the previous uptrend turned into a corrective or bearish trend .
🔽 The breakdown of that key support pushed USDT Dominance down to 4.12% , where we saw strong buying pressure in Bitcoin and altcoins, leading to a sharp upward movement.
🔄 Price then retraced to the 0.382 Fibonacci level (4.61%) , acting as a corrective pullback within the ongoing downtrend.
❌ However , this area triggered a rejection , and now we are witnessing another decline in USDT Dominance.
💡 Disclaimer : This analysis is for educational purposes only and should not be considered financial advice . Always do your own research and manage your risk before making any trading decisions .
Seven topics explaining why Ethereum might be heading towards atSeven topics explaining why Ethereum might be heading towards at least $4,500 after returning to its trend:
1. Market Sentiment and Bullish Reversal
When Ethereum breaks out of a consolidation phase or a downtrend, it often signals a shift in market psychology. A bullish reversal can be triggered by technical patterns such as ascending triangles, breakouts above key resistance levels, or bullish candlestick formations. Positive news (e.g., regulatory clarity, major partnerships, or favorable market reports) enhances investor confidence. Once traders recognize a trend reversal, it leads to increased buying momentum, further propelling ETH higher. This shift in sentiment often acts as a self-fulfilling prophecy, attracting more capital into the asset.
2. Institutional Adoption and Investment
Institutional investors, including hedge funds, asset managers, and pension funds, play a crucial role in cryptocurrency price dynamics. Large-scale investments, ETFs, or custodial solutions designed for institutional clients can generate significant buy pressure. Notable endorsements from major financial firms or integration of Ethereum-based products into mainstream financial platforms can serve as a validation, encouraging broader participation. This institutional involvement often brings stability and confidence, supporting sustained upward movement towards higher targets like $4,500.
3. DeFi and NFT Growth
Ethereum's ecosystem is the backbone of the decentralized finance (DeFi) sector and NFTs. The expanding adoption of DeFi applications (lending, borrowing, staking) and booming NFT markets increase demand for ETH, since it is essential for transaction fees and smart contract execution. As new projects and use cases emerge, the utility of ETH grows, directly impacting its value. Additionally, mainstream adoption of DeFi and NFTs draws more retail and institutional investors into the ecosystem, contributing to price appreciation.
4. Network Developments
Ethereum continues to undergo significant upgrades to address scalability, security, and sustainability. Ethereum 2.0, with features like proof-of-stake (PoS) consensus, shard chains, and Layer 2 scaling solutions (like Rollups), greatly enhance network efficiency. These upgrades improve user experience and reduce transaction costs, making Ethereum more attractive for developers and users. The improving technology infrastructure can result in increased transaction volume, user activity, and investor confidence, which collectively drive the price upward.
5. Macro and Cryptocurrency Market Factors
Broader macroeconomic conditions influence Ethereum’s price. A declining dollar, inflation concerns, or global economic uncertainty can push investors toward alternative assets like cryptocurrencies. Bitcoin’s market movement often correlates with ETH, and a bullish Bitcoin trend can lift ETH prices as well. Additionally, positive regulatory developments or a general rally in the crypto market can create a favorable environment, supporting Ethereum’s ascent to higher levels.
6. Technical Indicators
Traders rely heavily on technical analysis. Breakouts above significant resistance levels (e.g., previous highs around $3,500 or $4,000), increased trading volume, and bullish chart patterns such as flags or bullish divergence reinforce the upward trend. These technical signals attract momentum traders and institutional players, which accelerate the price increase. Consistent bullish technicals contribute to a self-sustaining upward trajectory toward the $4,500 target.
7. Supply Dynamics
Ethereum's supply mechanics significantly influence its price. The implementation of EIP-1559 introduced a fee-burning mechanism that reduces circulating supply over time, creating a deflationary pressure. When network activity is high, more ETH is burned, decreasing supply and potentially increasing scarcity. Furthermore, the transition to Ethereum 2.0's proof-of-stake reduces issuance, limiting new ETH supply entering the market. These supply-side dynamics, combined with growing demand, can lead to significant appreciation, moving ETH toward and beyond the $4,500 level.

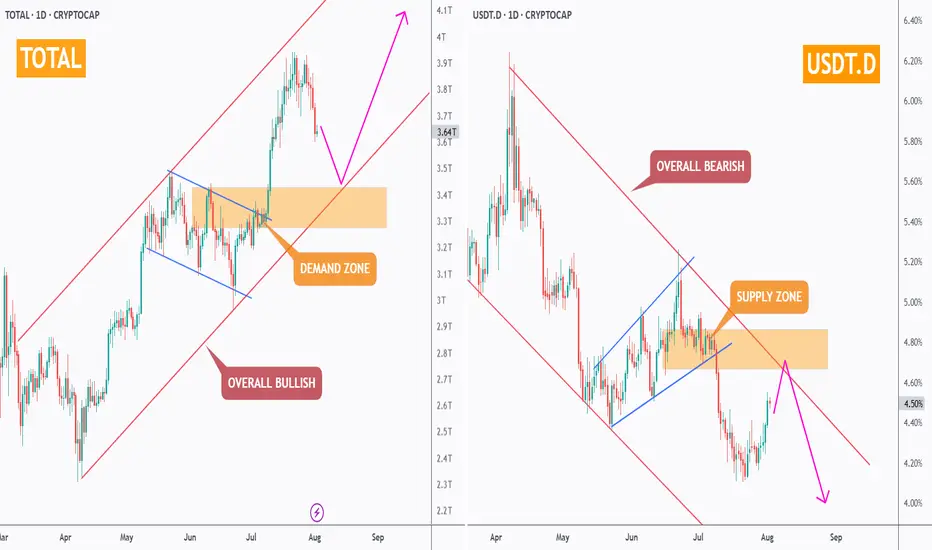
Don’t Panic — It’s Just a Healthy Crypto Correction!While the crypto market has seen some red this week, the bigger picture remains intact. Let’s zoom out and make sense of the current correction.
🔸 TOTAL Market Cap (left chart)
The structure remains overall bullish, trading inside the red rising channel.
After a solid rally, the market is currently pulling back toward a strong demand zone – perfectly aligned with the lower trendline. This area is likely to act as a major support, from which the next bullish impulse could kick off.
🔸 USDT Dominance (right chart)
USDT.D remains overall bearish, trading inside the red falling channel.
It’s currently pushing higher toward a well-defined supply zone, which also intersects with the upper red trendline. As long as this area holds, we expect sellers to take over again — giving altcoins the space they need to bounce back.
📌 In simple terms:
The market is in a healthy correction. Don’t let short-term dips shake your long-term view. The trend is still your friend.
➡️ As always, speak with your financial advisor and do your own research before making any investment decisions.
📚 Always follow your trading plan => including entry, risk management, and trade execution.
Good luck!
All strategies are good, if managed properly.
~ Richard Nasr
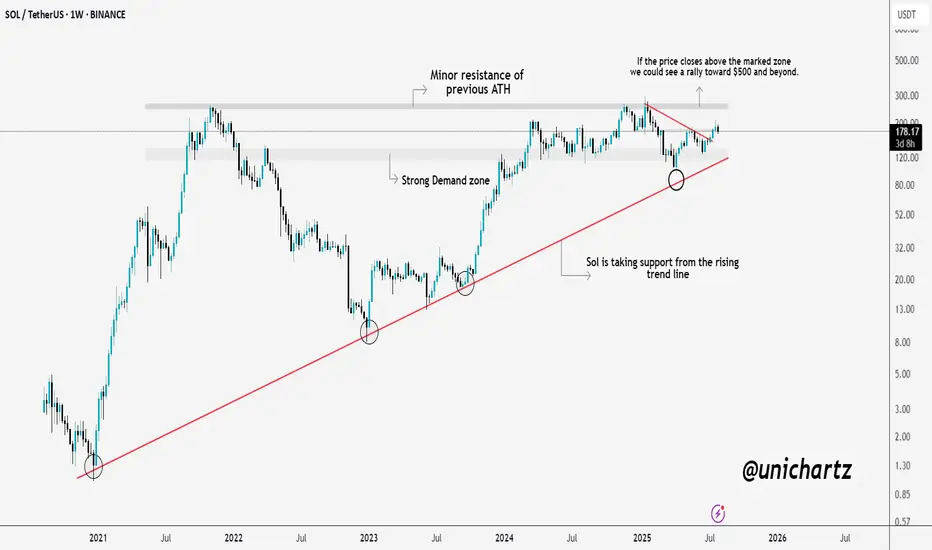
Massive Move Loading? $SOL Prepping for a BreakoutSolana is showing real strength here.
CRYPTOCAP:SOL consistently taking support from the long-term rising trendline, a sign that buyers are defending key levels. We're also approaching a critical resistance zone, which was the previous ATH area.
If SOL manages to close above this zone, we could witness a strong rally towards $500 and beyond. Until then, it’s a crucial level to watch, a breakout here could set the stage for the next leg up.
DYOR, NFA
Dash RocketDash has been in a bearish trend for some time now, but it has stood the test of time being one of the OG coins of the market with this double bottom within this descending channel on the daily and a retest of demand I believe this coin will see $50 soon.
It’s master node runners and minors have kept the chain going, and we should be breaking its bearishness very soon.

[Deep Dive] SUSHI – Edition 3: Accumulate. Anticipate. Accelerat🧠 Cycle Anatomy: What the Chart Is Telling Us
📉 Phase 1: Markdown
The bears dominated, slicing price downward into key historical support around the $0.50 mark — the same level that anchored the previous accumulation zone.
📦 Phase 2: Accumulation
Both accumulation phases (mid-2023 and Q2 2025) occurred near identical support zones, with rounded bases and sideways chop — signaling strong hands quietly absorbing supply.
📈 Phase 3: Markup Incoming?
Following breakout point “1” and retest point “2,” the current structure aligns remarkably well with the previous markup phase — which propelled SUSHI from ~$0.50 to over $3 in just weeks. While past performance isn’t a guarantee, this fractal deserves attention.
🔥 Why Fundamentals May Support This Move
- SushiSwap v3 continues rolling out on multiple chains, optimizing capital efficiency and fee structure for LPs.
- Governance has stabilized after the rough patches of 2022–2023, with more transparent treasury and development direction.
- Cross-chain expansion and integrations with major aggregators (like 1inch, Matcha, and DeBank) are boosting SUSHI’s visibility in the broader DeFi flow.
Additionally, a surge in TVL and DEX activity on low-fee chains could redirect volume back to SushiSwap — a platform known for its cross-chain capabilities.
📍 What to Watch Next
- A confirmed breakout above $1.00 would validate the “markup” thesis.
- A dip toward the $0.65–$0.70 zone could offer a high-risk/reward entry aligned with point “2.”
- Failure to hold the $0.50 level would invalidate the structure.
For now, the rhythm is clear: markdown → accumulation → markup. And if the pattern holds, SUSHI might just be preparing for its third vertical.
💬 Do you think this is just another fakeout — or is SUSHI gearing up for a DeFi comeback?
🔔 Disclaimer: This post is for educational and informational purposes only. It does not constitute financial advice. Always do your own research and manage risk carefully.
📚 Always follow your trading plan => including entry, risk management, and trade execution.
Good luck!
All strategies are good, if managed properly.
~ Richard Nasr

Potentially a wave 2 completing of wave 1 of 3 in wave one...06 or higher is looking like a target before the explosion. If i am correct this is on to add to your list. I will not be giving any FINANCIAL ADVICE as always.
This could go wild over the next year.
Good luck :)
THETA Bounces Off Key Support – Eyes on Resistance!After months of holding above the key support zone, MYX:THETA is finally showing some strength.
Price is bouncing off the lows and heading toward a minor S/R zone.
If the bulls can break through this level, there’s a good chance we’ll see a move all the way up to the upper resistance line.
DYOR, NFA

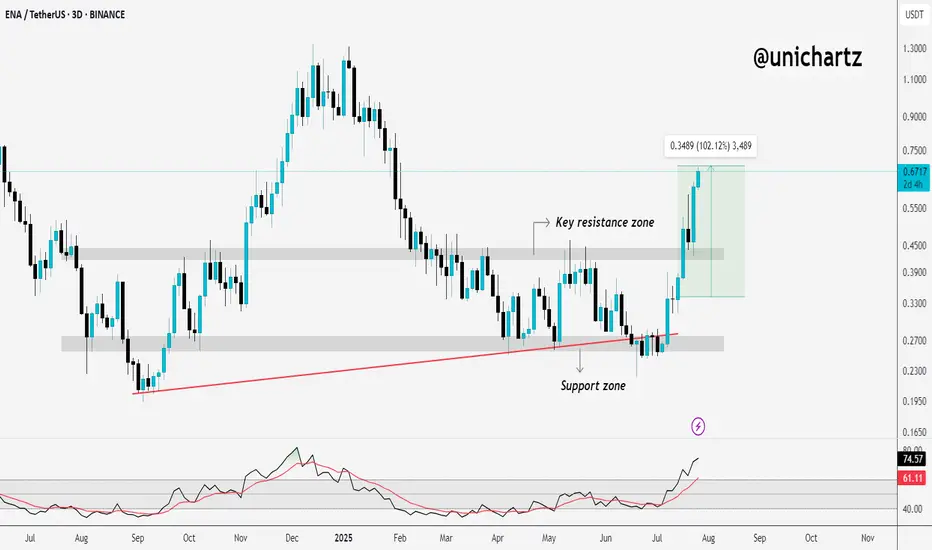
ENA Explodes After Breakout – What’s Next?
ENA Exploded 100%+ After Our Post 🚀
Just days ago, we highlighted ENA as one to watch — and it delivered.
Since then, price has nearly doubled, breaking past key resistance with strong volume and momentum.
This is why timing + conviction matters. When the setup is clean, the move speaks for itself.
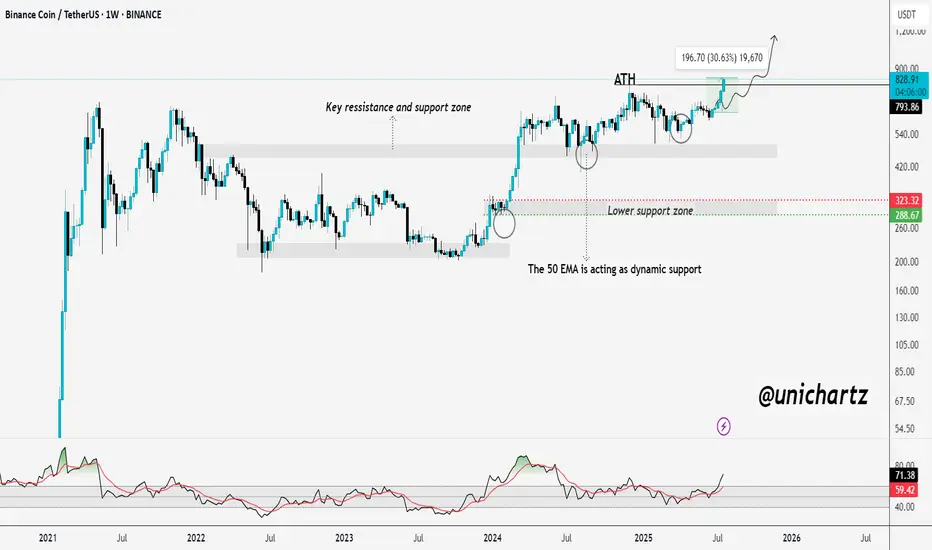
BNB Breaks ATH – Just Like I PredictedBNB ATH Breakout – Just As Predicted 🚀
A few days ago, I said it loud and clear:
"Mark my words — BNB will not only retest its ATH but break it and go beyond before the year ends."
Well... today, it happened.
BNB just smashed through its previous ATH and printed a new all-time high, exactly as charted.
Strong structure ✅
EMA support held ✅
Momentum built up ✅
Bulls showed up ✅
This is what conviction backed by TA looks like.
BTC - Trap, Tap, and Blast Off!BTC has been overall bullish, trading within the rising blue channel (1). After reaching a local high, it entered a short-term correction, forming a falling red channel (2).
👀All eyes are now on the key demand zone (3), which aligns with the lower bound of both the red channel and the rising blue structure.
🔎As long as this confluence holds, we anticipate a potential bullish impulse in August.
A retest of the $111,500–$112,000 zone could serve as the trigger for the next leg toward $128,000. Let’s see if BTC is gearing up for another breakout or if a deeper correction is in play.
🔔 Disclaimer: This analysis is for educational and informational purposes only. It does not constitute financial advice or a recommendation to buy or sell any asset. Always do your own research and manage your risk accordingly.
📚 Always follow your trading plan => including entry, risk management, and trade execution.
Good luck!
All strategies are good, if managed properly.
~ Richard Nasr

ARTY - The Undervalued Gaming Rocket?While most eyes are on memecoins and major Layer-1s, a sleeping giant may be gearing up in the GameFi sector — and this time, it’s powered by real innovation and user growth.
🎮 Fundamental Boost
Artyfact has just launched its long-awaited Play-and-Earn mode — the first of its kind. This new feature is expected to onboard hundreds of thousands of gamers into the ecosystem. And here’s the catch: players can only purchase gaming NFTs using KUCOIN:ARTYUSDT . This shift not only introduces a fresh wave of demand but also builds real token utility — the kind most GameFi tokens lack.
💼Additionally, recent sell pressure from early investors has now faded. Those who had been staking ARTY for three years have finally taken their profits. With that wave of selling behind us, the token now has room to breathe — and potentially fly.
And yes, I bought ARTY myself — not financial advice, but I’m personally betting on its next big move.
📊 Technical Analysis
AMEX:ARTY has been trading within a bullish ascending triangle, forming higher lows and maintaining strong support around the $0.13 level. Each time it tapped this zone, it triggered strong impulse moves — one up 88%, another over 100%.
Right now, ARTY is back at that exact support level, with a third impulse wave potentially brewing. A bounce from here could send it back toward the upper trendline near $0.30 — our first target.
If that breaks, the next resistance sits around the $0.70 zone, a previous structural high and psychological round number. And if the gaming adoption kicks in as expected, we could be heading toward a macro bull market target of $1+, which would represent a multi-X move from here.
📈 3 Bullish Targets for AMEX:ARTY
$0.30 — top of ascending triangle
$0.70 — structural resistance from prior impulse
$1.00+ — psychological milestone backed by new NFT demand and adoption
📍 Why ARTY?
Artyfact is not just another GameFi project — it’s building a functional gaming economy where NFTs have real use, and where the token is required for participation. In a sea of hype-driven tokens, ARTY stands out by actually shipping product and onboarding users.
With the new Play-and-Earn mode gaining traction, a solid technical base forming, and sell pressure behind us, ARTY could be setting up for its biggest run yet.
➡️ As always, make sure to do your own research and only invest in what you truly believe in.
🎯 Stick to your trading plan — entry, risk, and execution.
Good luck!
All strategies are good, if managed properly.
~ Richard Nasr

Ethereum Ready for Breakout Above $3850?📊 Ethereum Quick Analysis | Breakout or Breakdown?
✅ As long as ETH stays between $3400 - $3600, the bullish outlook remains intact.
🚨 A confirmed close below $3200 could mark the end of the bull market.
🚀 A clean, shadowless candle close above $3850 may push price toward $4100.
⚠️ However:
📉 Expect retail sell-offs around those highs
💸 But heavy institutional buying could send ETH to $6230 in the short term.
🔥 Altseason is officially here — get ready for explosive moves!
🎯 I'm here to track and update all major targets in real-time 💥
#BullRun#altseason#ETH

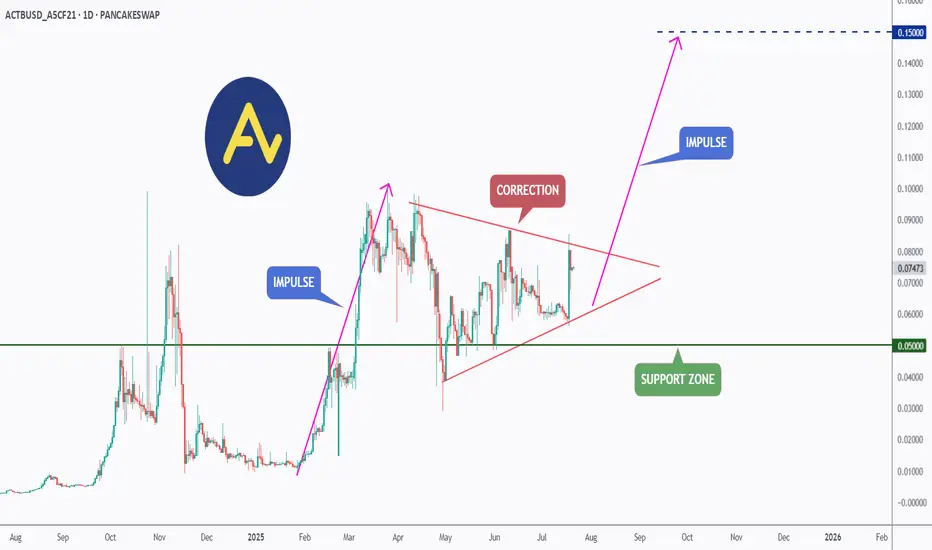
ACT (Acet) - Eyeing the Next Impulse Move?ACT has been forming a textbook bullish continuation pattern.↗️
After a strong impulse leg earlier this year, price has been consolidating within a symmetrical triangle, signaling a healthy correction phase.
🏹Today, ACT broke out of the triangle to the upside , indicating that bulls may be taking control once again.
📍If momentum continues, the next impulse move could push price toward the $0.15 resistance as a first target — a major psychological and technical level.
As long as the $0.050 support holds, ACT remains in bullish territory with upside potential in sight.
📚 Always follow your trading plan regarding entry, risk management, and trade management.
Good luck!
All Strategies Are Good; If Managed Properly!
~Richard Nasr
$MOG Setting Up For Cup & Handle Breakout - 10x - 100x TargetsAs I stated in the video, I don't normally cover Meme coins, but this is a great looking chart for MOG and thought I'd do a quick study on this with some potential price targets...
And how I'm using AI to get a better handle on the likelihood of my TA targets.
In short -- 10X here is possible this bull run (8.5x more likely based on the Fib)
But 100X is very unlikely, even though the top of the parallel trend channel shows it's potential.
No surprise there, but watch how using AI can give clarity on this and these decisions.
Let me know what you think...

BONKUSDT 1D Chart Analysis | Bullish Momentum is coming...BONKUSDT 1D Chart Analysis | Bullish Momentum Builds After 0.236 Fibo Pullback
🔍 Let’s break down the BONK/USDT daily chart, focusing on the latest price action, strategic moving averages, RSI convergence, and volume dynamics for a complete bullish scenario setup.
⏳ Daily Overview
BONK is showing strong upward momentum, printing consecutive higher highs (HH) in both candles and RSI—a clear bullish trend indicator. After an explosive move, price is currently staging a healthy pullback to the key 0.236 Fibonacci retracement level (0.00003142), which commonly acts as a support platform during aggressive uptrends.
📈 Technical Convergence and Trend Structure
- 3SMA Support: The 7, 25, and 99 SMAs are all trending upward and stacked correctly, with price sitting comfortably above them. The 7SMA acts as immediate dynamic support, reflecting trend strength and buyer interest at every dip.
- RSI Dynamics: RSI just bounced from the 69–70 zone, confirming convergence with price action. The indicator made its own higher high in tandem with the candles, and now, as price pulls back, RSI is reentering the overbought territory—which often precedes renewed momentum.
- Volume Confirmation: Notably, volume surged as the trend accelerated, and is now tapering off during this corrective phase. This is a classic bullish volume signature, showing profit-taking by early longs but no major selling pressure, suggesting trend continuation likely after consolidation.
🔺 Bullish Setup & Targets
- First target: 0.00005376 — retest of the last all-time high (ATH).
- Next resistance to watch: 0.00003920, followed by the ATH region.
- Long-term target: 0.00009710 — an upside of 170–180% from current levels, mapped by technical extension and price discovery zones.
📊 Key Highlights
- Price holding the 0.236 Fibo retracement signals a shallow, healthy correction.
- 3SMA alignment confirms long-term bullish bias—actively supporting every dip.
- RSI and price are convergent, reaffirming uptrend strength; RSI’s move back into overbought could ignite the next price surge.
- Volume decreasing on corrections and rising during rallies—bullish confirmation.
🚨 Conclusion
BONK/USDT remains technically poised for further upside. The blend of higher highs, support at the 0.236 Fibonacci retracement, positive 3SMA structure, and RSI convergence all point to bullish continuation. Watch for renewed momentum as RSI reenters overbought territory and volume confirms the next breakout. Next targets: 0.00005376 (ATH), with a long-term projection toward 0.00009710.

SOL - Trend-Following Longs in the making!Hello TradingView Family / Fellow Traders. This is Richard, also known as theSignalyst.
📈SOL has been overall bullish trading within the rising channel in red.
Moreover, the orange zone is a strong demand.
🏹 The highlighted blue circle is a strong area to look for buy setups as it is the intersection of the orange demand zone and lower red trendline acting as a non-horizontal support.
📚 As per my trading style:
As #SOL retests the blue circle zone, I will be looking for bullish reversal setups (like a double bottom pattern, trendline break , and so on...)
📚 Always follow your trading plan regarding entry, risk management, and trade management.
Good luck!
All Strategies Are Good; If Managed Properly!
~Richard Nasr

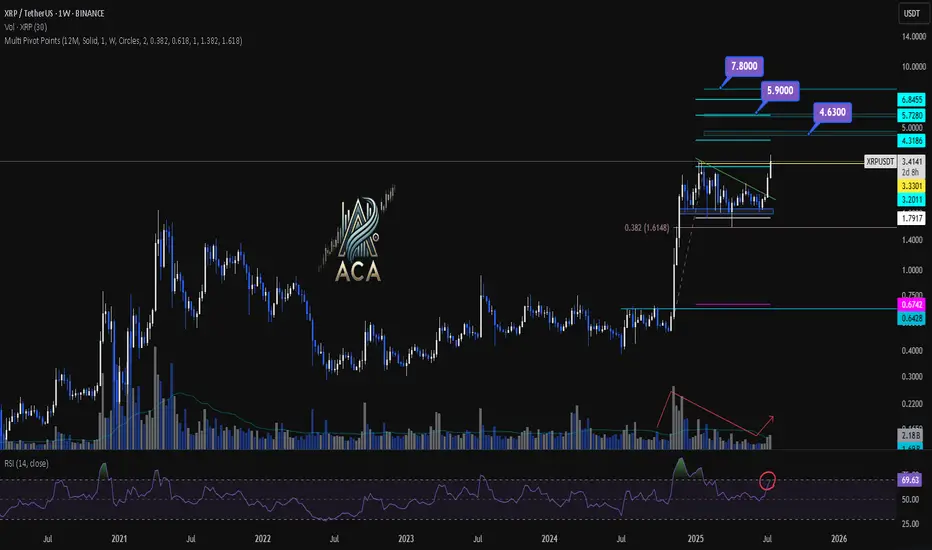
XRPUSDT Weekly Chart Analysis | Next Bullish MoveXRPUSDT Weekly Chart Analysis | Major Resistance Levels Align for Next Bullish Move
🔍 Let’s break down the XRP/USDT weekly setup, highlighting key technical signals and major upside targets for the next rally.
⏳ Weekly Overview
The weekly chart shows consolidation just below a major resistance, with price action tightening and preparing for a breakout. A recent correction found support near the 0.382 Fibonacci retracement level, which has acted as a springboard for renewed momentum. Notably, the R2 pivot point level aligns closely with this area, strengthening its importance as a decision zone for bulls.
🔺 Upside Targets & Confluences:
- First Target: $4.63 — This coincides with the R2 monthly pivot point and aligns with key Fibonacci extension targets, offering strong confluence for a reaction zone.
- Second Target: $5.90 — Our most realistic medium-term target, also backed by cluster resistance from both pivot analysis and fib projections.
- Final Target: $7.80 — This is the major Fibonacci extension level, marking the highest projected upside if momentum persists.
📊 Key Technical Highlights:
- Pivot Point R2 & Fibonacci Confluence: The R2 level reinforces a critical resistance, overlapping with the $4.63 Fibonacci target.
- Fibonacci Retracement: Price respected the 0.382 retracement during the latest correction, signaling healthy trend continuation.
- Volume Confirmation: An uptick in volume confirms that buyers are stepping in, supporting the bullish momentum.
- RSI Signal: RSI is entering the overbought zone, which typically indicates a strong surge in buying pressure and can mark the start of a momentum move.
🚨 Conclusion:
XRP is setting up for a major breakout as key technical levels align. Watch for a sustained move above $4.63 to unlock the $5.90 area, with a final potential push towards $7.80 if bulls maintain control. Volume expansion and an overheated RSI are both classic signs of an incoming momentum wave—keep your eyes on these levels for validation of the setup.