ONDOUSDT Daily Chart Analysis | Momentum Shift & Breakout LevelsONDOUSDT Daily Chart Analysis | Momentum Shift & Breakout Levels
🔍 Let’s dive into the ONDO/USDT daily chart and break down the latest momentum signals, key breakout areas, and targets for bulls.
⏳ Daily Chart Overview
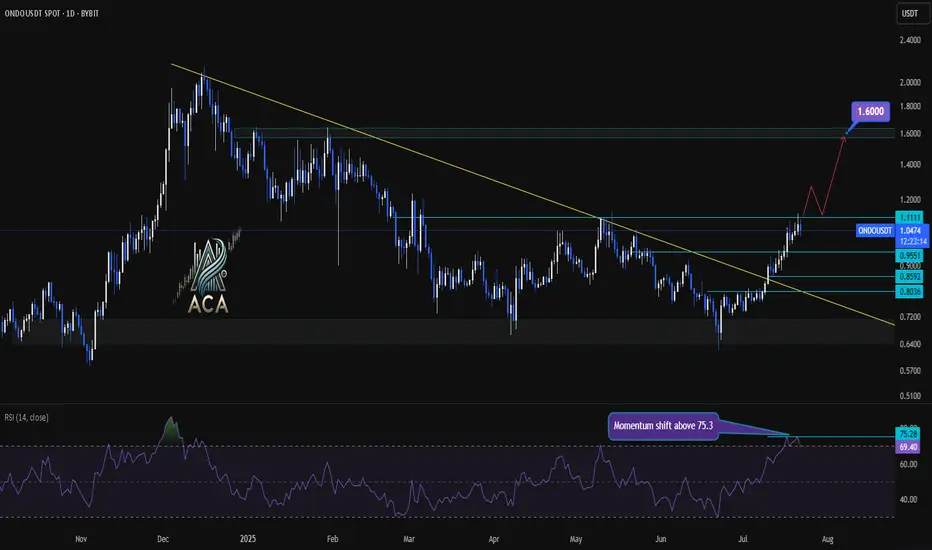
The daily trend shows significant recovery after prolonged downward pressure, with price action now testing critical resistance levels. A key descending trend line has recently been challenged, highlighting a potential shift in market structure.
🔺 Bullish Setup
- Momentum Trigger: The RSI has closed above 75.3, signaling a strong momentum shift and upping the odds for continued upside.
- Breakout Confirmation: Watch for a daily candle close above the $1.1111 resistance level. This would confirm a bullish breakout and could serve as a solid trigger for further upside.
- Trend Line Dynamics: The price has decisively broken above the major descending trend line, which had capped rallies for months—removing a significant area of supply and emboldening bulls.
- Upside Target: Once confirmed, this setup opens the door for an advance towards the $1.60 area, where the next major resistance sits.
📊 Key Highlights
- Daily RSI closing above 75.3 reflects strong market momentum and buyer dominance.
- A daily candle close above $1.1111 can be used as a bullish trigger.
- The long-term descending trend line has been broken, indicating a major momentum shift.
- Immediate upside target stands at $1.60, representing a clear resistance level for profits or further evaluation.
🚨 Conclusion
Momentum is clearly shifting in favor of the bulls as technical barriers fall by the wayside. For traders looking to position long, confirmation above $1.1111 combined with the powerful RSI reading sets the stage for a move towards $1.60—keep these levels on your radar as the setup plays out!
Bullrun2025
$BNB Chart Showing Bullish Flag Pattern and Price Will Hit +$750CRYPTOCAP:BNB Previously Chart showing Bullish Inverse Head and Shoulder Pattern and Gain Profit of Range. It's a Reversal Pattern .
Now Chart Showing a Bullish Flag Pattern and it's Continuation Pattern. Time to Bullish for BNB Coin for FOMC 10th July Thursday 2025.
The upsloping 20-day EMA and the RSI just above the midpoint indicate a slight edge to the bulls. If the $665 resistance falls, the BNBUSD pair could rise to $675 and then to $698.
Sellers are likely to pose a solid challenge at $698 because a break above it could propel the pair to $732. I'm guess BNB Price Breakout of ATH and $888 Mystery will Happen.
This optimistic view will be negated in the near term if the price turns down and breaks below the moving averages. The pair may then drop to $636.
NEWSBTC: BNB Price Gears Up for Upside Break — Will Bulls Deliver?
BNB price is gaining pace above the $650 support zone. The price is now showing positive signs and might aim for more gains in the near term.
BNB price is attempting to recover from the $620 support zone.
The price is now trading above $655 and the 100-hourly simple moving average.
There is a key contracting triangle forming with resistance at $662 on the hourly chart of the BNB/USD pair (data source from Binance).
The pair must stay above the $655 level to start another increase in the near term.
BNB Price Eyes More Gains
After forming a base above the $620 level, BNB price started a fresh increase. There was a move above the $645 and $650 resistance levels, like Ethereum and Bitcoin.
The price even surged above the $660 level. A high was formed at $666 before there was a downside correction. The price dipped below the 50% Fib retracement level of the upward move from the $650 swing low to the $666 swing high.
The price is now trading above $655 and the 100-hourly simple moving average. On the upside, the price could face resistance near the $662 level. There is also a key contracting triangle forming with resistance at $662 on the hourly chart of the BNB/USD pair.
The next resistance sits near the $665 level. A clear move above the $665 zone could send the price higher. In the stated case, BNB price could test $672. A close above the $672 resistance might set the pace for a larger move toward the $680 resistance. Any more gains might call for a test of the $700 level in the near term.
Another Decline? If BNB fails to clear the $662 resistance, it could start another decline.
Initial support on the downside is near the $655 level and the 61.8% Fib retracement level of the upward move from the $650 swing low to the $666 swing high. The next major support is near the $650 level.
The main support sits at $644. If there is a downside break below the $644 support, the price could drop toward the $632 support. Any more losses could initiate a larger decline toward the $620 level.
Technical Indicators
Hourly MACD – The MACD for BNB/USD is gaining pace in the bullish zone.
Hourly RSI (Relative Strength Index) – The RSI for BNB/USD is currently above the 50 level.
Major Support Levels – $655 and $650.
Major Resistance Levels – $662 and $665.
#Write2Earn #BinanceSquareFamily #BinanceTurns8 #BNB #SUBROOFFICIAL
Disclaimer: This article is for informational purposes only and does not constitute financial advice. Always conduct your own research before making any investment decisions. Digital asset prices are subject to high market risk and price volatility. The value of your investment may go down or up, and you may not get back the amount invested. You are solely responsible for your investment decisions and Binance is not available for any losses you may incur. Past performance is not a reliable predictor of future performance. You should only invest in products you are familiar with and where you understand the risks. You should carefully consider your investment experience, financial situation, investment objectives and risk tolerance and consult an independent financial adviser prior to making any investment.

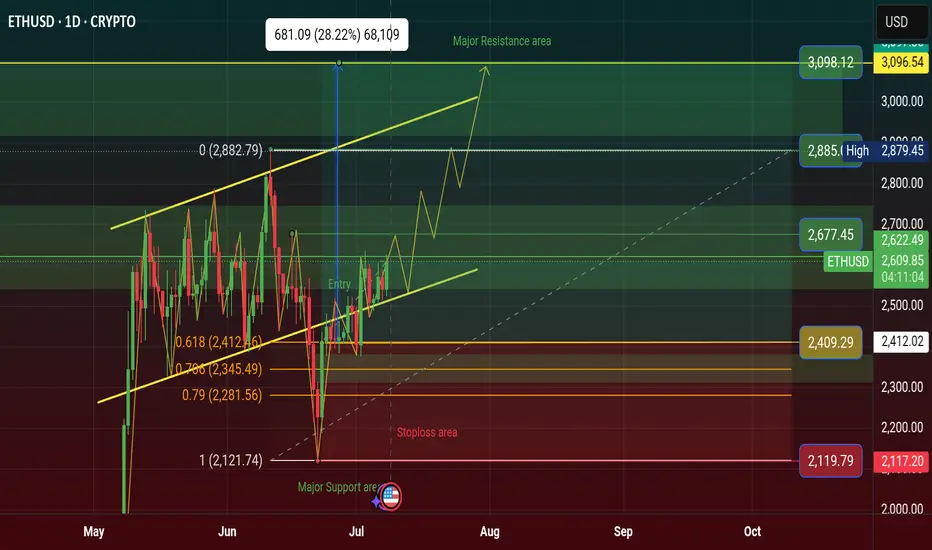
$ETH Price Will Rising $3098 in Q3, Bullish Flag Inverse AngleCRYPTOCAP:ETH price will Rising $3098 in Q3 in 2025, Price Showing a Bullish Flag Inverse Angle. it's a Reversal Pattern and Manipulation Price. See more on Chart.
Crypto News: An Ethereum address holding 900 ETH started moving coins Monday after spending nearly 10 years dormant.
The holder received these genesis coins in 2015 when ETH traded below 50 cents.
These pre-mined tokens were distributed to early Ethereum contributors before mining began.
Their current value reaches 2.2 million with ETH trading around 2,529 per coin.
This represents potential gains exceeding 5,000% from the original sub-dollar entry price.
The move follows similar whale activity, including a 27.6 million Ethereum sale in April.
Last week saw a Bitcoin whale move 8 billion after 14 years of hodling.
ETH remains 48% below its 2021 all-time high of 4,878 despite recent stability.
The holder technically isn't a whale, which requires a minimum of 10,000 ETH at current prices.
#Write2Earn #BinanceSquareFamily #ETH #SUBROOFFICIAL
Disclaimer: This article is for informational purposes only and does not constitute financial advice. Always conduct your own research before making any investment decisions. Digital asset prices are subject to high market risk and price volatility. The value of your investment may go down or up, and you may not get back the amount invested.
$LOT Price Showing Symmetrical Triangle Pattern & Breakout aboveASX:LOT is a League of Traders Trading Competition Platform. LOT is an Native token of this platform.
Every Trading Player Have LOT point and they convert to LOT token and get on there wallet. Who Join LOT Trading League for LOT point? The main competition is top level and get free price.
💡 TOKEN OVERVIEW ( ASX:LOT )
Market capitalization: 3.89 M USD
Fully diluted market cap : 25.90 M USD
Trading volume 24h: 2.89 M USD
All time high: 0.044869 USD
Circulating supply: 150.00 M
Max supply: 1.00 B
Total supply: 1.00 B
A new Native token Release on Binance Alpha and when it's release on Binance Coin than we will see more pumping this Native Token Price.
ASX:LOT price now at $0.026186 and this year 2025 I'm Prediction the price will be happened $0.45-$0.75 hit. If Biggest Tournament will start this year on this Platform. Than Possible to worldwide Tournament make more Pumping price. Because of the Big investor will become investment on this LOT native Token.
We have to decisions long-term investment this coin. The main thing is that some Coin will be scammed. But League of Traders Platform is the Legit of Cross Chain Trading Competition.
The Crypto Scammer will not Permission listed there token on the Top Exchange of Binance Market. #SUBROOFFICIAL
Disclaimer: This article is for informational purposes only and does not constitute financial advice. Always conduct your own research before making any investment decisions. Digital asset prices are subject to high market risk and price volatility. The value of your investment may go down or up, and you may not get back the amount invested. You are solely responsible for your investment decisions and Binance is not available for any losses you may incur. Past performance is not a reliable predictor of future performance. You should only invest in products you are familiar with and where you understand the risks. You should carefully consider your investment experience, financial situation, investment objectives and risk tolerance and consult an independent financial adviser prior to making any investment.

$BTC Price Showing a Bullish Flag Pattern & Breakout see chart..CRYPTOCAP:BTC Price Breakout of Bullish Flag Pattern. I'm guess it's going to the next Price Zone $115K and if Breakout thank going $122K price zone.
I was telling some coins that was saying Multiple Profit and now coins are driving on the way. There are coin is ETH, BNB, XRP, SOL, TRX, TON, SUI, ADA, ICP, ARB, XLM.
Ric Edelman Urges Up to 40% Crypto Allocation, Predicts Bitcoin Surge to $500K
Top advisor Ric Edelman recommends investors allocate up to 40% to crypto, forecasting Bitcoin could reach $500K with rising institutional demand.
Ric Edelman advises investors to allocate 10% to 40% of their portfolios to crypto, based on their risk tolerance.
Edelman predicts Bitcoin could reach $500,000 if just 1% of global assets shift into the cryptocurrency sector. His endorsement is viewed as a major TradFi signal, given his $300 billion asset management influence in the advisory industry.
Ric Edelman, the founder of Edelman Financial Engines and DACFP, has recommended investors shift a significant portion of their portfolio to cryptocurrency. In a recent whitepaper, Edelman advised allocating between 10% and 40% to crypto, depending on individual risk tolerance.
This guidance marks a break from the conventional 60/40 stock-to-bond portfolio model, which he believes is no longer practical in a rapidly advancing economic environment.
According to Edelman, conservative investors should hold 10% in crypto, moderate investors 25%, and aggressive investors 40%. He cited technological advancements and increased life expectancy as reasons to move away from traditional investment formulas. He emphasized that ignoring crypto means betting against an asset class that has outperformed all others over the past 15 years.
Bitcoin Price Could Hit $500,000 with Minimal Asset Shift
Edelman also presented a bullish projection for Bitcoin, suggesting it could reach $500,000. He explained that a 1% allocation of the $750 trillion in global assets toward Bitcoin would inject $7.5 trillion into the market. Based on current valuations, this inflow could significantly drive the asset’s price. He underlined this estimate as simple arithmetic based on supply and demand trends.
Edelman pointed to growing institutional interest and policy changes as key drivers for crypto’s rise. He highlighted that Tether, a major stablecoin, reported $13 billion in profits last year, surpassing companies like McDonald’s and Ford. He also noted that a pro-crypto political climate, especially following Donald Trump’s reelection, is setting favorable conditions for digital assets.
Disclaimer: This article is for informational purposes only and does not constitute financial advice. Always conduct your own research before making any investment decisions. Digital asset prices are subject to high market risk and price volatility. The value of your investment may go down or up, and you may not get back the amount invested. You are solely responsible for your investment decisions and Binance is not available for any losses you may incur. Past performance is not a reliable predictor of future performance. You should only invest in products you are familiar with and where you understand the risks. You should carefully consider your investment experience, financial situation, investment objectives and risk tolerance and consult an independent financial adviser prior to making any investment.

CHILLGUY Tight Range Play – Patience Could PayCHILLGUY/USDT Analysis – 6H Chart
CHILLGUY is currently consolidating above a strong demand zone and key support line. Price is squeezing into a tight range, showing signs of buildup after the recent uptrend.
As long as the support holds, a bounce toward the mid S/R levels looks likely. A strong breakout from this zone could fuel the next leg higher.
But if price loses the demand zone, it may trigger a deeper correction.
Stay alert — a decisive move is nearing.

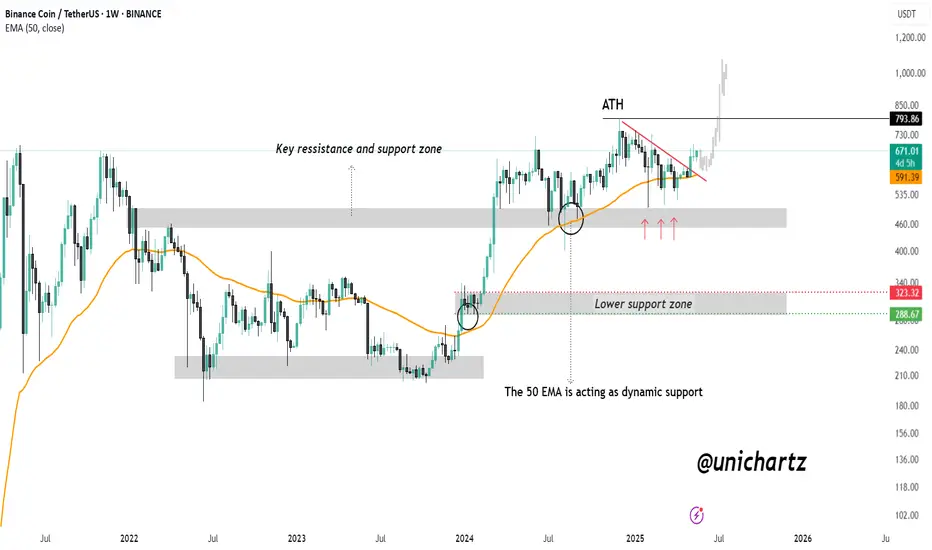
BNB Weekly Breakout: Road to $1,000?CRYPTOCAP:BNB is showing strong bullish momentum on the weekly chart. The 50 EMA is acting as a dynamic support, holding firm during multiple retests and providing a solid foundation for upward movement.
Recently, price action has broken above a key descending resistance line and successfully reclaimed a major support-resistance zone, turning it into a strong base. This area, which previously acted as a battleground for bulls and bears, is now supporting the current rally.
As long as BNB continues to hold above this zone and the 50 EMA, the structure remains bullish. With sustained momentum, a retest of the all-time high zone around $793 is likely, and a breakout above it could open the door for a move toward $1,000 and beyond.
DYOR, NFA
$ARB time to fly $1 this bull run 2025 and it's Last Wave...AMEX:ARB Time to Fly and Touching $1 this Quarter. I guess it will be happened and gain bonuses $1+ and $2+ if big investor entry on this token.
My Magic Indicator Say ARB Price have touch Yellow line. Previous Day, Bounce back to above Yellow Line and It's Bull Run 2025 for ARB .
From News: ARB Eyes Trend Reversal With Breakout Signal Above $0.45 This Week
Arbitrum is trading at $0.41 inside a falling wedge and a breakout above $0.45 might confirm a wide shift from its yearlong downward trend.
Arbitrum has formed a falling wedge with lower highs and higher lows now compressing price at $0.41.
If the price moves above $0.45 with strong volume this could confirm a new bullish pattern for $ARB.
The wedge has been forming since 2024 and a breakout may signal the start of a strong trend reversal.
The descending wedge pattern forming on the Arbitrum chart spans nearly one year, beginning from its 2024 highs near $2.50. Several failed rallies marked by red arrows define the top boundary, while green arrows at the base represent support retests. This structure has now tightened into a narrow apex where breakout probability increases significantly.
#Write2Earn #BinanceSquareFamily #Binance #BTC☀ #SUBROOFFICIAL
Disclaimer: This article is for informational purposes only and does not constitute financial advice. Always conduct your own research before making any investment decisions. Digital asset prices are subject to high market risk and price volatility. The value of your investment may go down or up, and you may not get back the amount invested. You are solely responsible for your investment decisions and Binance is not available for any losses you may incur. Past performance is not a reliable predictor of future performance. You should only invest in products you are familiar with and where you understand the risks. You should carefully consider your investment experience, financial situation, investment objectives and risk tolerance and consult an independent financial adviser prior to making any investment.

BTC bull cycle comes to an end.We can see it clearly on the chart. BTC has ended the 5 waves pattern in Elliot wave count. you can see it on the chart, you can see it on the MACD & RSI.
What we are seeing now is that because of Greed & Hype no one is selling bitcoin. the up-trend we are seeing now is the result of no sellers and Hype Buyers. This is a bull trap. We can see the divergence clear as day. Stay alert and dont let them catch you this time.

$BNB Surprised $678 Price Mega Big pumping & Touch to $700+ ✨ CRYPTOCAP:BNB Surprised $678 Price Mega Big pumping & Trying to $700+ Milestone again.
💫 From Breaking News:
• BNB Eyes $700 as CZ Pushes 90% Binance Chain Fee Cut
•Bhutan Partners with Binance Pay and DK Bank to Launch the World’s First National Crypto-Based Tourism Payment System
BNB price surged over 10%, hitting $642.92 after CZ’s 90% BSC gas fee cut proposal.
RSI reached 78.42, confirming strong bullish momentum and overbought conditions.
BNB may test $700 if Binance validators approve the proposed BEP-336 transaction model.
On May 9, Binance Coin (BNB) climbed to $642.92, rising over 10% in 24 hours. The price rally followed a proposal from Binance founder Changpeng Zhao (CZ) to cut gas fees on Binance Smart Chain (BSC) by 90%.
#Write2Earn #bnb #BinanceSquareFamily #MarketRebound #SUBROOFFICIAL
Disclaimer: This article is for informational purposes only and does not constitute financial advice. Always conduct your own research before making any investment decisions. Digital asset prices are subject to high market risk and price volatility. The value of your investment may go down or up, and you may not get back the amount invested.

$ETH Surprised $2.4K Price Mega Big pumping & touch to $3K ✨ CRYPTOCAP:ETH Surprised $2.4K Price Mega Big pumping & Trying to $3K Milestone again.
💫 From Breaking News:
• Ethereum Foundation Invests $32.65M in Ecosystem Growth
• Ethereum To Expand Network Capacity with Gas Limit Increase
Ethereum blockchain is preparing for a major upgrade that could make its network faster, cheaper, and more efficient. Developers have proposed raising the gas limit by 66% in a new development, from 36 million to 60 million units.
This change aims to improve the number of transactions the network can handle per block. This is to help users and developers enjoy smoother and more affordable activity on the blockchain.
Developer Says Testing Success Leads to Mainnet Rollout
Ethereum core developer Parithosh Jayanthi recently confirmed that the upgrade had passed early tests and is now ready for broader use. The new gas limit was successfully tested on the Sepolia and Holesky testnets. According to Jayanthi, the final rollout to Ethereum’s mainnet will begin shortly.
This is the second time Ethereum has raised its gas limit in 2025. The first increase happened in February, when the limit increased from 30 million to 36 million. These changes came after there hadn’t been any gas increase on the network since 2021.
#Write2Earn #ETH #BinanceSquareFamily #MarketRebound #SUBROOFFICIAL
Disclaimer: This article is for informational purposes only and does not constitute financial advice. Always conduct your own research before making any investment decisions. Digital asset prices are subject to high market risk and price volatility. The value of your investment may go down or up, and you may not get back the amount invested.

$BTC Finally $100K Surprised and Take Profit Done✨ CRYPTOCAP:BTC Surprise Finally Touch $100K Milestone again, All Take Profit and bonus Done.
💫 From Breaking News:
• Arizona Bitcoin Bill: Crucial SB 1373 Advances for State Bitcoin Reserve
• New Hampshire Becomes First to Approve Bitcoin Reserve—Will Other States Follow?
First introduced in January, HB 302, gives officials the ability to allocate state funds to both precious metals, and specific digital assets with a market capitalization of over $500 billion. That means Bitcoin, which, as of this writing, has a market cap of roughly $1.9 trillion per TradingView, is a prime candidate.
The newly enacted law states that any digital assets obtained must be kept using high security custody protocols. This can be done directly in a state managed multisignature wallet, via a qualified financial institution custody, or by investment in U.S. regulated exchange traded products (ETPs). Dennis Porter, CEO and Co-Founder of Satoshi Action, said:
“Satoshi Action drafted the model, New Hampshire engraved it into law, and now every treasurer nationwide can follow that roadmap. HB 302 proves you can protect taxpayer money, diversify reserves, and future-proof state treasuries all while embracing the most secure monetary network on Earth. New Hampshire didn’t just pass a bill; it sparked a movement.”
#Write2Earn #BTC #BinanceSquareFamily #MarketRebound #SUBROOFFICIAL
Disclaimer: This article is for informational purposes only and does not constitute financial advice. Always conduct your own research before making any investment decisions. Digital asset prices are subject to high market risk and price volatility. The value of your investment may go down or up, and you may not get back the amount invested.

BULLRUN 2025 LOADING? #Bitcoin Weekly Update
Bitcoin is bouncing from the 50 EMA on the weekly chart. Every time this has happened before, a strong rally followed.
The weekly MACD has also made a bullish crossover. In the past, when Bitcoin held the 50 EMA and the MACD crossed up, the price moved much higher.
Right now, Bitcoin is showing strong support and fresh momentum.
Stay alert. The next few weeks are crucial.
Retweet if you're bullish
#Bullrun2025 #CRYPTOMOJO_TA

$HBAR Near Key Resistance: Will the Bull Flag Explode?CRYPTOCAP:HBAR is trading within a bull flag on the 2-day chart, holding just below a key resistance zone that was previously support. The 100 EMA is also acting as a dynamic barrier here.
A breakout above $0.188 with strong volume could trigger the next bullish leg.
But if resistance holds, a short-term pullback might follow.
DYOR, NFA

ONDO/USDT Reversal Setup – Targeting Mid S/R Zone NextLSE:ONDO has broken above the key descending trendline, signaling a potential shift in momentum. The price is now heading toward the mid S/R zone, which will be a critical level to watch.
Currently, ONDO shows strong upside potential as it trades within a broader sideways range. If bulls maintain control, we could see a continuation toward the upper resistance zone.
Momentum is building — eyes on the next move.
DYOR, NFA

SUI Breaks Key Trendline – Bullish Reversal in MotionCRYPTOCAP:SUI has broken above the descending resistance line, confirming a trend reversal after weeks of downward movement. This breakout came after price bounced from a strong support zone, establishing a higher low structure.
The breakout is also supported by a move above the 50 EMA, adding strength to the bullish case.
DYOR, NFA

COTI WAVE 3 is coming COTI has completed its initial phases, Wave 1, 2 of Elliot waves and is preparing for Wave 3📈.
Also COTI V2, released recently, aims to revolutionize web3 privacy.
COTI’s market capitalization is $96 million, suggesting substantial potential gains during the upcoming bull market🚀.
This information is not financial advice. Conduct thorough research before making investment decisions.

This Chart Screams Strength — Are You Positioned?The total crypto market cap is currently showing a very strong technical setup. It’s holding firm at a major long-term rising trendline, which has historically acted as a launchpad for massive bullish moves across the market. Additionally, the 100 EMA is providing solid support, further reinforcing this zone as a key demand area.
We’re also seeing a bottomed-out Stochastic RSI, now starting to curl upward — a classic early signal of momentum shifting back to the bulls. Although the market is still sitting just below the long-term resistance line, this type of structure often leads to strong breakouts once confidence returns.
If this trendline support continues to hold and the market cap begins pushing back toward the $3 trillion mark, we could see a major surge in altcoin strength. Historically, this is when altcoin capital rotation picks up and narratives gain momentum. Overall, the crypto market is flashing strength — and this might just be the calm before a powerful altcoin rally.
Thanks for reading! Please do like and follow us for more updates.

Chart Breakdown: Gold, Bitcoin, SPX ComparisonThis chart compares the price action of Gold (candles), Bitcoin (purple line), and the S&P 500 Index (red line) over a multi-year period. Several key phases and correlations are highlighted:
🟢 Key Observations:
1. Gold Bull Run (2019–2020):
Gold experienced a strong upward trend starting in mid-2019.
This bull run led to a peak in August 2020, right before the final phase of the Bitcoin bull market.
2. Bitcoin Bull Run (Highlighted in Blue):
After Gold peaked, Bitcoin entered its final bull run phase, accelerating dramatically.
The vertical yellow line (August 3, 2020) seems to mark the transition point where capital started rotating from Gold into Bitcoin.
3. Gold Correction + SPX Correction (Post 2020):
As Bitcoin surged, Gold corrected downward, reflecting a rotation of capital or risk preference.
At the same time, the S&P 500 also experienced a temporary correction, possibly reflecting macroeconomic uncertainty or shifting investor sentiment.
🟡 Current Market Structure (2024–2025):
4. Gold Potential Peak Again?
A similar structure appears to be forming now: Gold is peaking again, just as Bitcoin and equities are at critical levels.
The chart raises the question: "Is Gold topping again, just like it did in 2020?"
5. Possible Repeat Cycle:
If history repeats, we could be seeing the early stages of a new Bitcoin bull phase, following Gold’s strength and peaking pattern.
SPX appears to be climbing steadily, indicating a risk-on environment—similar to what happened during the last crypto surge.
🔁 Macro Interpretation:
Gold → Bitcoin Rotation: Historically, a peak in gold has preceded a sharp upside move in Bitcoin.
Risk Shift Timing: Both gold corrections and SPX slowdowns tend to coincide with the start of aggressive crypto bull phases.
This could suggest that a new Bitcoin leg up is near, especially if gold starts to decline again from current highs.
📌 Conclusion:
Your chart reflects a macro rotational pattern:
Gold strength → Peak → Bitcoin acceleration → Gold/SPX correction.
If this cycle plays out again, the current peak in gold could signal a new phase of momentum for Bitcoin, just as it did post-2020.

MAJOR BULL RUN RALLY INCOMING !!! Starting From MAY 2025 !!!On Big Picture starting from 2020....
Inverse H & S was formed... after breakout we got pull back & then it started 8 months rally from September 2020 To April 2021.
Then after deep bear market, we got Inverse H&S... after breakout, we got pull back & then it started 8 months rally from September 2023 To April 2024.
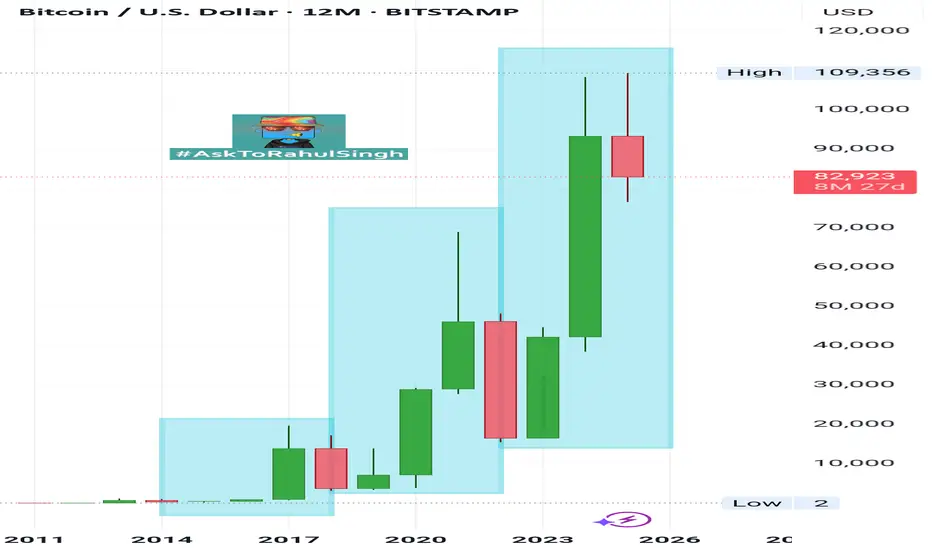
Now. we got big H&S... after breakout, we are getting pull back & now we are almost near at support level of H&S. From around 74-66K region, reversal bull run rally is expected which will most probably start from next month ( May 2025) and around after 8 months (October-December) we would be roaming ATH around 300K !!! which tags exactly at major resistance line. By copy pasting 2021 rally's candles pattern on current scenario, we can see exactly how things are going to shape in upcoming months.
Lets Hope For The Best !!!

#Bitcoin Yearly Analysis #Bitcoin Trading around $83.6k
Now, As per Weekly Chart Analysis-
If you go for Bitcoin 4 years of Cycle of #Halving to #Halving, it includes always #Bullish #Bearish & Stable Zones of Bitcoin & #Altcoins tradings..
Now, as per yearly cycle..
Bitcoin moved always as per 3 Green & 1 Red Cycle, as per that scenario 2023, 2024 & 2025 is Green Candles year & 2026 will be Red Candle year of #BearishZone.
So, this seasons #BullRun last phase will be starts around August onwards to Dec-Jan. 2026 and after that market will be go under deep #BearishZone.
So, don't be panic at hard, that's the last opportunity time frame of 120/150 days, in which you will be make your again entry points on hard max. time around june-July 2025 at last for #Bitcoin Last time Lower-Low of approx. FWB:65K -67k.
Anyways,
Always #DYOR and Trade Wisely by using of #StopLoss strategy... 🙏
$BNB Price Travel $888 Price Level Area and see more chart CRYPTOCAP:BNB OVERVIEW
ENTRY AREA IS $613 AND STOPLOSS $500 BELOW, LAST TRAVEL $888 PRICE LEVEL IN 2025
Bubblemaps Launches Token Generation Event on BNB Chain, Sets Fundraising Goal of $800K
According to an announcement from Binance, the event, which is exclusively hosted on the BNB chain via PancakeSwap, will run from 8:00 AM UTC to 10:59 AM UTC.
The TGE offers investors the opportunity to acquire 40 million BMT tokens priced at $0.02 each as the project team tries to raise $800,000 in BNB to fund further developments. This event would distribute 4% of Bubblemaps’ total supply of 1 billion tokens in return to participants.s
The project team noted that each wallet’s contribution would determine its share, which is proportional to the total BNB deposited. There is a participation cap of 3 BNB per wallet to ensure fair distribution.
Binance’s Pascal Hardfork to Enhance BNB Chain – Key Features and Price Impact Table of Contents Announcements / Trading Analysis
Binance’s Pascal Hardfork to Enhance BNB Chain – Key Features and Price Impact BNB.
Binance’s Pascal Hardfork to Enhance BNB Chain – Key Features and Price Impact
What the Pascal Hardfork Brings to BNB Chain
BNB Price Action and Market Predictions
BNB Chain’s Future Upgrades
Conclusion
March 11, 2025 – Binance’s BNB Chain has scheduled the Pascal Hardfork for March 20, bringing significant upgrades, including Ethereum compatibility on the mainnet. This move aligns with BNB Chain’s broader 2025 roadmap to enhance scalability, transaction efficiency, and decentralized governance.
The Ethereum EIP-7702 implementation enables gasless transactions, batch approvals, and multi-signature support, making it easier for users to interact with decentralized applications (dApps) on BNB Chain. The upgrade also activates BEP-439, which improves transaction security through BLS12-381 curve verification.
What the Pascal Hardfork Brings to BNB Chain
BNB Chain developers have emphasized the importance of this upgrade for Ethereum Virtual Machine (EVM) compatibility, helping bridge the gap between Binance and Ethereum ecosystems. Key benefits include:
Enhanced User Experience – dApps can now pay gas fees on behalf of users.
Stronger Security – BLS12-381 verification ensures secure smart contract execution.
Faster Transactions – The Pascal Hardfork sets the stage for future updates that will reduce block time.
Community Governance – The “Vote to List” and “Vote to Delist” mechanisms allow BNB stakers to decide which tokens stay on the BNB Smart Chain.
The upgrade requires node operators, validators, and exchanges to update to v1.5.7, or risk desynchronization from the network.
BNB Price Action and Market Predictions
As of writing, BNB trades at $564.56, fluctuating within the $550–$575 range.
Analysts observe structural shifts, with key resistance and support levels shaping the next price movement:
Bearish scenario – If BNB fails to hold $550, it may decline further to $525 or even $500.
Bullish scenario – Holding above $550 could push BNB to $600, with a potential breakout to $650.
BNB’s previous high at $725 indicates strong resistance, and a rejection from $575 may confirm further downside. However, if momentum shifts, the upgrade could help BNB regain ground amid broader altcoin market movements.
A distinctive feature of this TGE is the immediate tradability of tokens post-subscription, eliminating traditional lock-up periods. Investors can trade BMT tokens immediately after the event on either Binance Wallet’s DEX or directly on PancakeSwap. This real-time liquidity is a bold play, designed to attract traders and investors eager for quick action.
#BTC☀ #BinanceAlphaAlert #BinanceSquareFamily #Write2Earn #SUBROOFFICIAL
Disclaimer: This article is for informational purposes only and does not constitute financial advice. Always conduct your own research before making any investment decisions.

$XAU TAKE PROFIT 4 DONE & Price Serged 9.79% ~ $3005 ATH NOW TVC:XAU TAKE PROFIT 3 DONE & Price Serged 9.77% ~ $2,963 ATH NOW
Disclaimer: This article is for informational purposes only and does not constitute financial advice. Always conduct your own research before making any investment decisions. Digital asset prices are subject to high market risk and price volatility. The value of your investment may go down or up, and you may not get back the amount invested. You are solely responsible for your investment decisions and Binance is not available for any losses you may incur. Past performance is not a reliable predictor of future performance. You should only invest in products you are familiar with and where you understand the risks. You should carefully consider your investment experience, financial situation, investment objectives and risk tolerance and consult an independent financial adviser prior to making any investment.
