BTC Dominance - BTC One time buy opportunity (5th-8thOct)Lagging and leading indicators point to the possible sharp decline to the long term support trendline in the coming 3 days. Supplemented by TD sequential sell signal on 4H chart!
Could we see a hanging man patter on BTCUSD chart?
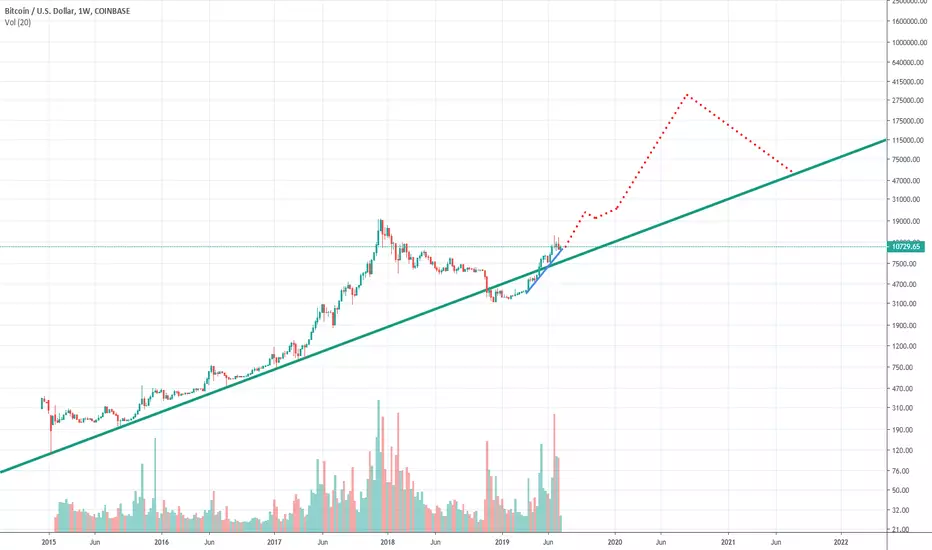
Check out the BTCUSD mid term TA thoughts.
Please hit the like button if you like the idea and make some gains!
As always not a financial advice, rather a moon one!!
Bullrunincoming

READY FOR NEXT BULL RUN ? #ETHLadies and gentlemen, I present Eth in a bigger vision !!
We see in the graph that the volumes coincide, ATR is similar and the possibilities of a bull market exist given the numerous projects based on Eth.
New ATH we arrive!


a wish come true ? When we have been watching Matic day after day,
it might look like a wish come true and we wish
this is the lowest price reached by this
interesting token.
When we look at a 5 min or a 60 min Chart,
it is like having a microscopic view of a big thing
what is clear here is that Matic is holding its value here,
and that gives us great hope.
Please find out more about any instrument when you decide to invest your hard earned money. This is my personal opinion, not to be taken as financial advice.

BTC USD Macro AnalysisTrying to find out where the next major time resistance zones may lie by using the break below 6k, and the break above 5k for the time fibo measurement. The 1.618 trendline falls precicely on the local high (end of June), also the 1.272 falls on the candle that broke above 6k. This makes me beleive the next time fibonacci trendlines will play a role in bitcoin's future market cycles. The regular fibonacci and fibonacci fan should also indicate support and resistance levels.
Not an expert, not financial advise.
Biffy

Bearish crypto-market in the works!as you can see, XRP has formed a bullish pennant and now with the triple bottom at play the pattern shall be fulfilled until it reaches the key level of 0.269000 before it melts to the likes of 0.24800, and even lower if the ground holds.
i believe the market will see a tap of the 0.22, 0.20 and the likes of 0.18 before and the at the early stages of the launching of BAKKT before the market puts on a miniature bull run to prepare us for the upcoming 2020 bull run.

It can be called today: The Bitcoin BullRun has started! BullishOn the weekly Time Frame, You will notice this symmetrical triangle created by the 2017 XBT Explosion. Triangles are continuation patterns which means: since BTC was on a move up to create this triangle, let the price bounce around against the walls of the triangle for a bunch of months. Between mid fall to mid winter, Expect a bounce from 4K to 5K and then ultimately a 20K retest.
What this means is to find a good place to short this and then go long at the bottom and enjoy the ride. Be sure to take out profits on the way down and on the way up. The Bitcoin HALVING which is taking place in MAY 17, 2020, would provide a great catalyst to propel the price to at least 20k again.
Do not long until btc hits the bottom between 4k - 5k! There is a (blue) 786 Fibonacci line around $4800 which it should bounce of and can use it as support But be careful, because this could even wick to 2700. Layer in your longs and never go all in!

Bitcoin macro view + Elliot waveSimple and easy to see the cycles in this chart. Right now we are still in accumulation zone. Which is not gonna be for long. We are about to start wave 5th which is the most verticle and parabolic wave in cryptos. We gonna see ATH broken sooner than most of the retailers think.
Although for a short period of time I see price dropping to anywhere between 0.618 & 0.786 before shifting higher. On monthly we didn't get nowhere near the 0.618 which makes me believe we will see it unfolding in coming 2-4months. My personal monthly pivot is OCT/NOW before we see this shift to super bullish.
Sunny days are coming for all of the crypto community and bag holders. On the other hand, if we drop to mid 6s, people could lose confidence and panic sell all they have. This is the main reason why we will get there, to shake out weak hands and move parabolic before people start to jump on the train again.
Stay safe out there.

Quick XAUUSD restest to 1528 then slight retrace before BULL RUNIt looks like gold wants to retest 1528 after the false breakout @ 1535. Bull will start the market this afternoon then bears jump in Monday morning for a retest to 1505-1500. After the support level of 1500 it should turn bullish back to the current price of 1515 then bull run to 1550! get ready for higher highs!!!!!!

Bitcoin Plan A, PlanB(081419)When we talk about plans, it needs to be two ways. because, Plan A always do not work. PlanB is needed.
exactly, what we need for btc now.
so plan A.
price dropped to 10.5k level. and from 10.3~10.5k, i assume there will be a bounce to 10.7~10.8k level.small bounce, but we can see a falling channel, correctional wave is taking place. also that area, is daily ichimoku cloud resistance as well as daily base line resistance. so, mostly likely i think, another day of dropping along the channel support, and shoot upwards. i am in longs now again, and plan to add up till 10.3k if drops more.
and along the weekends, after the bounce, i assume more downwards after weekly bearish close. i think, whales
would close it bearish, under 10600 next monday. it will indicate drop to bottom of the trend line to 9.7k~10k
area, where a support from 7k is in, also acting as triangle.
at that point, i think price can grow to 10.8k~11k. and mostly likely drop to 10k mid levels, and stay like that
and grow from october, or November.
but all this is in act, if 9.7~9.8k is supported. if that breaks plan b is in play, where btc can drop to 7~8k levels.
that is not impossible, even with 3d GK at 50/200ma. it could be making a bigger triangle after all.
so for now, lets trade plan A, and see if plan A works out. if price drops lower then 9.7k levels and close daily,
that is where we stoploss, and wait for lower prices, as plan b is intact.
then, peace!

Xrp Longterm PitchforkLike always, some OPIUM for all xrp lovers.
I had this pitchfork drawn on my chart for months now, I thought I'm gonna share it with you all.
XRP is too easy to predict looking at this chart. Using LOG chart it's clear what's next.
Any spikes below lower warning line should be the bottom for this cycle. Very safe play would be loading on XRP after it breaks 0.70$ on Monthly. Less safe play is wait for that monthly close above lower warning line and enjoy the flight to 251$. For those who are skeptical, look up my curve pattern on xrp (10-12$ is on the radar).
Short term we might see spikes to 0.24-0.26$ region to capitulate.
THIS IS NOT A FINANCIAL ADVISE GUYS. I post what I see. Not gonna get deep into possibilities, probabilities and other nonsense. I look at this chart and this is what I see. Target is inverted fib relationship of recent wave up.

WTC BTC - Macro analysisWaltonchain looks like it might get a bit of a bounce by springtime... the fibo fan shows the decrease in bearish momentum, the horzontal fib shows there the cycle should reverse, and we also see lots of volume showing on the vpvr at the 0.236 fibo trendline which could indicate a bottom, but we are still yet to see any real upwards direction.
If the price can break above the moving average resistance then i expect it may try to test the 0.382 to 0.618 fibonacci zone, but personally I would not trade below the moving averages.
Not an expert, not financial advise
Biffy

ETH/USD Buying opportunity on the Horizon Ethrium has descended to a minor trend line that has been respected 3 time, we are possibly looking at a bull-run to the $365 region all we can do right now is wait for the trendline to be retested but on the off chance that the trendline is broken we might see the crypto rally further to the $152 region for a retest to get inline 78.6% Fibonacci level.
To keep up to date follow me on telegram: t.me
and twitter twitter.com
KRAKEN:ETHUSD

EUR/USD Bullish ?The EUR/USD seems to have a bullish prospect it has bounced of key resistance levels and it struggling to break the daily trend line, a potential bull run is on the horizon
OANDA:EURUSD

When Alts Season Sir..!!Altcoin Dominance
When #AltSeason?
- Alts Dominance Holding the Support & Still Inside the Wedge So Breakout Expected in Coming Days.
- If Breaks the Falling Wedge then We Can Expect Mini Bull Season In Coming Days.
- Alts Getting Ready to Bounce Back..
- Buy & HODL Your Strong Alts.
Bitcoin Dominance..!!
BTC Dominance is Decreasing So It Good Sign For Alts.
Hit Like On Idea For Support.
Thanks

Possible Bull Run On Ripple XRP/USDPossible Bull Run On Ripple XRP/USD,
The Crypto currency has reached a major support zone that may trigger the bull run to $0.45 and possibly $0.60, if you are in it for the long run this maybe a goodtime to buy the crypto. visit my telegram for signal t.me

BTC possible rejectionPossible rejection around 11,400.. but will see what happens 11,800 and 12,000. I will remain bearish until support above 12,555.


MACD zero line crossover + Bullish divergence on the 30min chartMACD zero line crossover and Bullish divergence on the 30min chart could indicate a return to the positive uptrend in $BTC price. Could be the correction is over right now.


Bitcoin Big BULLRUN on the way Going to the Moon !!BUY & SELL As Per Above Given Chart or
You Can Also set Own Risk reward.
Let see what Will be Next Move.
Warning- I m Not a Financial Advisor this idea Only For Educational Purpose Only.
Thank You !!

Electroneum Uptrend ConfirmedHello my beautiful people from beyond. I'm going to keep this short and to the point. As I pointed out last time on the daily time frame, ETN has opened and closed above the indicated blue trend line for the 7th consecutive day, which is super bullish. Also, we are currently trading above 21 EMA. The ADX and the stochastic are showing strong bullish signs. On May 14th we touched down at the lowest point of the year, which I was calling for a bottom. I also mentioned we needed to test it again and sure enough on June 3rd we retested and created our first higher low. Now we are working on creating a higher high from May 17th. At this rate we can possibly see 85 sats before July.
This is not investment advice. This is purely for educational and entertainment purposes.
Awareness618
