it's bull trap I guess . be carefulwxy correction
w = an ordinary zig zag
x = as same as w but smaller
y = flat pattern ( running - ordinary or expending we'll see)
not suggesting open short position or if you want , open with low leverage
Bulltrap

BTC Update, 4hr ChartBTC performing just as planned, pump to 49.9k-51.1k on the plate maybe even 53k, but a huge dump to 30 follows that afterwards ;)
if u guys are in profit on some coins at this point i recommend u to take them and sit in usdt's bcz this is gonna be a long ride to the bottom ;)

Bitcoin Losing Momentum (Bull Trap)Simply, when bitcoin correction touches MA 50 and death cross with EMA 50 then bitcoin will dump. In my previous analysis Bitcoin is in bearish crab and decreasing volume.
If Bitcoin can break out from $52k, it will be surprising to me because the volume is not enough to break out $50k.

BTC Bull Trap IncomingIf you don't understand this graph but you are invested in crypto, I feel for you. I was there once and I am sorry about all the money you are about to be "confused" about. Long term this asset is still bullish in my opinion. Although a bearish trend is still in the near future. I don't recommend anybody make investments without doing their own research. We will have some weeks of up and down price action, but these lines have been accurate for months now. I have not posted on here because I have been receiving requests to get paid chart analysis individually for certain clients. That has taken up most of my time. I am giving this chart for free and I hope you take it seriously. Happy trading!!!

Dead cat bouncesthe dead cat bounces difference from the ATH marked, let's see which one plays out this time,
btw made some color changes in the chart ;)

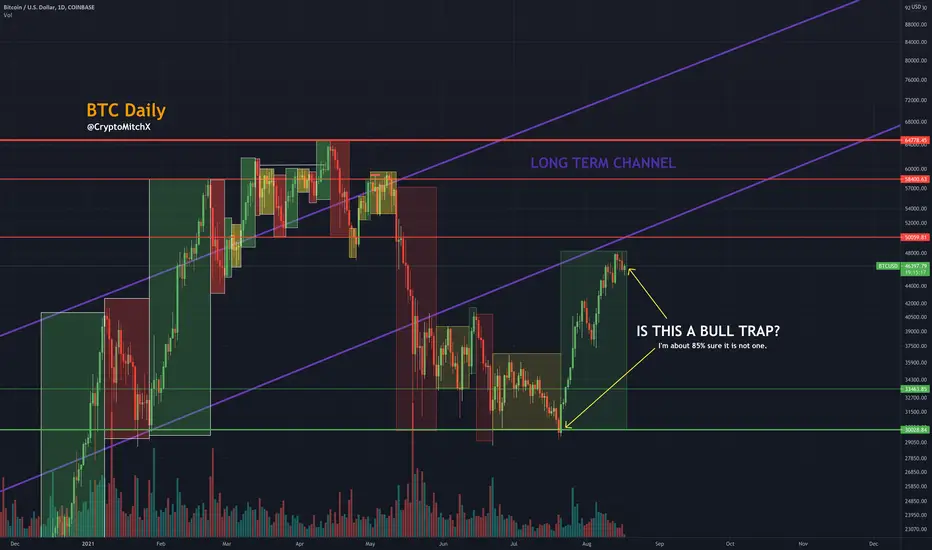
85% sure this is not a Bull Trap.Fear and Greed Index holding steady at 72
Bitboy Crypto says it's not a bull trap
Momentum is building steadily.
Timelines of other analysts predict the end of the bull run being Dec-Jan.
BTC Short Above 50KThis is just an idea I've been entertaining for several days now, not financial advice. If BTC breaks above 50k, a ton of people would FOMO in because the price moved above a major psychological level for many people. But, if you look at the chart, there is obviously some heavy resistance between 50400 and 51500, which the price will probably reject off of IMO. This should be similar to when BTC broke below 30k for the first time, everyone thought it was going to zero, but there was obvious support at 28800, which we bounced off of. Or when BTC broke above 40k recently and everyone thought it was going to the moon, but really there was a lot of resistance between 40500 and 41000, which the price rejected off of and quickly dumped to 36k.
I will take this trade if the price is already overextended on smaller timeframes (5m, 15m, 30m) and there is low volume after breaking 50k

#BTCUSDT Bulltrap coming soon, beware next few weeks!!*Hi guys, nice to come to my signal!
- August 15 shows BTC price recovery signal from $30k to $47k. We've had 4 weeks of growth and haven't seen a bearish candle this time around?
However, the $49-55K price zone will most likely end the BTC bull cycle, it could be a bull trap zone for the bulls. We should look objectively at the downtrend on the weekly frame.
- I hope for sustainable growth, however, I do not believe in whales, because they are always ready to kill all the inexperienced people in this market.
Above is the warning of the downtrend and the next trend on the weekly frame.
Wishing you all a happy Sunday.
My wisdom, from chalynguyen.

[UPDATE ETH] We are not in a BULL TRAP! Focus on the monthly!
Recap, why this is not a bull trap?
1) Hit an all-time high on the monthly
2) Stock RSI still super powerful
3) EMA ribbon clear uptrend

Where bitcoin can go, bull run 2.0 or another mega bull trap?BTC look tries hard to break the resistant MA 200 and make bearish crab pattern. I think BTC will go to retest the previous neckline HNS and in that situation BTC whether to continue bull run 2.0 or mega bull trap. I dunno why I still believe BTC is in a bear market because the volume is not enough to push up BTC.
*Some idea from Skyrock Signal

The bull trap has started !A new falling wedge has been formed just after the rising wedge which is a very very bearish sign in longterm but for the short term you can expect a slight bull ascension and then the true crash start !

BTC.D 🚀Hi everyone,
wish y'all have a profitable life 🍀
📍 I can see some raise in Bitcoin's dominance in parallel with the Bitcoin price growth.
⚠️ BUT, I still am not completely sure if this growth is smart money or a possible bull-trap, however I trade EXTREMELY carefully nowadays, plus I need to see the 44k zone to be broken and watch the volume indicator CAREFULLY.
📌 I personally think that the 50% zone needs to be tested!
⚠️ This growth is not a good NEWS for the Alt-coins.
THIS IS NOT A FINANCIAL ADVICE
PEACE 🍀🕊

This is your last chance to sell high !The BTC has formed probably his last bull formation Called a falling wedge It is known has a bull sign but in this case it's so small that it's simply most likely a bull trap Be aware !
(also i'm aware of the typo it's rising wedge not risind wedge !)

How to use "Auto Trendline and Breakout Alert" IndicatorIn this tutorial, we will learn how to use the "Auto Trendline & Breakout Alert (Linear / Log)" indicator.
Note: You can find it in the scripts section of my profile
Auto Trendline & Breakout Alert(Linear / Log) Full-Version by BobRivera990
Overall Introduction
This indicator is the best tool for breakout traders.
Drawing and evaluating the trend lines of multiple charts in different time frames is a very time-consuming and tedious task. In addition, being aware of breakouts in the shortest possible time requires constant monitoring.
With this tool, you can draw and classify trend lines in a fraction of a second and by placing an alert on any chart, you can receive notifications about breakouts, wherever you are.
The classification of trend lines is done based on the reaction of the price chart to the trend lines and the analysis of the trading volume .
This indicator is designed to reclassify trend lines with each reaction of the price chart. These lines are classified into 6 levels and these levels are distinguished by different colors. Thus, any touching or crossing of the price chart can make a difference.
Features
This indicator is designed for use on both linear and logarithmic scales. It works linearly by default. If you are using a logarithmic chart, enter the settings menu and set the chart scale parameter to “Log”.
The indicator is equipped with the volume status tool to identify and avoid false breakouts. Note that you can't completely avoid false breakouts, but you can minimize risk and loss. I have already published volume status as a separate script.
Several filters are provided to customize alerts. You can limit alerts based on the level and strength of broken trend lines , volume status, and type of breakout (Cross-Over, Cross-Under, or both).
The last breakouts panel gives an overview of the current market situation. You can activate it in the settings menu. the figure below shows the panel:
How to setup
There are many parameters in the settings menu, but two are more important. One is “Chart Scale” and the other is the “Max Operational Range Length".
Set the “chart scale” parameter according to the chart, otherwise the trend lines drawn by the indicator do not match the price chart.
If you are using a linear chart, select the "Linear" option or if you are using a logarithmic chart, select the "Log" option.
Max Operational Range Length Limits the range of the price chart that is processed by the indicator.
By increasing this parameter:
The strength and durability of the trend lines increases.
The number of breakout signals decreases.
The importance of breakout signals increases.
The indicator processing load increases.
The best range for "Max Operational Range" is from 300 to 1200,Change it until you get the best view possible.
Also by changing the "Filter" parameter from 1X to 5X, you can reduce the clutter in the chart.
The following figure shows the results of correct and incorrect settings:
Use it well...

BTC Bull Trap ?I used to do an analysis using Elliot Wave theory, if BTC manages to break out of the triangle pattern, chances are it will only reach 40k. and now there is a very unnatural bull with no correction of the elliot wave. so this can be said BULL TRAP. LET WE SEE
when i look at daily time frame, from the MACD indicator, it is certain that the current bullishness cannot be said to be really bullish like what happened at the beginning of 2021.

Bull TrapThe chart speaks for itself. These are patterns I've spotted and since they are reoccurring the likeliness of the same thing happening this time are well likely. Although I'd like to know your thoughts in the comment section.

Closer Look At The Bull Trap In The MakingLet's look at the overbought area and the bull trap in the making. With "the talk" is now over, price started struggling to cross above the old weekly lows and got rejected twice as a sign of weakness. Coincidentally few days before "the talk", JP Morgan unleashed their customers from buying GBTC crypto funds. Is this the demand we were waiting for? In other words, are these the people being trapped right now?
Probably yes.
I'm expecting a short term weak uptrend followed by a down move below 30k.
Best!

Stop Loss HuntingInstitutional investors have a profound impact on financial instruments prices because of their large volume trading activities. They can greatly impact the price of financial instruments, however making a material impact and hence decreasing liquidity to the point where there may be no one to take the other side of the trade is not something they desire. To fill their large in size orders with better price levels, Institutional investors need liquidity, they cannot just enter a trade at once, but they split trades over time and slowly have to build a position by hunting for liquidity. One of their strategic approach and the best way to get liquidity without making a material impact of the price and get filled in better price levels is Stop Loss Hunting .
A stop-loss order is an order placed to buy or sell a financial instrument when it reaches a certain price with the aim to limit loss on a position or protect profits.
Where do we usually place our stop orders? For a long trade example, usually we set them just below a support level, a trend line, a longer-term moving average, previous day low or a specific ATR percentage etc, which are highly predictable.
Institutional investors simply need to trigger stop loss orders of thousand of traders and since a key level is borken new traders joins by entering positions, making them take trades in the wrong direction, which as a result creates a huge supply with enough liquidity to absorb Institutional investor's demand with better prices
Some examples
Stop Loss houting can be observed frequently

I sold My Car And I'm NOT Buying Bitcoin!My wife just got a new job and we now have a company car! There's no point in keeping our car, because it's a deprecating asset. However, as much as i want to buy more Bitcoin with this cash, i'm just not buying now and here's why;
If you look at the downward channel, you'll see that the last time price went above, ended up with a mark down. It's way too risky to buy here right now. This is a bull trap at it's best.
So, let's review my bullish case;
1- Break the triangle (and make sure it's not a bull trap)
2- Break $37k
3- Break $41k
Even if the triangle looks like being violated, it just means it's in the overbought territory. Whenever i bought the overbought condition, i lost. Instead, i'll assume this violation is a bull trap and wait for the next oversold condition which is below 22k! That's 35% down from current price and once it reaches there with a climactic action, it won't stop until everyone believes Bitcoin is dead.
Why have a nightmare?
So, here's the scenario i'm buying;
Given we are in redistribution, not accumulation;
1- This current moment is last point of supply (LPSY)
2- Markdown will follow down to December 2020 lows at $17.500
3- Start sideways accumulation verified with net buying activity on the volume profile
4- The spring event occurs and verifies with change of character, stong volume
5- I buy (Else, i wait for another drop)
6- Price rallies to 80k in November
7- Evaluate sideways action whether it's distribution or re-accumulation.
8- Sell with 4x profit if it's redistribution, else ride until 100k and above!
Why 80k? Read my recent analysis:
Ofcourse it's too early to give price target, we will need to calculate the horizontal count during the real accumulation and adjust our estimation, but so far this is what i can say.
Until then friends, i'm sitting on cash enjoying stable daily interest.
DON'T FOMO, you can always buy later.

Looking for distribution and scam wicksI think this could be a long trap followed by a bear trap. I'm not saying it will happen and it doesn't have to happen, but if it does, I will watching to long the next capitulation or scam wick.

Bulltrap 4!After any fake pump by Elon Musk, there is such a nice short position for us.
Believe it or not, the market will stay bearish at least until the last weeks of summer.

CALX Death StarNYSE:CALX gave one of my favorite bars today which I like to call a Death Star. It is an outside bearish engulfing bar that tried (and failed) to make a new high. It is one of the worst bars you can see at the top of a chart.
This one also broke out of the top of the triangle (and failed) and then broke the bottom of the triangle and closed under the trendline all in one day.
It's going to take a Jedi to save this chart.

