28/9/2020 LCTITAN - Possible island reversal patternScenario 1 : If candle tomorrow open above gap and close above gap with high volume, island reversal pattern is completed and price will fly high.
(This is a rare and strong signal)
Scenario 2
The gap will be filled first before price continue climbing
Scenario 3
If candle tomorrow open below gap and close below gap with high volume, reversal candle pattern will be formed and the price will likely going down.
Bursamalaysia

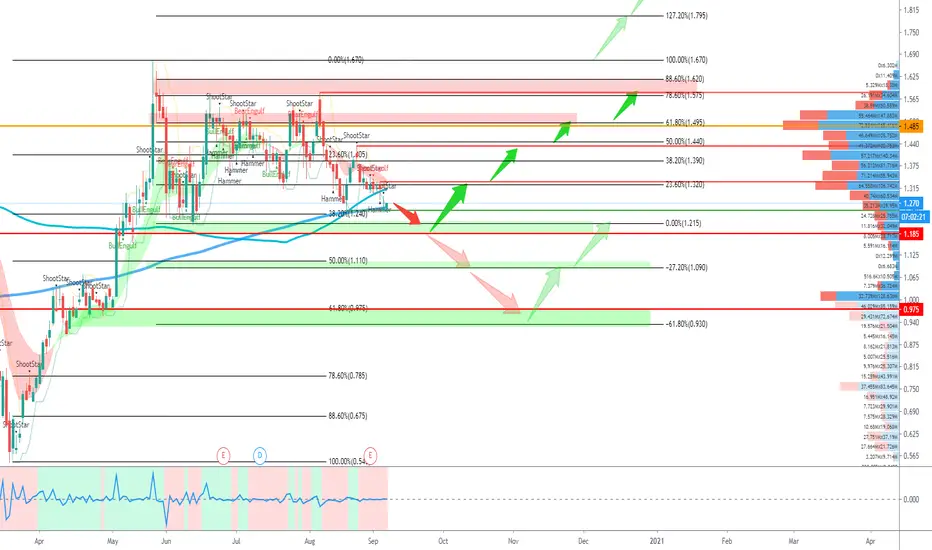
DSONIC - Testing Support and Pending More Signs of ReversalPlease consider your own interpretation of Opportunity & Risk:
Green Arrow (Transparency = 0) = Representing Main Price Path
Red Arrow (Transparency = 0) = Representing Main Price Path
Green Arrow (Transparency = 30%) = Representing Alternate Price Path
Red Arrow (Transparency = 30%) = Representing Alternate Price Path
NO BUY CALLS OR INVESTMENT ADVISED ARE PROVIDED.
DISCLAIMER: This analysis is for reference and learning purposes only. It is based on my personal view in the market from a technical analysis standpoint. None of information posted in this chart can be used as investment decisions or investment advises to any parties. Do not trade solely on the information posted in this page. Trade at your own risk and judgement. A trader could potentially lose all money. Only risk capital that can be lost without jeopardizing ones financial security of lifestyle. Please seek licensed professional guidance if you plan to invest your capital seriously.
PENAFIAN: Analysis ini hanyalah untuk tujuan rujukkan dan pembelajaran sahaja dan bukan cadangan untuk membeli atau menjual stok atau apa jua jenis instrumen kewangan. Anda dinasihatkan untuk menghubungi remieser / dealer / bank pelaburan yang mempunyai lesen atau kelayakan yang sah untuk bertanyakan pendapat dan menguruskan pelaburan anda. Pelaburan dan perdagangan mempunyai risiko tinggi, dan ianya adalah Risiko Anda Sendiri.


OPENSYSVolume is still in, starting of a rally, now, shall wait for structure to test support, before going higher. Up until now, no big sell-off yet.
Things could go wrong if :
(i) Political interference
(ii) Other systemic factors
(iii) Huge dump of shares


SMI TO THE MOONI been watching this stock since few week now. I have high hope and faith in this stock. You might see ultra spike volume past few week, but no yet selling volume. It mean this stock will fly ridiculous high. Now the price is at the support. It's stupid if you dont take your chance to entry and hold until it break the cup and handle pattern.
It either now, or never... Ride with me..

EKA NOODLE SEDAP DIMAKAN ENAK DIMAKANIt been while since we posting any trading idea, lately the market is real tough. So we had to guide and focus our circle to ensure to gain profit. Good to know they making money, even in tough market.
So why do i recommend EKA, the company with no strong FA and loyar punya company. If you see my drawing, this is called ascending triangle. The most valid pattern in bursa. You can see Eka has accumulate price since forever, before start to make this pattern. I believed it can go beyond 0.300sen. However who are we to predict the market. So i have draw line for you if you're interested in swing.
Remember parlo escobar, when we gave you at 0.09 sen, and now it already fly above 30sen. This is EKA ESCOBAR.


HLTShall test support and rebound higher, but do aware of political uncertainties, precedence in on March, nightmare. Make sure to set your stop losses.


PARLONo huge dumping of shares yet, am expecting Parlo to test recent support before reaching 0.595, we'll see. Am using 1 hour chart to find solid structure. Am using no indicators. * volume is the key
Could fail if :
*there is a huge dumping of shares
*no reversal candle supported with big volumes ( could be reversal or huge retracement )
*no interference of political matters
*no interference of other systemic factors

MALTON - Analysis by MFA @ 19-Sep-20Demonstration & Ilustration For Analysis Tools by MFA
Status: Currently in transition mode from Bearish Momentum to Bullish Momentum (Red to Green).
Bullish Signal: Confirmation by Yellow Arrow.
Arrow's Charateristic:~
Yellow: Strong Bullish Signal
Blue: Weak Bullish Signal
Red: Bearish Signal
Trading Style: Swing
Estimated Holding Period: 0-2 month
Disclaimer:~
The writing purpose is for demonstration & ilustration of Analysis Tools only.

ASIAPAC - Analysis by MFA @ 19-Sep-20Demonstration & Ilustration For Analysis Tools by MFA
Status: Currently in transition mode from Bearish Momentum to Bullish Momentum (Red to Green).
Bullish Signal: Confirmation by Yellow Arrow.
Arrow's Charateristic:~
Yellow: Strong Bullish Signal
Blue: Weak Bullish Signal
Red: Bearish Signal
Trading Style: Swing
Estimated Holding Period: 0-2 month
Disclaimer:~
The writing purpose is for demonstration & ilustration of Analysis Tools only.


GKENT trading idea by Beck Sabah ForexEntry point @ 0.725
Take profit 1 @ 0.870
Takr profit 2 @ 0.955
Stop limit @ 0.705


TOPGLOV next actWith the approaching QR, it could either go up to an all time high, or a rejection at resistance will see retest its support.

BURSA - Weekly Long Term Directional BiasPlease consider your own interpretation of Opportunity & Risk:
Green Arrow (Transparency = 0) = Representing Upside
Red Arrow (Transparency = 0) = Representing Downside
Green Arrow (Transparency = 30%) = Representing Alternate Price Path, or less probable outcomes
Red Arrow (Transparency = 30%) = Representing Alternate Price Path, or less probable outcomes
NO BUY CALLS OR INVESTMENT ADVISED ARE PROVIDED.
DISCLAIMER: This analysis is for reference and learning purposes only. It is based on my personal view in the market from a technical analysis standpoint. None of information posted in this chart can be used as investment decisions or investment advises to any parties. Do not trade solely on the information posted in this page. Trade at your own risk and judgement. A trader could potentially lose all money. Only risk capital that can be lost without jeopardizing ones financial security of lifestyle. Please seek licensed professional guidance if you plan to invest your capital seriously.
PENAFIAN: Analysis ini hanyalah untuk tujuan rujukkan dan pembelajaran sahaja dan bukan cadangan untuk membeli atau menjual stok atau apa jua jenis instrumen kewangan. Anda dinasihatkan untuk menghubungi remieser / dealer / bank pelaburan yang mempunyai lesen atau kelayakan yang sah untuk bertanyakan pendapat dan menguruskan pelaburan anda. Pelaburan dan perdagangan mempunyai risiko tinggi, dan ianya adalah Risiko Anda Sendiri.
