B/USDT – Descending Triangle Breakdown B/USDT – Descending Triangle Breakdown
pattern: descending triangle
timeframe: 3H ⏱️
status: support broken – breakdown in progress ⚠️
idea:
B has broken below key horizontal support at 0.3500–0.3550. If price sustains below and rejects this level on retest, further downside is likely 🔻
entry (confirmation): below 0.3500 or on retest rejection ❗
targets:
– tp1: 0.3300 🎯
– tp2: 0.3100 🎯
– tp3: 0.2900 or lower 🎯
stop loss: above 0.3650 or recent breakdown candle 🛑
note: breakdown with low volume could be a fakeout, wait for confirmation ⚠️
Busdt

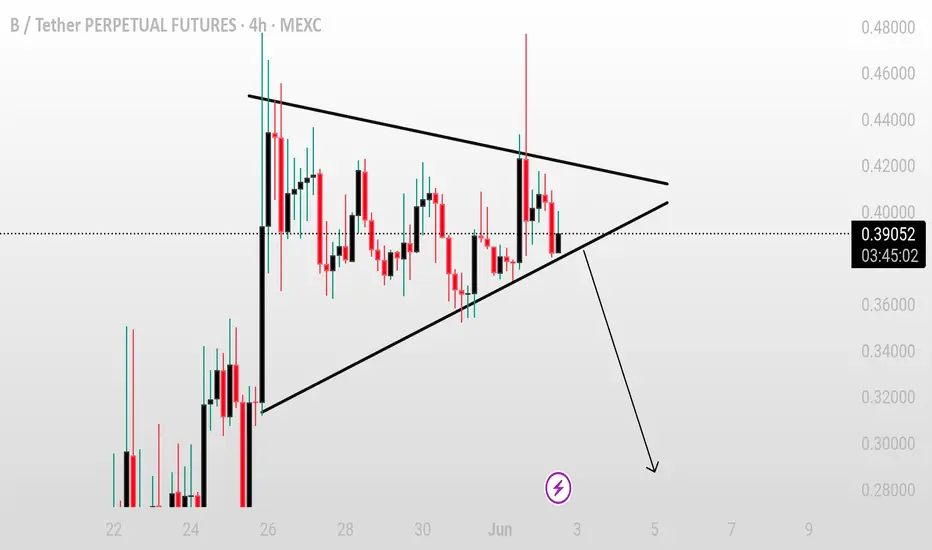
BUSDT/USDT – Symmetrical Triangle Breakdown SetupBUSDT/USDT – Symmetrical Triangle Breakdown Setup
BUSDT is currently trading within a symmetrical triangle pattern on the 4H timeframe, indicating price compression and a possible breakout or breakdown ahead. The price is now hovering near the lower trendline, and pressure is building up.
A clean breakdown below the support trendline with volume could confirm bearish continuation, opening the door for further downside. The projected move, if breakdown confirms, could lead price towards the next key support zones.
**Key Points:**
* Triangle formation tightening
* Watch for 4H candle close below the support line
* Breakdown confirmation could trigger a short setup
Keep this pair on your radar — confirmation and volume are key to validating the move.
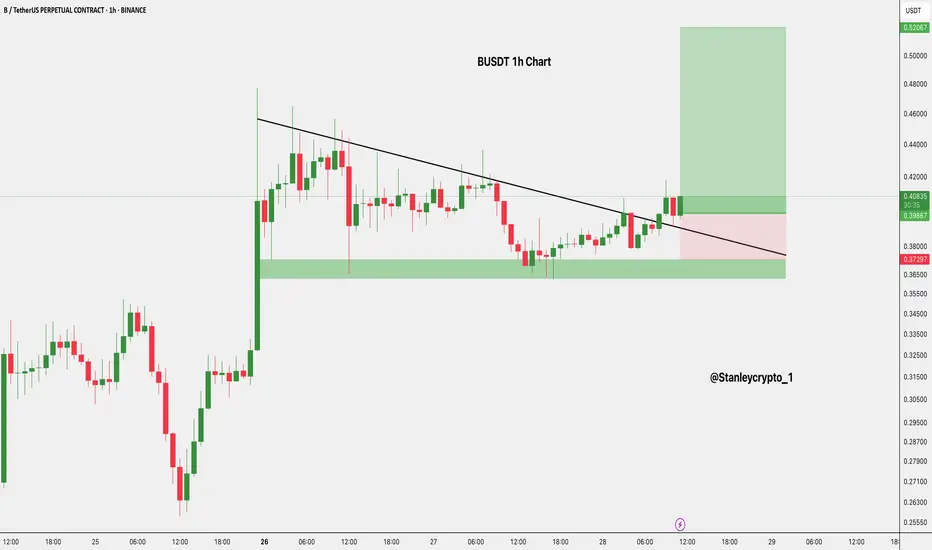
$BUSDT Trade Setup 1HMEXC:BUSDT Trade Setup (1H)
Entry: CMP
SL: $0.37796
TP: $0.47400 / $0.53300
Setup: Breakout above trendline with strong support at $0.37313.
Needs 1H close above $0.41 for confirmation.
DYRO, NFA

$BUSDT Ready to Explode? Breakout Could Send It Flying#BUSDT is demonstrating strong potential for a pennant breakout.
A successful breakout could trigger a +60% bullish rally in the coming days. 🚀
#Altseason2025

$B Long Setup 1H Chart Price has broken out of the trendline and is retesting the breakout zone
Strong support is seen around the $0.36–$0.37 demand zone.
- Entry: CMP
- Stop Loss: $0.37297
- Targets:
• TP1: $0.44455
• TP2: $0.53243
DYOR | NFA
BUSD the next UST? Binance investigated! I think many of the Binance IPO whales will move away from BNB and BUSD after the news that the Securities and Exchange Commission (SEC) is investigating Binance for the issuance of its cryptocurrency token Binance Coin.
A report from Reuters agency says that Binance unknowingly processed billions in illicit transactions, including illegal drug sales, hacks, and investment fraud totaling $2.35 billion!
I think this could lead to sell-off in the crypto market if it proves to be true.
Looking forward to read your opinion about it.

BNB what to do with Binance FUD? BUSDBNB what to do with Binance FUD?
I know about BUSD news. IS it real or FUD time will show
we need to follow order flow because whales will know about result way faster than we are


IDEX/BUSDT - cup with handle + inv head and shouldersHello everyone, analyzed the IDEX/BUSDT pair
The formation of a cup with a handle, as well as the possible formation of an inverted head and shoulders pattern.
It is worth noting that there is a small price gap on the 4 hour timeframe. Algorithms cover such areas. So I think the formation of an inverted head and shoulders is more than obvious.
To understand this, the price must consolidate below the resistance level for at least 1 day on the daily timeframe.
There is also a second option, it is a breakdown of the resistance level, and the price goes beyond these boundaries.
Target on the FIBO grid.
Stop loss - everyone chooses for himself, following his own trading system.
"This is just my opinion, trade with your trading system
Have a nice day and come back again."
Go to my free channel and chat with other traders. Link in the description
Write your opinion, whether there is a place to buy here, and open a long position
cup with handle + possible inverted "head and shoulders"
